Emtricitabine (Valade 2014)
Source:vignettes/articles/Valade_2014_emtricitabine.Rmd
Valade_2014_emtricitabine.RmdModel and source
- Citation: Valade E, Treluyer JM, Dabis F, Arrive E, Pannier E, Benaboud S, Fauchet F, Bouazza N, Foissac F, Urien S, Hirt D. (2014). Modified renal function in pregnancy: impact on emtricitabine pharmacokinetics. Br J Clin Pharmacol 78(6):1378-1386. doi:10.1111/bcp.12457
- Description: Two-compartment oral population PK model for emtricitabine (FTC) in HIV-infected pregnant and non-pregnant women, with first-order absorption and elimination. Creatinine clearance (Cockcroft-Gault, raw mL/min) on apparent oral clearance via the power model CL/F = 22.3 * (CRCL/135)^0.33 captures the 18% CL/F increase observed during pregnancy as a manifestation of the pregnancy-associated 50% rise in estimated glomerular filtration rate; pregnancy itself, gestational age, age, weight, serum creatinine and co-medication were screened but not retained after CLcr inclusion (Valade 2014, BJCP).
- Article: https://doi.org/10.1111/bcp.12457
Population
The model was developed from 179 HIV-infected women pooled across two studies (Valade 2014 Table 1; Methods, Patients and treatment):
- Cochin Hospital therapeutic drug monitoring (TDM) cohort, n = 148 women followed for routine FTC TDM, receiving 200 mg oral FTC daily under chronic combined antiretroviral therapy.
- TEmAA ANRS 12109 labour study (Ivory Coast, Cambodia, South Africa), n = 31 women at labour receiving a single oral 400 mg FTC dose at the start of labour for prevention of mother-to-child transmission, with samples at 1, 2, 3, 5, 8, 12 and 24 h post-dose.
After accounting for seven women who appeared in both pregnant and non-pregnant strata on different occasions, the cohort comprises 103 non-pregnant + 83 pregnant women. Within the pregnant stratum, 1 was in the first trimester, 26 in the second, 67 in the third (48 on the day of delivery). A total of 457 plasma concentrations were analysed; 14 (3%) below the limit of quantification (0.01 mg/L) were set to half-LOQ.
Median (range) baseline characteristics (Valade 2014 Table 1):
- Age: 35 (16-72) years overall; 31 (19-43) pregnant; 40 (16-72) non-pregnant.
- Body weight: 69 (37-130) kg overall.
- Serum creatinine: 60 (27-183) umol/L.
- Cockcroft-Gault creatinine clearance (CLcr): 135 (35-335) mL/min overall; 160 (70-335) in pregnant women; 106 (35-247) in non-pregnant women. The 50% rise in median CLcr during pregnancy is the load-bearing physiologic driver of the 18% rise in FTC apparent clearance.
- Gestational age (pregnant stratum): 37 (5-41) weeks.
The same information is available programmatically via
readModelDb("Valade_2014_emtricitabine")()$meta$population.
Model structure
FTC plasma kinetics were described by a two-compartment model with first-order absorption and elimination (Valade 2014 Results, “Population pharmacokinetics” paragraph; Methods, “Several structural models for FTC pharmacokinetics were investigated”). The final covariate model retains creatinine clearance on apparent clearance only:
CL/F = 22.3 * (CLcr / 135)^0.33where CLcr is raw Cockcroft-Gault creatinine clearance in mL/min and 135 mL/min is the population median (Valade 2014 final covariate equation in the Results paragraph following Table 2). Pregnancy itself, gestational age (tested as continuous, trimester-categorical, and Hill-saturation), age, body weight, serum creatinine, BW/Scr, and co-medication with TDF, PIs, NNRTIs and NRTIs all decreased the OFV individually but did not further improve the model after CLcr inclusion (“After the inclusion of CLcr on CL/F in the model, the addition of other covariates did not further improve the model”).
Inter-individual variability was retained on the absorption rate constant ka and on CL/F only. Residual variability used a proportional model with separate sigma estimates per study (a 12.4 OFV-point improvement over a single combined sigma); the packaged model defaults to the TDM-cohort sigma (200 mg chronic dose, 148/179 women) and documents the labour-cohort sigma in the Assumptions and deviations section below.
ODEs (depot -> central <->
peripheral1 as in
inst/modeldb/specificDrugs/Valade_2014_emtricitabine.R):
d/dt(depot)       = -ka * depot
d/dt(central)     =  ka * depot - kel * central - k12 * central + k21 * peripheral1
d/dt(peripheral1) =  k12 * central                                - k21 * peripheral1
Cc = central / vc
with kel = cl / vc, k12 = q / vc,
k21 = q / vp, and
cl = exp(lcl + etalcl) * (CRCL / 135)^0.33.
Source trace
Per-parameter origin is recorded as an in-file comment next to each
ini() entry in
inst/modeldb/specificDrugs/Valade_2014_emtricitabine.R. The
table below collects them in one place for review.
| Equation / parameter | Value | Source location |
|---|---|---|
| Two-compartment first-order | n/a | Valade 2014 Results “Population pharmacokinetics”; Methods “Several structural models” |
ka |
0.616 1/h | Valade 2014 Table 2 (RSE 32%) |
CL/F |
22.3 L/h | Valade 2014 Table 2 (RSE 3%) |
Vc/F |
100 L | Valade 2014 Table 2 (RSE 16%) |
Q/F |
5.89 L/h | Valade 2014 Table 2 (RSE 22%) |
Vp/F |
76.1 L | Valade 2014 Table 2 (RSE 28%) |
e_crcl_cl (beta_CLcr) |
0.33 (unitless) | Valade 2014 Table 2 (RSE 16%); equation CL/F = 22.3 * (CLcr/135)^0.33 in Results |
| Reference CLcr | 135 mL/min | Valade 2014 Table 1 (population median across all 179 women) |
omega_ka (IIV SD) |
0.503 (log scale) | Valade 2014 Table 2 (RSE 36%); variance = 0.503^2 = 0.253009 |
omega_CL/F (IIV SD) |
0.151 (log scale) | Valade 2014 Table 2 (RSE 14%); variance = 0.151^2 = 0.022801 |
propSd (sigma_1, TDM) |
0.505 (fraction) | Valade 2014 Table 2 (RSE 6%) – default; TDM study (200 mg chronic) |
| sigma_2 (TEmAA labour) | 0.373 (fraction) | Valade 2014 Table 2 (RSE 6%); see Assumptions and deviations |
Virtual cohort
Original observed data are not publicly available. The virtual cohort below approximates the demographic spread reported in Valade 2014 Table 1 across both pregnant and non-pregnant strata. Each subject receives a daily 200 mg oral FTC dose for seven days to reach steady state (matching the standard chronic dosing scenario characterised by the TDM study). CLcr is sampled per stratum from a truncated normal centred on the published stratum median with a spread spanning the published range; body weight and age are not model covariates so they are not simulated.
set.seed(20141104)
n_per_stratum <- 200L

obs_grid <- c(seq(0, 24, by = 0.25), seq(25, 7 * 24, by = 1))

make_cohort <- function(n, crcl_mean, crcl_sd, crcl_min, crcl_max,
                        stratum, id_offset = 0L) {
  crcl_draw <- pmin(pmax(rnorm(n, mean = crcl_mean, sd = crcl_sd),
                         crcl_min), crcl_max)
  cohort <- tibble::tibble(
    id      = id_offset + seq_len(n),
    CRCL    = crcl_draw,
    stratum = stratum
  )
  dose_rows <- cohort |>
    dplyr::mutate(time = 0, amt = 200, cmt = "depot", evid = 1L,
                  ii = 24, addl = 6L)
  obs_rows <- cohort |>
    tidyr::crossing(time = obs_grid) |>
    dplyr::mutate(amt = NA_real_, cmt = "Cc", evid = 0L,
                  ii = NA_real_, addl = NA_integer_)
  dplyr::bind_rows(dose_rows, obs_rows) |>
    dplyr::select(id, time, amt, cmt, evid, ii, addl, CRCL, stratum) |>
    dplyr::arrange(id, time, dplyr::desc(evid))
}

events <- dplyr::bind_rows(
  make_cohort(n_per_stratum,
              crcl_mean = 106, crcl_sd = 35,
              crcl_min  = 35,  crcl_max = 247,
              stratum   = "non-pregnant", id_offset = 0L),
  make_cohort(n_per_stratum,
              crcl_mean = 160, crcl_sd = 45,
              crcl_min  = 70,  crcl_max = 335,
              stratum   = "pregnant",     id_offset = n_per_stratum)
)
stopifnot(!anyDuplicated(unique(events[, c("id", "time", "evid")])))
Simulation
mod <- rxode2::rxode2(readModelDb("Valade_2014_emtricitabine"))
#> ℹ parameter labels from comments will be replaced by 'label()'
sim <- rxode2::rxSolve(mod, events = events,
                       keep = c("CRCL", "stratum"),
                       returnType = "data.frame")
For deterministic replication (typical-value time course), zero out the random effects:
mod_typical <- rxode2::rxode2(readModelDb("Valade_2014_emtricitabine")) |>
  rxode2::zeroRe()
#> ℹ parameter labels from comments will be replaced by 'label()'

typical_events <- tibble::tibble(
  id      = c(1L, 2L),
  CRCL    = c(106, 160),
  stratum = c("non-pregnant (CLcr = 106)", "pregnant (CLcr = 160)")
) |>
  (\(ct) dplyr::bind_rows(
    ct |> dplyr::mutate(time = 0, amt = 200, cmt = "depot", evid = 1L,
                        ii = 24, addl = 6L),
    ct |> tidyr::crossing(time = obs_grid) |>
      dplyr::mutate(amt = NA_real_, cmt = "Cc", evid = 0L,
                    ii = NA_real_, addl = NA_integer_)
  ))() |>
  dplyr::select(id, time, amt, cmt, evid, ii, addl, CRCL, stratum) |>
  dplyr::arrange(id, time, dplyr::desc(evid))

sim_typical <- rxode2::rxSolve(mod_typical, events = typical_events,
                               keep = c("CRCL", "stratum"),
                               returnType = "data.frame")
#> ℹ omega/sigma items treated as zero: 'etalka', 'etalcl'
#> Warning: multi-subject simulation without without 'omega'
Replicate published figures
Figure 1 / Figure 2 – 200 mg QD steady-state VPC envelope by pregnancy status
Valade 2014 Figure 1 validates the model via VPC against observed FTC concentrations stratified by dose; Figure 2 compares individual CL/F estimates between pregnant and non-pregnant women. The block below combines both views by plotting the simulated 5/50/95 percentile envelope of Cc over the last steady-state dosing interval for the non-pregnant and pregnant strata.
ss_start <- 6 * 24
ss_end   <- 7 * 24

vpc_df <- sim |>
  dplyr::filter(time >= ss_start, time <= ss_end) |>
  dplyr::mutate(rel_time = time - ss_start) |>
  dplyr::group_by(stratum, rel_time) |>
  dplyr::summarise(
    Q05 = quantile(Cc, 0.05, na.rm = TRUE),
    Q50 = quantile(Cc, 0.50, na.rm = TRUE),
    Q95 = quantile(Cc, 0.95, na.rm = TRUE),
    .groups = "drop"
  )

ggplot(vpc_df, aes(rel_time, Q50, fill = stratum, colour = stratum)) +
  geom_ribbon(aes(ymin = Q05, ymax = Q95), alpha = 0.25, colour = NA) +
  geom_line(linewidth = 0.9) +
  scale_y_log10() +
  labs(x = "Time after last dose (h)",
       y = "FTC plasma concentration Cc (mg/L, log scale)",
       fill = NULL, colour = NULL,
       title = "Steady-state 200 mg QD: simulated 5/50/95 percentile envelope by pregnancy status",
       caption = "Replicates the dose-200 mg panel of Valade 2014 Figure 1 and the stratum contrast of Figure 2.") +
  theme_minimal() +
  theme(legend.position = "bottom")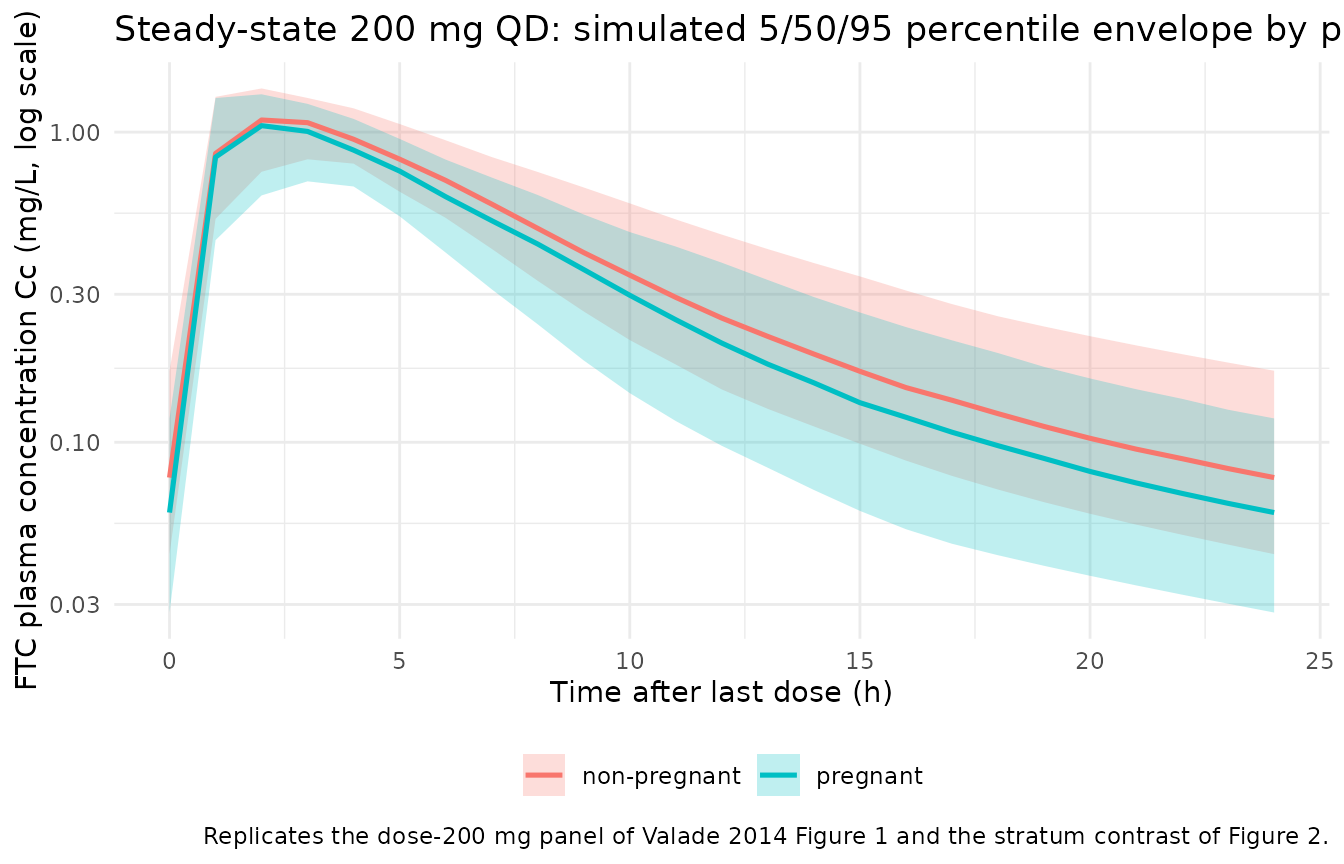
Typical-value Cc trajectory over the last dosing interval
typical_ss <- sim_typical |>
  dplyr::filter(time >= ss_start, time <= ss_end) |>
  dplyr::mutate(rel_time = time - ss_start)

ggplot(typical_ss, aes(rel_time, Cc, colour = stratum)) +
  geom_line(linewidth = 1.0) +
  labs(x = "Time after last dose (h)",
       y = "FTC plasma concentration Cc (mg/L)",
       colour = NULL,
       title = "Typical-value steady-state Cc at the published median CLcr per stratum",
       caption = "Pregnant CLcr median = 160 mL/min; non-pregnant CLcr median = 106 mL/min (Valade 2014 Table 1).") +
  theme_minimal() +
  theme(legend.position = "bottom")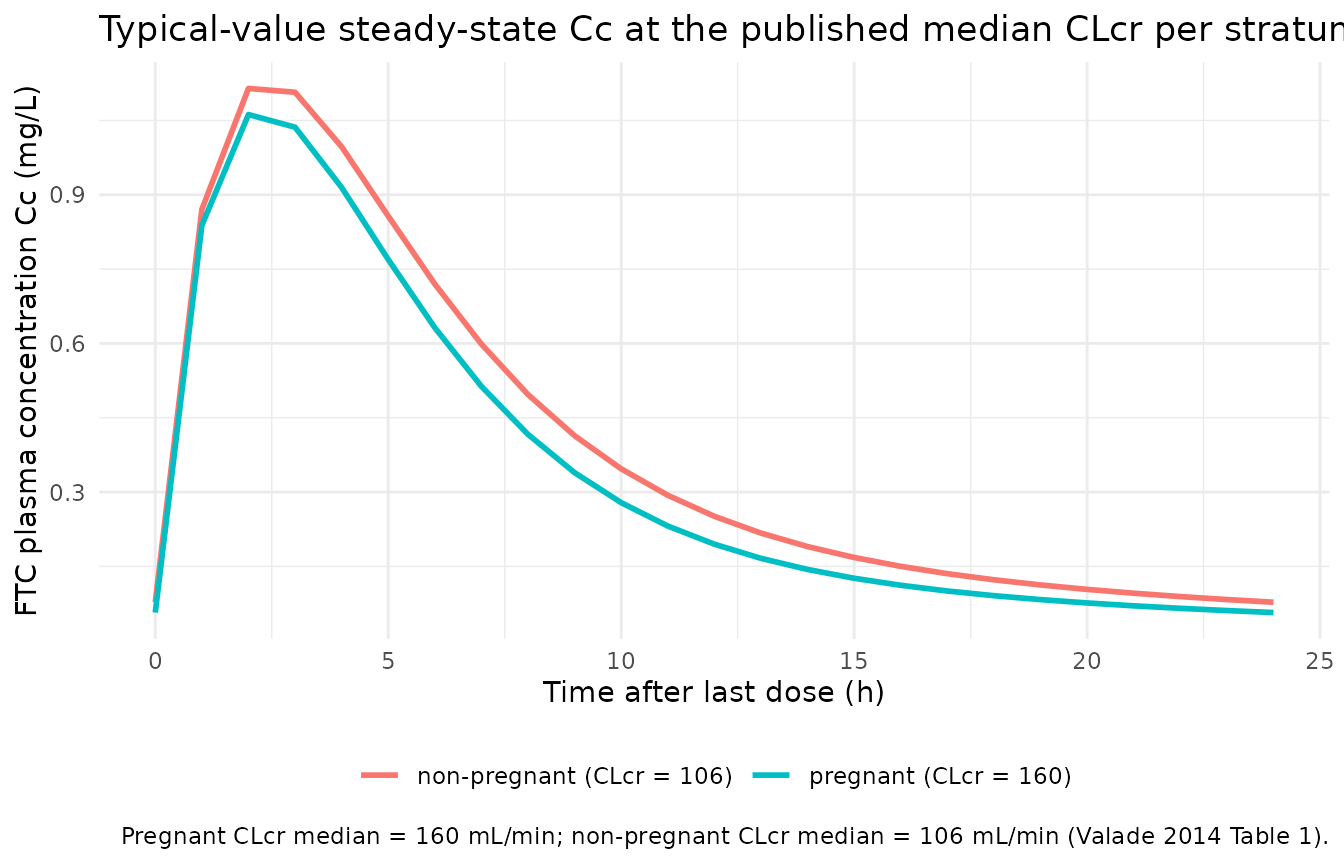
PKNCA validation
Two PKNCA blocks compute the steady-state AUC0-24 and Ctau (C24) over the last dosing interval, stratified by pregnancy status, so the simulated medians can be compared against the published Table 3 geometric means at 200 mg.
sim_nca <- sim |>
  dplyr::filter(time >= ss_start, time <= ss_end) |>
  dplyr::mutate(rel_time = time - ss_start) |>
  dplyr::select(id, rel_time, Cc, stratum) |>
  dplyr::filter(!is.na(Cc))

# Time-zero guarantee (relative to the dosing interval): for a stable
# steady-state interval the absorption-completed trough is already at
# rel_time = 0, but guard against the possibility that the simulation
# grid omitted it.
sim_nca <- dplyr::bind_rows(
  sim_nca,
  sim_nca |> dplyr::distinct(id, stratum) |>
    dplyr::mutate(rel_time = 0, Cc = NA_real_)
) |>
  dplyr::group_by(id, stratum, rel_time) |>
  dplyr::summarise(Cc = dplyr::first(stats::na.omit(Cc)), .groups = "drop") |>
  dplyr::arrange(id, rel_time) |>
  dplyr::filter(!is.na(Cc))

conc_obj <- PKNCA::PKNCAconc(
  data    = sim_nca,
  formula = Cc ~ rel_time | stratum + id,
  concu   = "mg/L",
  timeu   = "hr"
)

dose_df <- tibble::tibble(
  id      = unique(sim_nca$id)
) |>
  dplyr::left_join(unique(sim_nca[, c("id", "stratum")]), by = "id") |>
  dplyr::mutate(rel_time = 0, amt = 200)

dose_obj <- PKNCA::PKNCAdose(
  data    = dose_df,
  formula = amt ~ rel_time | stratum + id,
  doseu   = "mg"
)

intervals_24 <- data.frame(
  start    = 0,
  end      = 24,
  cmax     = TRUE,
  tmax     = TRUE,
  auclast  = TRUE,
  ctrough  = TRUE
)

nca_res <- suppressWarnings(PKNCA::pk.nca(
  PKNCA::PKNCAdata(conc_obj, dose_obj, intervals = intervals_24)
))
Comparison against published Table 3
Valade 2014 Table 3 reports AUC and C24 geometric means [min-max] for a 200 mg FTC dose, stratified by pregnancy status:
published <- tibble::tribble(
  ~stratum,        ~auclast, ~ctrough,
  "non-pregnant",  9.77,     0.079,
  "pregnant",      8.30,     0.054
)

cmp <- nlmixr2lib::ncaComparisonTable(
  simulated     = nca_res,
  reference     = published,
  by            = "stratum",
  params        = c("auclast", "ctrough"),
  units         = c(auclast = "mg/L*h", ctrough = "mg/L"),
  tolerance_pct = 20
)

knitr::kable(
  cmp,
  caption = "Simulated vs. published NCA (Valade 2014 Table 3, 200 mg dose). * differs from reference by >20%.",
  align   = c("l", "l", "r", "r", "r")
)| NCA parameter | stratum | Reference | Simulated | % diff |
|---|---|---|---|---|
| AUClast (mg/L*h) | non-pregnant | 9.77 | 9.4 | -3.7% |
| AUClast (mg/L*h) | pregnant | 8.3 | 8.44 | +1.7% |
| Ctrough (mg/L) | non-pregnant | 0.079 | 0.077 | -2.6% |
| Ctrough (mg/L) | pregnant | 0.054 | 0.0594 | +9.9% |
Assumptions and deviations
-
Two study-specific residual errors collapsed to
one. Valade 2014 reports a 12.4 OFV-point improvement from
estimating a separate proportional residual error for each study
(sigma_1 = 0.505 for the TDM cohort at 200 mg chronic; sigma_2 = 0.373
for the TEmAA labour cohort at 400 mg single). The packaged model
defaults to sigma_1 because the TDM cohort covers 148/179 women (83%)
and characterises the standard chronic 200 mg use case; the
labour-cohort sigma is documented in the in-file comment next to
propSdand a downstream user can substitute it by assigningmod$propSd <- 0.373before solving. -
Reference CLcr value (135 mL/min) is the population
median. The model uses raw Cockcroft-Gault creatinine clearance
in mL/min, NOT BSA-normalised to mL/min/1.73 m^2. The covariate is
stored under the canonical
CRCLcolumn withsource_name = "CLcr"to mark the source-column alias, perinst/references/covariate-columns.md(raw mL/min is an accepted assay form forCRCLwhen the source paper does not BSA-normalise; precedents includeDelattre_2010_amikacin.RandValade_2015_emtricitabine.R). -
Pregnancy is encoded mechanistically via CLcr rather than as
a binary indicator. Valade 2014 explicitly tests pregnancy and
gestational age as covariates on CL/F and finds them subsumed by CLcr
once the latter is in the model. Encoding the pregnancy effect through
the CLcr power-scaling submodel matches the paper’s final model exactly
and preserves the physiological interpretation: the 50% rise in median
CLcr during pregnancy (160 vs 106 mL/min) implies an 18% rise in CL/F
via
(160/135)^0.33 / (106/135)^0.33= 1.18, matching the geometric- mean ratio reported in Results (24.1 vs 20.5 L/h). -
Documented-but-unused covariates. Age, body weight,
serum creatinine, pregnancy indicator (PREG), gestational age (GA), and
associated antiretroviral co-medication (CONMED_ARV) were screened on
CL/F (continuous-, binary-, categorical-by-trimester, and Hill-form
effects per Valade 2014 Methods equations (i)-(iii)). None was retained
after CLcr inclusion. These covariates are documented in the model
file’s
covariatesDataExcludedlist so the screening trail is preserved without triggering “declared-but-unused” convention warnings. - CLcr distribution sampling. The virtual cohort samples CLcr from a truncated normal per stratum centred on the Table 1 stratum median with a spread chosen to span the published min-max range. The true CLcr distribution in HIV-infected women on cART is right-skewed and truncated below by the Cockcroft-Gault formula’s dependence on serum creatinine; sampling on the linear scale is an approximation. The CL/F geometric-mean ratio between strata (1.18) is preserved because it depends only on the ratio of stratum medians and the 0.33 exponent, not on the distribution shape.
-
Race / ethnicity. Not reported in Valade 2014
(mixed Paris-region TDM cohort + Ivory Coast / Cambodia / South Africa
labour cohort).
population$race_ethnicityis set to"Not reported"; the virtual cohort does not stratify by race because the model does not include a race covariate. -
Erratum check. Searched the British Journal of
Clinical Pharmacology landing page for the article, the publisher’s
corrections feed, PubMed, and Google Scholar for
"Valade 2014 emtricitabine" erratum– no published correction identified as of the extraction date (2026-06-18).