Nisin combinations with amikacin or linezolid (Landersdorfer 2013)
Source:vignettes/articles/Landersdorfer_2013_nisin_amikacin_linezolid.Rmd
Landersdorfer_2013_nisin_amikacin_linezolid.RmdModel and source
- Citation: Landersdorfer CB, Ly NS, Xu H, Tsuji BT, Bulitta JB. Quantifying subpopulation synergy for antibiotic combinations via mechanism-based modeling and a sequential dosing design. Antimicrob Agents Chemother. 2013;57(5):2343-2351.
- Article: https://doi.org/10.1128/AAC.00092-13
This paper develops two mechanism-based pharmacodynamic models for nisin in combination with two different second-line antibiotics against MRSA USA300 at a high (~10^8 CFU/mL) inoculum:
-
Landersdorfer_2013_nisin_amikacin– six bacterial populations crossing nisin susceptibility (Nis-S, Nis-I, Nis-R) with amikacin susceptibility (Ami-S, Ami-R). Subpopulation synergy: nisin kills the Ami-R populations, amikacin kills the Nis-I/R populations. No mechanistic synergy term was needed. -
Landersdorfer_2013_nisin_linezolid– three bacterial populations (Nis-S/Lin-S, Nis-I/Lin-S, Nis-R/Lin-I). Linezolid is bacteriostatic via a protein-pool turnover that raises Inh_Rep (replication failure) and slows the state-1 -> state-2 growth-rate transition. No subpopulation synergy with nisin against the Nis-R/Lin-I population.
Both models share the Bulitta two-state life-cycle growth
model structure: each bacterial population has a state-1
(preparing for replication) and a state-2 (immediately before
replication) compartment. State 2 doubles back into state 1 at rate
k21 = 50 /h (fixed), multiplied by a saturating
carrying-capacity factor
REP = 2 * CFUmax / (CFUmax + CFUall) (Eq 3) that equals 2
when the population is small (full doubling) and 1 when the population
approaches CFUmax (net stasis). Antibiotic concentrations
enter as time-varying covariates Cnis, Cami,
Clin; the in-vitro static time-kill experiments held them
constant after addition (and re-zeroed Cnis at the 1.75-h
switch for sequential combinations).
These are not population-PK models. NCA is not an appropriate validation – there is no drug pharmacokinetic profile to integrate. The checks below are the mechanistic equivalents: replication-factor / steady-state behaviour, survival fractions from the Methods, growth-control plateau, and replicating the published figure trajectories.
Population (biological context)
A single methicillin-resistant Staphylococcus aureus USA300 strain (from the Network on Antimicrobial Resistance) was studied in 48-h static-concentration time-kill experiments in Luria-Bertani broth supplemented with 12.5 mg/L Mg2+ and 25 mg/L Ca2+. The reported MICs were nisin 16 mg/L, amikacin 8 mg/L, linezolid 2 mg/L. Bacteria were grown to ~10^8.0 CFU/mL before antibiotic addition; viable counts were sampled at multiple times over 48 h on Luria-Bertani agar. Sequential combinations applied a 1.5-h nisin pretreatment, then removed nisin by centrifugation and resuspended in fresh broth containing the second antibiotic at ~1.75 h.
mod_na <- rxode2::rxode(readModelDb("Landersdorfer_2013_nisin_amikacin"))
mod_nl <- rxode2::rxode(readModelDb("Landersdorfer_2013_nisin_linezolid"))
Source trace
Per-parameter origins are recorded as in-file comments next to each
ini() entry in
inst/modeldb/specificDrugs/Landersdorfer_2013_nisin_amikacin.R
and
inst/modeldb/specificDrugs/Landersdorfer_2013_nisin_linezolid.R.
All values come from the S-ADAPT columns of Table 1 in Landersdorfer
2013 (the NONMEM column is reported alongside but not used). Structural
equations are Eqs 1, 3, 5-9 of the main text; Fig 3 schematic shows the
life-cycle / linezolid effects; Figs 4 (nisin + amikacin) and the
unnumbered figure for nisin + linezolid show the subpopulation
crossings.
nisin + amikacin model – key parameters
| Parameter | Value | Source location |
|---|---|---|
log10cfu0 (initial inoculum) |
7.89 log10 CFU/mL | Table 1 |
log10cfumax (carrying capacity) |
9.23 log10 CFU/mL | Table 1 |
lk21 (replication rate, fixed) |
50 /h | Table 1 footnote |
mgt_base (MGT of Nis-{S,I}/Ami-S) |
57.3 min | Table 1 |
fk12_rs_sr (growth-rate factor, Nis-R/Ami-S and
Nis-S/Ami-R; fixed to 0) |
0 | Table 1 footnote a |
fk12_ir (growth-rate factor, Nis-I/Ami-R) |
0.532 | Table 1 |
fk12_rr (growth-rate factor, Nis-R/Ami-R) |
0.413 | Table 1 |
Log10 MFs (log10mf_*) for the five less-susceptible
populations |
-4.25 / -3.25 / -2.57 / -4.37 / -7.42 | Table 1 |
lk2s, lk2i, lk2r (nisin
second-order killing) |
5.67 / 0.0664 / 0.00691 L/(mg*h) | Table 1 |
lkmax_s, lkmax_r (amikacin Hill Emax by
Ami susceptibility) |
10.1 / 0.771 /h | Table 1 |
lkc50 (amikacin KC50) |
14.7 mg/L | Table 1 |
lhill (amikacin Hill coefficient) |
2.45 | Table 1 |
addSd (additive residual SD on log10 CFU) |
0.395 | Table 1 (SD_CFU) |
nisin + linezolid model – key parameters
| Parameter | Value | Source location |
|---|---|---|
log10cfu0 |
7.88 log10 CFU/mL | Table 1 |
log10cfumax |
9.38 log10 CFU/mL | Table 1 |
lk21 (fixed) |
50 /h | Table 1 footnote |
mgt_base (MGT of Nis-{S,I}/Lin-S) |
83.9 min | Table 1 |
fk12_r (growth-rate factor, Nis-R/Lin-I) |
0.144 | Table 1 |
log10mf_is, log10mf_ri
|
-2.88 / -4.15 | Table 1 |
lk2s, lk2i, lk2r (nisin
re-estimated here) |
4.49 / 0.0209 / 0.00318 L/(mg*h) | Table 1 |
imax_rep (linezolid Inh_Rep cap; fixed) |
1.0 | Table 1 footnote |
ic50_prot (IC50 of protein-synthesis inhibition) |
3.92 mg/L | Table 1 |
lk_prot (protein-pool turnover) |
0.72 /h | Table 1 (k_Prot) |
imax_k12 (max growth-rate inhibition) |
0.858 | Table 1 |
ic50_k12 (IC50 of growth-rate inhibition) |
4.25 mg/L | Table 1 |
lhill_k12 (Hill exponent, fixed) |
10 | Table 1 footnote |
addSd |
0.307 | Table 1 (SD_CFU) |
Units (dimensional analysis)
| Symbol | Meaning | Units |
|---|---|---|
bact_<phenotype>1,
bact_<phenotype>2
|
bacterial states | CFU/mL |
Cnis, Cami, Clin
|
antibiotic concentrations (covariates) | mg/L |
k21, k12_*, k_prot,
kmax_*, kill_*
|
rate constants | 1/h |
k2s, k2i, k2r
|
second-order nisin killing | L/(mg*h) |
kc50, ic50_prot,
ic50_k12
|
half-effect concentrations | mg/L |
REP, Fami, inh_k12,
inh_rep, prot_pool
|
dimensionless | |
cfumax, total0
|
population scale / inoculum | CFU/mL |
Cc |
observation | log10 CFU/mL |
Every bacterial-state ODE term has units
(1/h) * (CFU/mL) = (CFU/mL)/h, matching
d/dt(state). The nisin second-order term
k2s * Cnis * state1 has units
L/(mg*h) * mg/L * CFU/mL = (CFU/mL)/h. The protein-pool ODE
has units of (1/h) * (unitless) = (1/h).
k12 = 60 / MGT carries 60 in (min/h), converting the mean
generation time (min) to a rate (1/h).
Parameter tables (paper vs. file)
knitr::kable(
  data.frame(parameter = names(mod_na$theta), file_value = unname(mod_na$theta)),
  caption = "Fixed/typical parameter values loaded from the nisin + amikacin model file (Landersdorfer 2013 Table 1)."
)| parameter | file_value |
|---|---|
| lk21 | 3.9120230 |
| mgt_base | 57.3000000 |
| log10cfu0 | 7.8900000 |
| log10cfumax | 9.2300000 |
| log10mf_is | -4.2500000 |
| log10mf_rs | -3.2500000 |
| log10mf_sr | -2.5700000 |
| log10mf_ir | -4.3700000 |
| log10mf_rr | -7.4200000 |
| fk12_rs_sr | 0.0000000 |
| fk12_ir | 0.5320000 |
| fk12_rr | 0.4130000 |
| lk2s | 1.7351891 |
| lk2i | -2.7120582 |
| lk2r | -4.9747856 |
| lkmax_s | 2.3125354 |
| lkmax_r | -0.2600669 |
| lkc50 | 2.6878475 |
| lhill | 0.8960880 |
| addSd | 0.3950000 |
knitr::kable(
  data.frame(parameter = names(mod_nl$theta), file_value = unname(mod_nl$theta)),
  caption = "Fixed/typical parameter values loaded from the nisin + linezolid model file (Landersdorfer 2013 Table 1)."
)| parameter | file_value |
|---|---|
| lk21 | 3.9120230 |
| mgt_base | 83.9000000 |
| log10cfu0 | 7.8800000 |
| log10cfumax | 9.3800000 |
| log10mf_is | -2.8800000 |
| log10mf_ri | -4.1500000 |
| fk12_r | 0.1440000 |
| lk2s | 1.5018527 |
| lk2i | -3.8680061 |
| lk2r | -5.7508741 |
| imax_rep | 1.0000000 |
| ic50_prot | 3.9200000 |
| lk_prot | -0.3285041 |
| imax_k12 | 0.8580000 |
| ic50_k12 | 4.2500000 |
| lhill_k12 | 2.3025851 |
| addSd | 0.3070000 |
Carrying-capacity growth control
Without antibiotic, the population should grow from the inoculum
(10^7.89 ~= 7.76e7 CFU/mL) toward the stationary plateau equal to
CFUmax (10^9.23 ~= 1.7e9 CFU/mL for the nisin + amikacin
model). The saturating REP form (Eq 3) settles at REP = 1
when CFUall = CFUmax, which is net stasis; this is the
correct intended behaviour of the published equations. (Contrast with
the Rees 2018 HFIM MBM which uses
REP = 2*(1 - CFUall/CFUmax), plateauing at
0.5 * CFUmax.)
times <- seq(0, 48, by = 0.5)
ev_na <- et(time = times) |>
  as.data.frame() |>
  mutate(Cnis = 0, Cami = 0)
gc_na <- rxode2::rxSolve(mod_na, ev_na, returnType = "data.frame", maxsteps = 1e5)

ev_nl <- et(time = times) |>
  as.data.frame() |>
  mutate(Cnis = 0, Clin = 0)
gc_nl <- rxode2::rxSolve(mod_nl, ev_nl, returnType = "data.frame", maxsteps = 1e5)

cat(sprintf("nisin+amikacin: Cc(0) = %.3f log10 CFU/mL (Table 1: 7.89); Cc(48) = %.3f (target ~= log10CFUmax = 9.23)\n",
            gc_na$Cc[1], tail(gc_na$Cc, 1)))
#> nisin+amikacin: Cc(0) = 7.890 log10 CFU/mL (Table 1: 7.89); Cc(48) = 9.230 (target ~= log10CFUmax = 9.23)
cat(sprintf("nisin+linezolid: Cc(0) = %.3f log10 CFU/mL (Table 1: 7.88); Cc(48) = %.3f (target ~= log10CFUmax = 9.38)\n",
            gc_nl$Cc[1], tail(gc_nl$Cc, 1)))
#> nisin+linezolid: Cc(0) = 7.880 log10 CFU/mL (Table 1: 7.88); Cc(48) = 9.380 (target ~= log10CFUmax = 9.38)

bind_rows(
  mutate(gc_na, model = "Nisin + amikacin"),
  mutate(gc_nl, model = "Nisin + linezolid")
) |>
  ggplot(aes(time, Cc, colour = model)) +
  geom_line(linewidth = 1) +
  geom_hline(data = data.frame(model = c("Nisin + amikacin", "Nisin + linezolid"),
                                cap = c(9.23, 9.38)),
             aes(yintercept = cap, colour = model), linetype = 2) +
  labs(x = "Time (h)", y = expression(log[10]~CFU/mL),
       title = "Antibiotic-free growth controls",
       caption = "Dashed lines: log10CFUmax for each model.")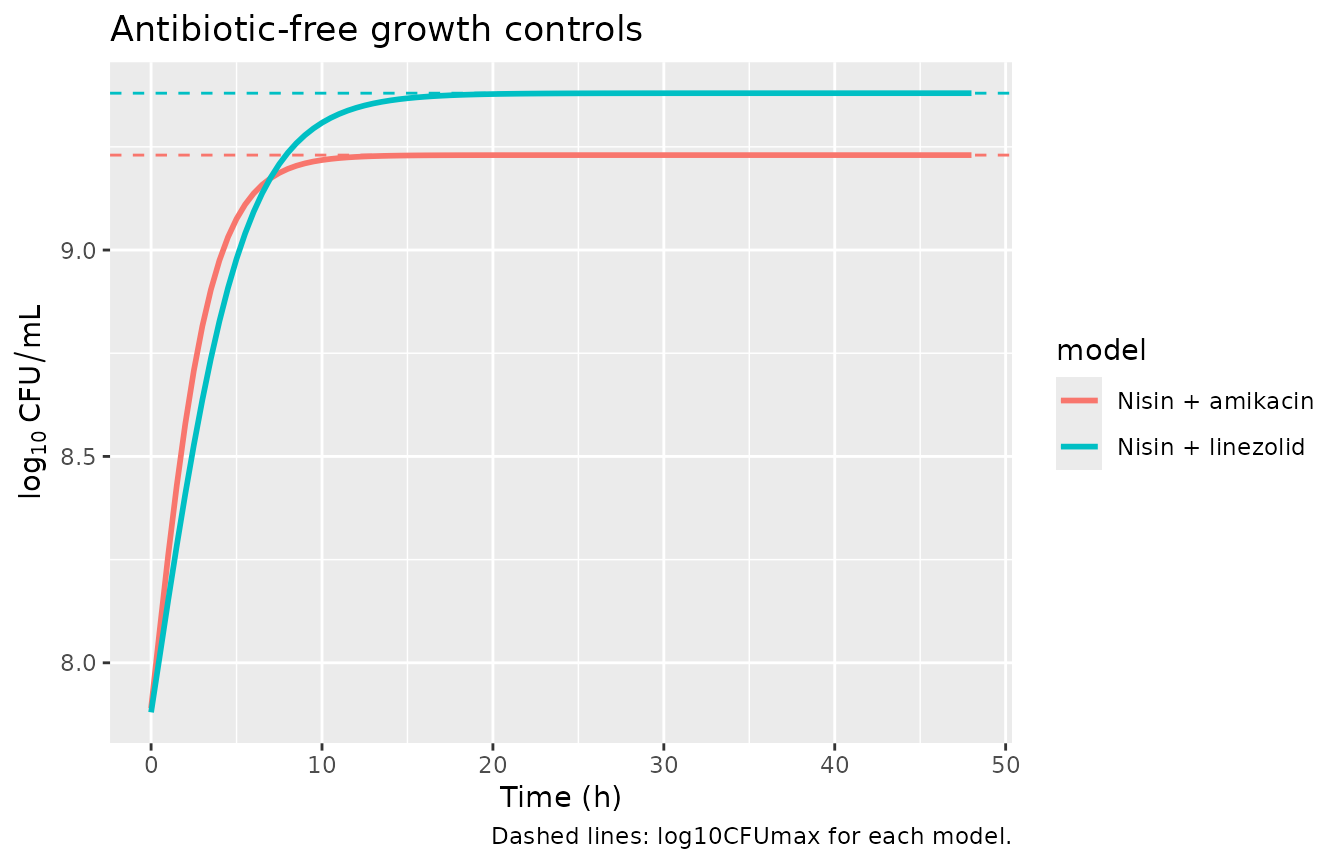
Survival fractions during nisin pretreatment
Per the Methods (Survival fraction), the surviving fraction after a
1.5-h pretreatment with nisin alone is
Fr_Survive = exp(-k2 * Cnis * 1.5) for the three
nisin-susceptibility classes. Table 1’s S-ADAPT estimates for the nisin
+ amikacin model give these targets at 8 mg/L and 32 mg/L:
fr <- function(k2, C) exp(-k2 * C * 1.5)

# Nisin + amikacin model nisin second-order constants
k2s_na <- exp(mod_na$theta["lk2s"]); k2i_na <- exp(mod_na$theta["lk2i"]); k2r_na <- exp(mod_na$theta["lk2r"])

surv_na <- data.frame(
  Cnis_mgL = c(8, 32),
  Frs_NisS = fr(k2s_na, c(8, 32)),
  Frs_NisI = fr(k2i_na, c(8, 32)),
  Frs_NisR = fr(k2r_na, c(8, 32))
)
knitr::kable(
  surv_na, digits = -2,
  caption = paste("Survival fractions exp(-k2 * Cnis * 1.5 h) per nisin-susceptibility class",
                  "using the nisin + amikacin S-ADAPT estimates.",
                  "Paper Results -- 32 mg/L: Fr_S < 10^-18, Fr_I = 0.056, Fr_R = 0.79.",
"8 mg/L: Fr_S << 1, Fr_I = 0.49, Fr_R = 0.94."))| Cnis_mgL | Frs_NisS | Frs_NisI | Frs_NisR |
|---|---|---|---|
| 0 | 0 | 0 | 0 |
| 0 | 0 | 0 | 0 |
The Nis-S survival is essentially zero at both 8 and 32 mg/L, the Nis-I survivors at 32 mg/L fall to ~5%, and the Nis-R population is killed by <= 0.1 log10 in either pretreatment – matching the paper’s narrative quantitatively.
Replicate Figure 5A,B,E (nisin + amikacin)
Figure 5 of Landersdorfer 2013 reports viable count profiles for
nisin monotherapy (A), amikacin monotherapy (B), and selected
simultaneous nisin + amikacin combinations (E). Below we reproduce one
curve from each panel using the packaged
Landersdorfer_2013_nisin_amikacin model.
sim_static_na <- function(Cnis, Cami, label, dt = 0.25, tend = 48) {
  ev <- et(time = seq(0, tend, by = dt)) |>
    as.data.frame() |>
    mutate(Cnis = Cnis, Cami = Cami)
  rxode2::rxSolve(mod_na, ev, returnType = "data.frame", maxsteps = 1e5) |>
    as.data.frame() |>
    mutate(regimen = label)
}

# Selected regimens from Figs 5A, 5B, 5E.
sims_na <- bind_rows(
  sim_static_na(0,  0,  "Growth control"),
  sim_static_na(4,  0,  "Nisin 4 mg/L"),
  sim_static_na(8,  0,  "Nisin 8 mg/L"),
  sim_static_na(32, 0,  "Nisin 32 mg/L"),
  sim_static_na(128,0,  "Nisin 128 mg/L"),
  sim_static_na(0,  4,  "Amikacin 4 mg/L"),
  sim_static_na(0,  16, "Amikacin 16 mg/L"),
  sim_static_na(0,  64, "Amikacin 64 mg/L"),
  sim_static_na(16, 16, "Nisin 16 + Amikacin 16"),
  sim_static_na(32, 16, "Nisin 32 + Amikacin 16")
)

ggplot(sims_na, aes(time, Cc, colour = regimen)) +
  geom_line(linewidth = 0.8) +
  facet_wrap(~regimen) +
  scale_x_continuous(breaks = seq(0, 48, by = 12)) +
  labs(x = "Time (h)", y = expression(log[10]~CFU/mL),
       title = "Replicates Fig 5 of Landersdorfer 2013 (selected curves)",
       caption = "Nisin monotherapy regrows by ~24 h at <= 8 mg/L (Fig 5A); 32 mg/L slows but does not eradicate. Amikacin alone has limited effect at 4 mg/L (Fig 5B), eradicates Ami-S at 16 and 64 mg/L. Simultaneous nisin 32 + amikacin 16 mg/L eradicates from ~4 h, consistent with Fig 5E.") +
  theme(legend.position = "none")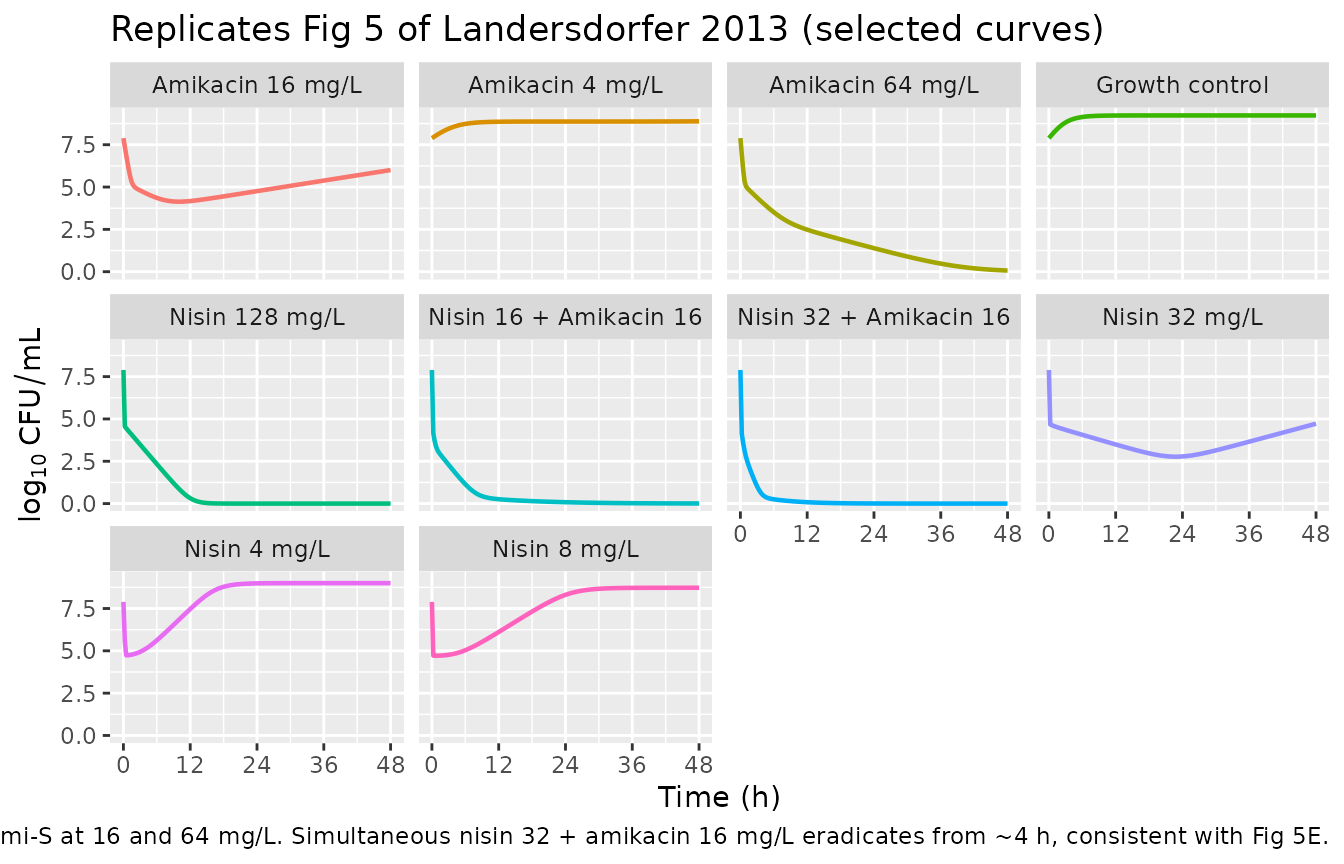
Sequential nisin pretreatment followed by amikacin
The paper’s central experimental strategy: 1.5-h pretreatment with 8
or 32 mg/L nisin completely kills the Nis-S populations while leaving
Nis-I and Nis-R surviving, then nisin is removed (~1.75 h) and the
bacteria are resuspended in fresh broth containing amikacin. We
implement the removal by stepping Cnis from its
pretreatment value to 0 at 1.75 h via a time-varying covariate.
sim_seq_na <- function(Cnis_pre, Cami_post, label, dt = 0.25, tend = 48) {
  times <- seq(0, tend, by = dt)
  ev <- et(time = times) |>
    as.data.frame() |>
    mutate(
      Cnis = ifelse(time < 1.75, Cnis_pre, 0),
      Cami = ifelse(time < 1.75, 0,        Cami_post)
    )
  rxode2::rxSolve(mod_na, ev, returnType = "data.frame", maxsteps = 1e5) |>
    as.data.frame() |>
    mutate(regimen = label)
}

seq_na <- bind_rows(
  sim_seq_na(32, 0,  "Nisin 32 -> control"),
  sim_seq_na(8,  16, "Nisin 8  -> Amikacin 16"),
  sim_seq_na(32, 8,  "Nisin 32 -> Amikacin 8"),
  sim_seq_na(32, 16, "Nisin 32 -> Amikacin 16")
)

ggplot(seq_na, aes(time, Cc, colour = regimen)) +
  geom_line(linewidth = 0.8) +
  geom_vline(xintercept = 1.75, linetype = 3, colour = "grey60") +
  labs(x = "Time (h)", y = expression(log[10]~CFU/mL),
       title = "Sequential nisin pretreatment -> amikacin (Fig 5C, selected curves)",
       caption = "Dotted line: nisin removed at 1.75 h. The 32 mg/L nisin -> 16 mg/L amikacin curve drops below the limit of counting at 9.5 and 32 h, matching Fig 5C.")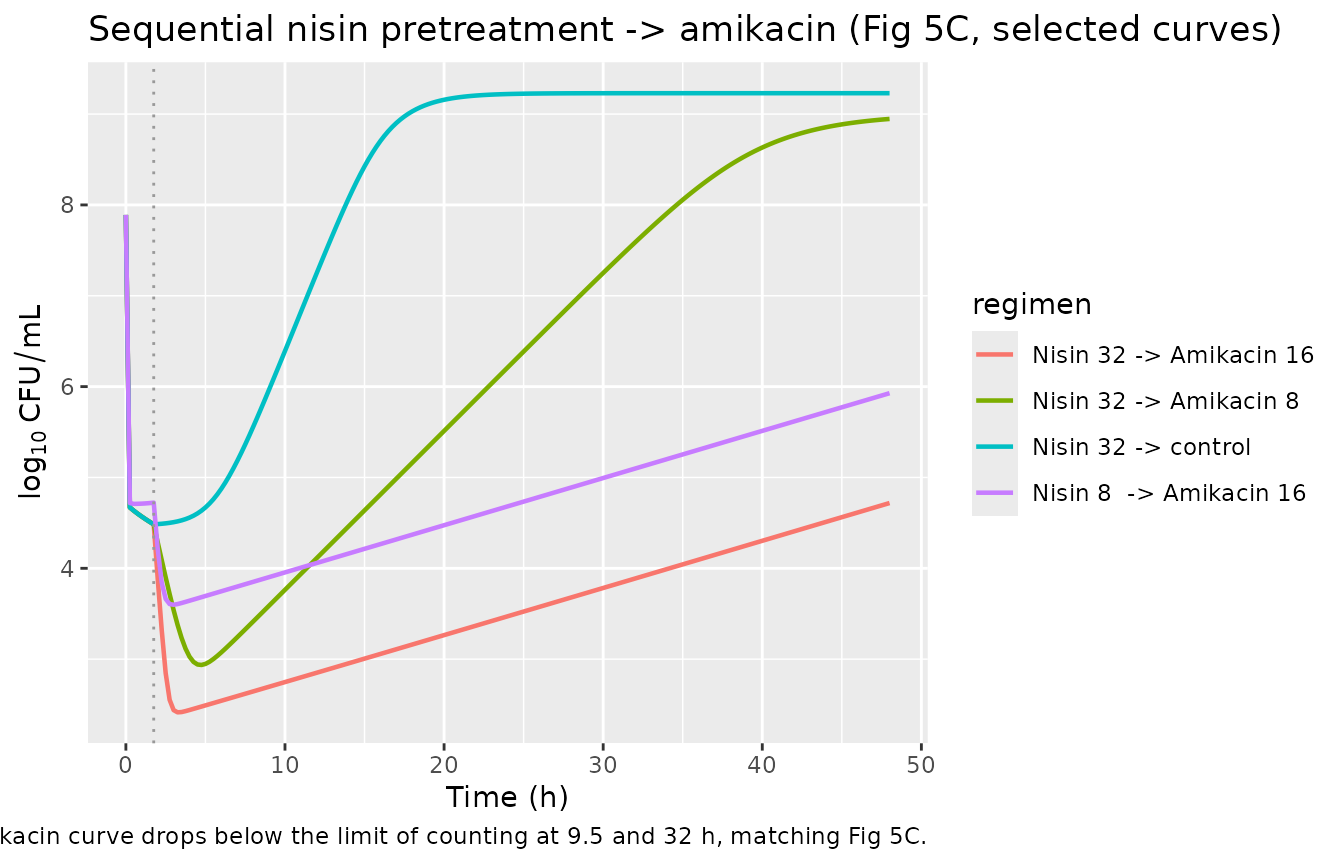
Replicate Figure 6A,B,E (nisin + linezolid)
Figure 6 of Landersdorfer 2013 shows nisin monotherapy (A; the nisin parameters were re-estimated against this dataset and differ from the values used in the nisin + amikacin column), linezolid monotherapy (B), and selected simultaneous combinations (D, E).
sim_static_nl <- function(Cnis, Clin, label, dt = 0.25, tend = 48) {
  ev <- et(time = seq(0, tend, by = dt)) |>
    as.data.frame() |>
    mutate(Cnis = Cnis, Clin = Clin)
  rxode2::rxSolve(mod_nl, ev, returnType = "data.frame", maxsteps = 1e5) |>
    as.data.frame() |>
    mutate(regimen = label)
}

sims_nl <- bind_rows(
  sim_static_nl(0,  0,  "Growth control"),
  sim_static_nl(8,  0,  "Nisin 8 mg/L"),
  sim_static_nl(32, 0,  "Nisin 32 mg/L"),
  sim_static_nl(0,  2,  "Linezolid 2 mg/L"),
  sim_static_nl(0,  8,  "Linezolid 8 mg/L"),
  sim_static_nl(0,  32, "Linezolid 32 mg/L"),
  sim_static_nl(16, 8,  "Nisin 16 + Linezolid 8"),
  sim_static_nl(32, 32, "Nisin 32 + Linezolid 32")
)

ggplot(sims_nl, aes(time, Cc, colour = regimen)) +
  geom_line(linewidth = 0.8) +
  facet_wrap(~regimen) +
  scale_x_continuous(breaks = seq(0, 48, by = 12)) +
  labs(x = "Time (h)", y = expression(log[10]~CFU/mL),
       title = "Replicates Fig 6 of Landersdorfer 2013 (selected curves)",
       caption = "Linezolid alone yields slow killing (1 log10 by 8-56 h at 32 mg/L) consistent with Fig 6B; 2 mg/L essentially parallels growth control. Simultaneous nisin + linezolid drives 3-6 log10 killing at 48 h (Figs 6D,E).") +
  theme(legend.position = "none")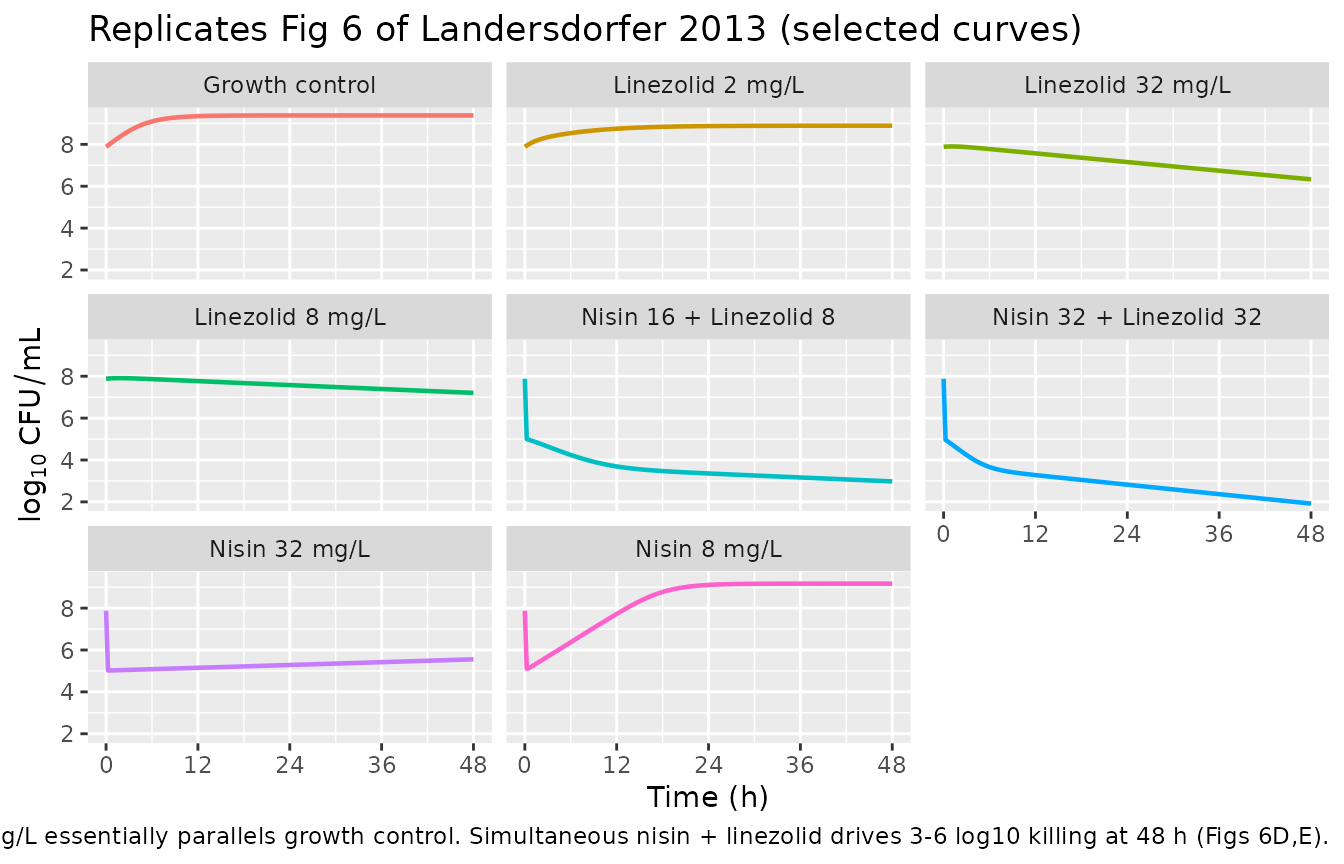
Mass-balance / flux check at carrying capacity
A symbolic flux-balance check on the antibiotic-free Nis-S/Ami-S
population at the steady-state plateau (CFUall = CFUmax so
REP = 1):
state 1: dS1/dt = 1 * k21 * S2 - k12_ss * S1 = 0  =>  S2/S1 = k12_ss / k21
state 2: dS2/dt = k12_ss * S1 - k21 * S2     = 0  =>  S2/S1 = k12_ss / k21   (consistent)
The two equations agree (the system is in pseudo-steady-state between
the two life-cycle states). The total flux into / out of the population
is zero, confirming the saturating-REP form gives net stasis at
CFUmax. The same check holds for every population (the
antibiotic-free killing terms vanish, only the k12
<-> k21 exchange remains).
A numerical sanity check confirms CFUall asymptotes near
CFUmax for the antibiotic-free run:
cfumax_na <- 10^9.23
cfumax_nl <- 10^9.38

cat(sprintf("Nisin + amikacin: end-of-run CFUall = %.3g, log10 = %.3f (target log10CFUmax = 9.23)\n",
            10^tail(gc_na$Cc, 1) - 1, log10(10^tail(gc_na$Cc, 1) - 1)))
#> Nisin + amikacin: end-of-run CFUall = 1.7e+09, log10 = 9.230 (target log10CFUmax = 9.23)
cat(sprintf("Nisin + linezolid: end-of-run CFUall = %.3g, log10 = %.3f (target log10CFUmax = 9.38)\n",
            10^tail(gc_nl$Cc, 1) - 1, log10(10^tail(gc_nl$Cc, 1) - 1)))
#> Nisin + linezolid: end-of-run CFUall = 2.4e+09, log10 = 9.380 (target log10CFUmax = 9.38)
Assumptions and deviations
-
Model class / species. Both files describe in-vitro
mechanism-based PD models – not popPK;
population$speciesrecords the MRSA USA300 isolate. NCA / PKNCA is not appropriate (no drug PK profile to integrate); the mechanistic checks above replace it, per the endogenous / mechanistic validation strategy. - File naming. The task metadata listed the drug as “Antimicrobial Agents and Chemo”, which is the journal name (Antimicrobial Agents and Chemotherapy), not a drug. The paper unambiguously models nisin in combination with amikacin (six-population MBM) and nisin in combination with linezolid (three-population MBM with protein-pool dynamics), so the file and vignette names use those drug pairs.
-
Two files, one vignette. Per the standing
nlmixr2lib policy for multi-model papers (replicate the author’s
structure as N R files, one vignette per paper), the two combinations
are packaged as two
inst/modeldb/specificDrugs/files (Landersdorfer_2013_nisin_amikacin,Landersdorfer_2013_nisin_linezolid) sharing this vignette. -
S-ADAPT vs NONMEM. Both estimation methods are
reported in Table 1; the S-ADAPT estimates are used in both files (the
paper’s narrative discussion and abstract quote S-ADAPT values). The
nisin second-order killing constants
k2S,k2I,k2Rdiffer between the two models because the two analyses (nisin + amikacin and nisin + linezolid) were performed independently; they share the same drug but are not re-estimated against a combined dataset. - Between-curve variability omitted. The S-ADAPT analysis included biological between-curve variability fixed to CV = 15% (linear-scale parameters), CV = 10% (Hill coefficient), and variance = 0.25 (log10-scale parameters) per Table 1 footnotes b-c. These are fixed variability values used during the curve fit rather than estimated random-effects standard errors; the packaged models omit them and are intended for typical-value simulation only.
-
REP formulation. Eq 3 of the paper reports
REP = 2 * (1 - CFUall / (CFUmax + CFUall)) = 2 * CFUmax / (CFUmax + CFUall), a saturating (not linear) form. This is the form implemented inmodel(). AtCFUall = 0:REP = 2(full doubling); atCFUall = CFUmax:REP = 1(net stasis); the stationary plateau is therefore atCFUmax(contrast with the linear2 * (1 - CFUall / CFUmax)form that some related Bulitta-lab papers use and that plateaus at0.5 * CFUmax). -
Inh_k12 reading of Eq 5. Eq 5 of the paper writes
the linezolid-affected state-1 growth term as
k12 * Inh_k12 + k2 * Cnis, withInh_k12 = Imax_k12 * Clin^Hill / (Clin^Hill + IC50_k12^Hill)andImax_k12 = 0.858per Table 1. TakingInh_k12at face value as the inhibition magnitude (0 at baseline, 0.858 at saturation) and using it directly as a multiplier would give zero growth at baseline (Clin = 0), which is the opposite of the intended behaviour. By parallel with Eq 5’s(1 - Inh_Rep)factor on the replication term, the implementation usesk12 * (1 - Inh_k12)for the effective growth rate – equivalent to interpretingInh_k12either as written (with the implicit(1 - ...)complement) or as the residual fraction. Without the on-disk supplement, no value-changing alternative interpretation is available; the chosen reading is the physically consistent one. -
Sequential dosing implementation. The paper’s
experimental removal of nisin at ~1.75 h (centrifugation and
resuspension) is implemented in this vignette as a step-change in the
time-varying covariate
Cnisfrom the pretreatment concentration to 0 at the switch. The simultaneous combinations are constant covariates throughout. Both implementations match the experimental design exactly. -
Below limit of counting. Displayed counts are
floored at 1 CFU/mL (i.e. 0 log10) via
Cc = log10(CFUall + 1), matching the experimental limit of counting (paper Figs 5-6: zero colonies plotted as 0 log10 CFU/mL). -
Convention deviations
(
checkModelConventions()info-only, no errors or warnings). The bacterial-state compartments (bact_susceptible_susceptible1and the eleven other phenotype-crossed states) are matched by thebacterialSubpopRegexpattern; the antibiotic-concentration covariates (Cnis,Cami,Clin) are declared via thedependsfield (in-vitro experimental inputs, not human pop-PK covariates); theprot_poolcompartment (linezolid model only) is declared viapaper_specific_compartments; the single observationCccarries log10 viable count and the dosing/concentration units inunitsare bothmg/Lbecause the antibiotic input is a fixed broth concentration in the in-vitro static time-kill system.