Factor VIII thrombin and plasmin generation in hemophilia A (Bukkems 2022)
Source:vignettes/articles/Bukkems_2022_factorviii_thrombin_plasmin.Rmd
Bukkems_2022_factorviii_thrombin_plasmin.RmdModel and source
Bukkems 2022 developed a population pharmacokinetic-pharmacodynamic model for standard half-life factor VIII (FVIII) concentrates in hemophilia A. The analysis was sequential: a population PK model for FVIII activity was fitted first, and its individual PK parameters then drove three separately estimated sigmoid Emax models for the Nijmegen haemostasis assay readouts – normalized thrombin peak height, normalized thrombin potential and normalized plasmin peak height, each as a percentage of normal pooled plasma (NPP).
The paper therefore contributes four models to nlmixr2lib: the population PK model and one sequential PK-PD model per haemostatic endpoint. Each PD file embeds the same PK layer so that it can be simulated on its own.
- Article: https://doi.org/10.1111/bcp.15185 (open access, PMC9304184)
- Supplement: BCP-88-2757-s001 (Supplementary Methods Eqs. 1-11, Table S1, Figures S1-S5)
mods <- c(
  "Bukkems_2022_factorviii",
  "Bukkems_2022_factorviii_thrombinPeak",
  "Bukkems_2022_factorviii_thrombinPotential",
  "Bukkems_2022_factorviii_plasminPeak"
)
tibble::tibble(
  Model       = mods,
  Description = vapply(mods, function(m) readModelDb(m)()$description, character(1))
) |>
knitr::kable(caption = "The four models contributed by Bukkems 2022.")| Model | Description |
|---|---|
| Bukkems_2022_factorviii | Two-compartment population PK model for factor VIII (FVIII) activity (IU/dL) after an intravenous bolus of standard half-life FVIII concentrates (plasma-derived, full-length recombinant or B-domain-deleted recombinant) in 30 children and adults with severe, moderate or mild hemophilia A (Bukkems 2022). CL and V1 are allometrically scaled to a 75 kg reference (exponents 0.75 and 1); Q and V2 are not scaled. Typical values are CL 1.69 dL/h, V1 27.7 dL, Q 2.27 dL/h and V2 5.63 dL. Clearance falls with von Willebrand factor activity (power -0.52 at a 100% reference) and is 1.27x higher for full-length recombinant products and 1.49x higher in patients with a positive Nijmegen low-titre inhibitor assay; V1 is 1.17x and 1.14x higher for the same two factors. The patient’s lowest-ever measured FVIII activity is added to the prediction as an endogenous baseline. Chromogenic-assay (CSA) samples read 1.20x the one-stage-assay (OSA) value, with inter-individual variability (18.1%) on that correction factor. IIV on CL (41.2%) and V1 (15.6%) is correlated at 43.6%. Residual error is combined proportional plus additive, with assay-specific magnitudes. |
| Bukkems_2022_factorviii_thrombinPeak | Sequential PK-PD model relating factor VIII (FVIII) activity to normalized thrombin peak height (% of normal pooled plasma) measured with the Nijmegen haemostasis assay, after an intravenous bolus of standard half-life FVIII concentrates in 24 children and adults with severe, moderate or mild hemophilia A (Bukkems 2022). The PK layer is the two-compartment allometric model of Bukkems 2022 (see modellib(‘Bukkems_2022_factorviii’)); the PD layer is a proportional-baseline sigmoid Emax model, E = Ebase * (1 + Emax * C^n / (EC50^n + C^n)), driven by total one-stage FVIII activity (exogenous plus the patient’s endogenous baseline), with baseline 15.6% of normal pooled plasma, Emax 7.05 times baseline, EC50 50.1 IU/dL and Hill coefficient 1.85. IIV on EC50 (55.1%) and Emax (37.3%); additive residual error 11.2% of normal pooled plasma. |
| Bukkems_2022_factorviii_thrombinPotential | Sequential PK-PD model relating factor VIII (FVIII) activity to normalized thrombin potential (% of normal pooled plasma) measured with the Nijmegen haemostasis assay, after an intravenous bolus of standard half-life FVIII concentrates in 24 children and adults with severe, moderate or mild hemophilia A (Bukkems 2022). The PK layer is the two-compartment allometric model of Bukkems 2022 (see modellib(‘Bukkems_2022_factorviii’)); the PD layer is an additive-baseline sigmoid Emax model, E = Ebase + Emax * C^n / (EC50^n + C^n), driven by total one-stage FVIII activity (exogenous plus the patient’s endogenous baseline), with baseline 37.5% of normal pooled plasma, EC50 13.9 IU/dL and Hill coefficient 1.62. Emax is 72.5% of normal pooled plasma in a 75 kg patient with severe or moderate hemophilia, scales with (WT / 75)^-0.28, and is 0.709x in mild hemophilia A. IIV on baseline (41.8%), EC50 (88.0%) and Emax (22.9%); additive residual error 8.62% of normal pooled plasma. |
| Bukkems_2022_factorviii_plasminPeak | Sequential PK-PD model relating factor VIII (FVIII) activity to normalized plasmin peak height (% of normal pooled plasma) measured with the Nijmegen haemostasis assay, after an intravenous bolus of standard half-life FVIII concentrates in 24 children and adults with severe, moderate or mild hemophilia A (Bukkems 2022). The PK layer is the two-compartment allometric model of Bukkems 2022 (see modellib(‘Bukkems_2022_factorviii’)); the PD layer is an inhibitory Imax model, E = Ebase * (1 - Imax * C^n / (IC50^n + C^n)), driven by total one-stage FVIII activity (exogenous plus the patient’s endogenous baseline), with baseline 125% of normal pooled plasma, IC50 614 IU/dL and Imax and the Hill coefficient both held at 1. IIV on the baseline (32.1%); proportional residual error 26.8%. |
- Citation: Bukkems LH, Valke LLFG, Barteling W, Laros-van Gorkom BAP, Blijlevens NMA, Cnossen MH, van Heerde WL, Schols SEM, Mathot RAA. Combining factor VIII levels and thrombin/plasmin generation: a population pharmacokinetic-pharmacodynamic model for patients with haemophilia A. Br J Clin Pharmacol. 2022;88(6):2757-2768. doi:10.1111/bcp.15185. PMCID:PMC9304184.
Population
Thirty patients with hemophilia A (20 severe, 4 moderate, 6 mild) were studied at a single centre, Radboud University Medical Center, Nijmegen, The Netherlands, between February 2003 and July 2013 (Dutch Trial Registry NL2808). Median age was 40 years (range 2-77), with five children under 12 and none aged 12-18; median body weight was 75 kg (range 11-134). Median von Willebrand factor activity was 100% (range 28-216). Seven patients (23%) had a positive Nijmegen low-titre inhibitor assay (NLTIA) and four (13%) a positive Nijmegen Bethesda assay. Baseline demographics are in Bukkems 2022 Table 1.
The 44 PK profiles (1-4 per patient) followed a single intravenous bolus of a standard half-life concentrate, median 29.0 IU/kg (range 10.9-90.9): plasma-derived Aafact (8) and Haemate P / Humate P (3), full-length recombinant Advate (17), Helixate (8) and Kogenate (5), and B-domain-deleted recombinant NovoEight (2) and Refacto (1). FVIII activity was measured by both the one-stage clotting assay (OSA, 466 values) and the chromogenic substrate assay (CSA, 386 values). Haemostatic profiles (252 values per endpoint) were available for 24 of the 30 patients.
The same information is available programmatically via each model’s
population metadata, e.g.
readModelDb("Bukkems_2022_factorviii")()$population.
Source trace
The per-parameter origin is recorded as an in-file comment next to
each ini() entry in
inst/modeldb/specificDrugs/Bukkems_2022_factorviii*.R. The
table below collects them in one place for review. “Table 2 footer” is
the block of final-model equations printed beneath Table 2.
| Equation / parameter | Value | Source location |
|---|---|---|
lcl (CL) |
1.69 dL/h at 75 kg | Table 2 (RSE 11.1%) |
lvc (V1) |
27.7 dL at 75 kg | Table 2 (RSE 5.8%) |
lq (Q) |
2.27 dL/h | Table 2 (RSE 44.5%) |
lvp (V2) |
5.63 dL | Table 2 (RSE 19.2%) |
e_wt_cl, e_wt_vc
|
0.75, 1 (fixed); reference 75 kg; Q and V2 unscaled | Table 2 footer; Supplementary Methods Eq. 3 |
e_vwf_cl |
-0.52, reference 100% | Table 2 and footer |
e_form_fviii_recomb_fulllength_cl /
_vc
|
1.27 / 1.17 | Table 2 and footer |
e_ada_pos_cl / _vc
|
1.49 / 1.14 | Table 2 and footer |
e_assay_osa_cc, etae_assay_osa_cc
|
1.20, IIV 18.1% | Table 2; footer “CSA activity = OSA activity * 1.20” |
e_assay_osa_propsd |
0.9375 = 10.5% / 11.2% | Table 2, proportional error CSA / OSA |
e_assay_osa_addsd |
1.0313 = 4.28 / 4.15 IU/dL | Table 2, additive error CSA / OSA |
etalcl, etalvc, correlation |
41.2%, 15.6%, 43.6% | Table 2 |
propSd, addSd (OSA) |
11.2%, 4.15 IU/dL | Table 2 |
| Endogenous baseline in the observation | (C_pred + baseline FVIII) * (1 + eps_prop) + eps_add |
Supplementary Methods Eq. 2; Results 3.1 |
Exponential IIV, omega^2 = log(CV^2 + 1)
|
n/a | Supplementary Methods Eq. 1; Table 2 abbreviations |
| PD driver C includes the endogenous baseline | n/a | Results 3.3, Equation 1 |
Thrombin peak height:
E = Ebase * (1 + Emax * C^n / (EC50^n + C^n))
|
n/a | Table 2 footer |
Thrombin peak height: le0, lemax,
lec50, lhill
|
15.6% NPP, 7.05 x baseline, 50.1 IU/dL, 1.85 | Table 2 |
Thrombin peak height: etalec50, etalemax,
addSd_thrombinPeak
|
55.1%, 37.3%, 11.2% NPP | Table 2 |
Thrombin potential:
E = Ebase + Emax * C^n / (EC50^n + C^n)
|
n/a | Table 2 footer |
Thrombin potential: le0, lemax,
lec50, lhill
|
37.5% NPP, 72.5% NPP, 13.9 IU/dL, 1.62 | Table 2 |
Thrombin potential: e_wt_emax,
e_dis_hemophilia_a_mild_emax
|
-0.28 (reference 75 kg), 0.709 | Table 2 and footer |
Thrombin potential: etale0, etalec50,
etalemax, addSd_thrombinPotential
|
41.8%, 88.0%, 22.9%, 8.62% NPP | Table 2 |
Plasmin peak height:
E = Ebase * (1 - Imax * C^n / (IC50^n + C^n))
|
n/a | Table 2 footer |
Plasmin peak height: le0, limax,
lec50, lhill
|
125% NPP, 1 FIX, 614 IU/dL, 1 FIX | Table 2 (continued) |
Plasmin peak height: etale0,
propSd_plasminPeak
|
32.1%, 26.8% | Table 2 (continued) |
| Observed FVIII activity and NHA time courses | medians (IQR) | Supplementary Table S1 |
Virtual cohort
Original observed data are not publicly available. The simulations below use a 200-subject virtual population whose covariate distribution approximates Bukkems 2022 Table 1, each given the cohort’s median dose of 29 IU/kg.
set.seed(20220615)
rxode2::rxSetSeed(20220615)

n_sub    <- 200L
obs_grid <- sort(unique(c(
  0, 0.05, 0.0833, 0.25, 0.5, 0.75, seq(1, 48, by = 1),
  c(0.25, 0.5, 1, 3, 6, 9, 24)  # the times tabulated in Supplementary Table S1
)))

# Five of 30 patients were children under 12 years; the rest adults.
is_child <- runif(n_sub) < 5 / 30
wt <- ifelse(
  is_child,
  runif(n_sub, 11, 40),
  pmin(pmax(exp(rnorm(n_sub, log(80), 0.2)), 45), 134)
)

severity <- sample(
  c("severe", "moderate", "mild"), n_sub, replace = TRUE,
  prob = c(20, 4, 6) / 30
)

subj <- tibble::tibble(
  id       = seq_len(n_sub),
  WT       = wt,
  severity = severity,
  # Lowest-ever FVIII activity (IU/mL) within each severity band (Methods 2.1).
  FVIII_BL = dplyr::case_when(
    severity == "severe"   ~ runif(n_sub, 0, 0.01),
    severity == "moderate" ~ runif(n_sub, 0.01, 0.05),
    TRUE                   ~ runif(n_sub, 0.05, 0.40)
  ),
  DIS_HEMOPHILIA_A_MILD = as.integer(severity == "mild"),
  VWF      = pmin(pmax(exp(rnorm(n_sub, log(100), 0.35)), 28), 216),
  # 30 of 44 PK profiles used a full-length recombinant product (Table 1).
  FORM_FVIII_RECOMB_FULLLENGTH = rbinom(n_sub, 1, 30 / 44),
  # 7 of 30 patients were NLTIA-positive (Table 1).
  ADA_POS  = rbinom(n_sub, 1, 7 / 30),
  # The observed values in Supplementary Table S1 and the PD driver are on
  # the one-stage-assay scale.
  ASSAY_OSA = 1,
  treatment = "29 IU/kg IV bolus"
)

doses <- subj |>
  mutate(time = 0, amt = 29 * WT, evid = 1L, cmt = "central", dvid = NA_integer_)

# Observations are placed on the `central` ODE state, never on an algebraic
# observable name. The three PD models declare two endpoints (Cc plus the
# haemostatic readout), so observation rows also carry a `dvid`; rxode2
# returns every algebraic observable as its own output column regardless.
obs <- subj |>
  tidyr::crossing(time = obs_grid) |>
  mutate(amt = NA_real_, evid = 0L, cmt = "central", dvid = 1L)

events <- bind_rows(doses, obs) |>
  arrange(id, time, desc(evid)) |>
  as.data.frame()

stopifnot(!anyDuplicated(unique(events[, c("id", "time", "evid")])))
Simulation
cov_cols <- c(
  "WT", "VWF", "FORM_FVIII_RECOMB_FULLLENGTH", "ADA_POS", "ASSAY_OSA",
  "FVIII_BL", "DIS_HEMOPHILIA_A_MILD", "severity", "treatment"
)

solve_one <- function(model_name, ev = events, typical = FALSE) {
  mod <- readModelDb(model_name)
  if (typical) mod <- rxode2::zeroRe(mod)
  out <- rxode2::rxSolve(
    mod, events = ev,
    keep = intersect(cov_cols, names(ev)),
    useLinCmt = FALSE
  ) |>
    as.data.frame()
  # rxSolve omits the id column for a single-subject solve.
  n_out <- if ("id" %in% names(out)) dplyr::n_distinct(out$id) else 1L
  stopifnot(n_out == dplyr::n_distinct(ev$id))
  out
}

sim_pk   <- solve_one("Bukkems_2022_factorviii")
#> ℹ parameter labels from comments will be replaced by 'label()'
sim_tpk  <- solve_one("Bukkems_2022_factorviii_thrombinPeak")
#> ℹ parameter labels from comments will be replaced by 'label()'
sim_tpot <- solve_one("Bukkems_2022_factorviii_thrombinPotential")
#> ℹ parameter labels from comments will be replaced by 'label()'
sim_ppk  <- solve_one("Bukkems_2022_factorviii_plasminPeak")
#> ℹ parameter labels from comments will be replaced by 'label()'

# The IV bolus must produce a non-zero concentration at time 0.
stopifnot(median(sim_pk$Cc[sim_pk$time == 0]) > 0)Replicate published figures
Typical-patient FVIII activity versus Supplementary Table S1
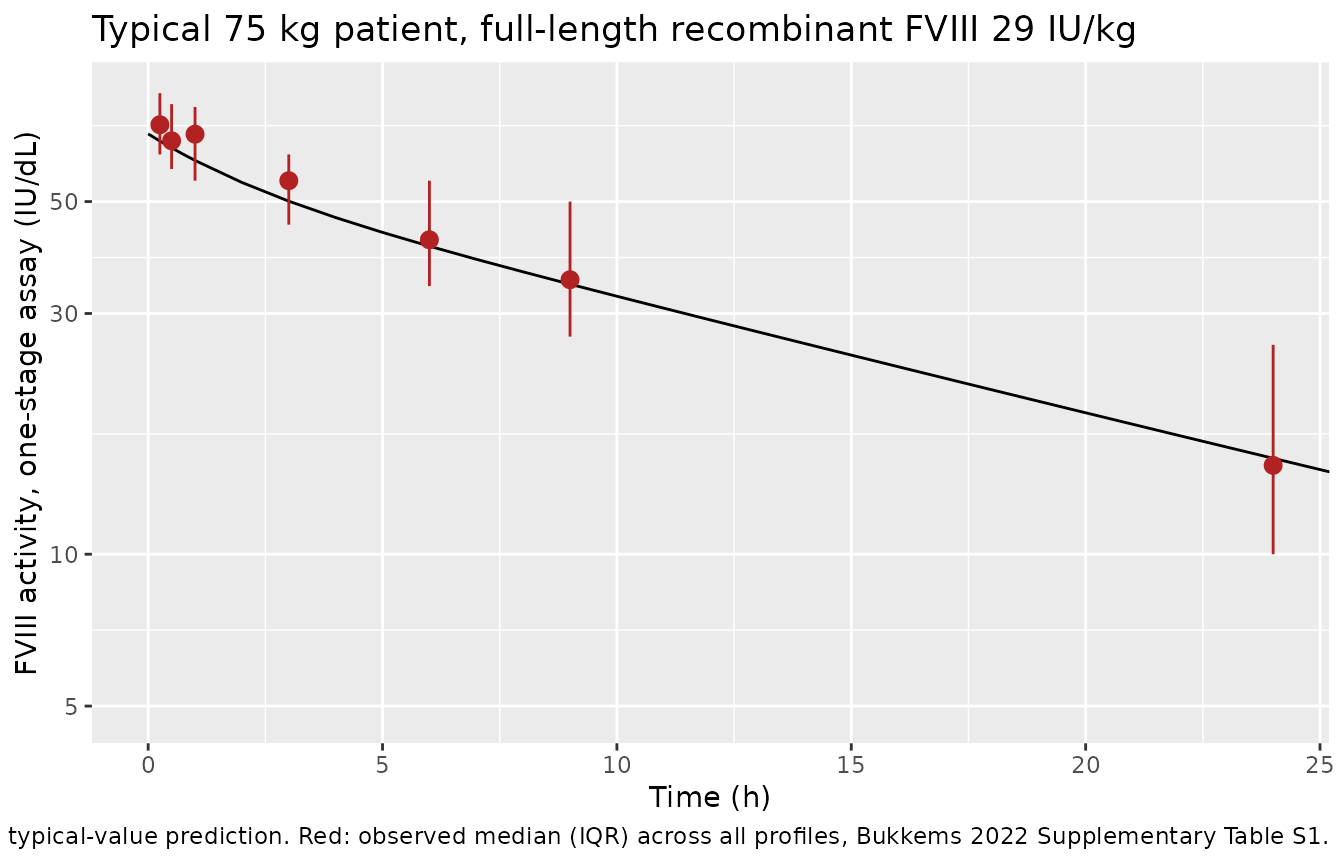
Supplementary Table S1 gives the observed median FVIII activity (OSA) at each sampling time across all profiles. The most common profile in the cohort is a 75 kg patient given a full-length recombinant product at the median dose of 29 IU/kg, with VWF activity 100% and no inhibitor; its typical-value curve is compared with the observed medians below.
s1_fviii <- tibble::tribble(
  ~time, ~Q25, ~Q50, ~Q75,
  0.25,  62,   71,   82,
  0.50,  58,   66,   78,
  1.00,  55,   68,   77,
  3.00,  45,   55,   62,
  6.00,  34,   42,   55,
  9.00,  27,   35,   50,
  24.00, 10,   15,   26
)

typ_events <- function(form) {
  base <- data.frame(
    WT = 75, VWF = 100, FORM_FVIII_RECOMB_FULLLENGTH = form, ADA_POS = 0,
    ASSAY_OSA = 1, FVIII_BL = 0.01, DIS_HEMOPHILIA_A_MILD = 0
  )
  bind_rows(
    data.frame(id = 1L, time = 0, amt = 29 * 75, evid = 1L, cmt = "central", dvid = NA_integer_),
    data.frame(id = 1L, time = obs_grid, amt = NA_real_, evid = 0L, cmt = "central", dvid = 1L)
  ) |>
    cbind(base)
}

typ_fl <- solve_one("Bukkems_2022_factorviii", typ_events(1), typical = TRUE)
#> ℹ parameter labels from comments will be replaced by 'label()'
#> Warning: No sigma parameters in the model
#> ℹ omega/sigma items treated as zero: 'etalcl', 'etalvc', 'etae_assay_osa_cc'

ggplot(typ_fl, aes(time, Cc)) +
  geom_line() +
  geom_pointrange(
    data = s1_fviii, aes(y = Q50, ymin = Q25, ymax = Q75),
    colour = "firebrick"
  ) +
  scale_y_log10() +
  coord_cartesian(xlim = c(0, 24)) +
  labs(
    x = "Time (h)", y = "FVIII activity, one-stage assay (IU/dL)",
    title = "Typical 75 kg patient, full-length recombinant FVIII 29 IU/kg",
    caption = paste(
      "Black: typical-value prediction. Red: observed median (IQR) across all",
      "profiles, Bukkems 2022 Supplementary Table S1."
    )
  )
typ_chk <- typ_fl |>
  filter(time %in% s1_fviii$time) |>
  select(time, Cc) |>
  inner_join(s1_fviii, by = "time") |>
  mutate(pct_diff = 100 * (Cc - Q50) / Q50)

typ_chk |>
  dplyr::rename(
    "Time (h)" = time, "Typical prediction (IU/dL)" = Cc,
    "Observed median (IU/dL)" = Q50, "Difference (%)" = pct_diff
  ) |>
  select(-Q25, -Q75) |>
knitr::kable(digits = 1, caption = "Typical-value prediction versus Supplementary Table S1 medians.")| Time (h) | Typical prediction (IU/dL) | Observed median (IU/dL) | Difference (%) |
|---|---|---|---|
| 0.2 | 65.9 | 71 | -7.2 |
| 0.5 | 63.9 | 66 | -3.2 |
| 1.0 | 60.3 | 68 | -11.3 |
| 3.0 | 50.1 | 55 | -8.9 |
| 6.0 | 40.8 | 42 | -2.9 |
| 9.0 | 34.3 | 35 | -2.0 |
| 24.0 | 15.5 | 15 | 3.3 |
Figure 2 – concentration-effect relationships
Figure 2 shows each haemostatic readout against FVIII activity. The EC50 values differ by more than an order of magnitude: thrombin potential (13.9 IU/dL) responds at much lower FVIII activity than thrombin peak height (50.1 IU/dL), while plasmin peak height barely changes over achievable FVIII levels (IC50 614 IU/dL).
ce <- tibble::tibble(fviii = seq(0, 150, length.out = 301)) |>
  mutate(
    `Normalized thrombin peak height` = 15.6 * (1 + 7.05 * fviii^1.85 / (50.1^1.85 + fviii^1.85)),
    `Normalized thrombin potential`   = 37.5 + 72.5 * fviii^1.62 / (13.9^1.62 + fviii^1.62),
    `Normalized plasmin peak height`  = 125 * (1 - fviii / (614 + fviii))
  ) |>
  tidyr::pivot_longer(-fviii, names_to = "endpoint", values_to = "effect")

ggplot(ce, aes(fviii, effect, colour = endpoint)) +
  geom_line(linewidth = 0.9) +
  labs(
    x = "FVIII activity, including endogenous baseline (IU/dL)",
    y = "Percentage of normal pooled plasma", colour = NULL,
    title = "Typical-value concentration-effect curves (Bukkems 2022 Table 2)",
    caption = "Thrombin potential at 75 kg, severe or moderate hemophilia. Replicates Figure 2 of Bukkems 2022."
  ) +
  theme(legend.position = "bottom")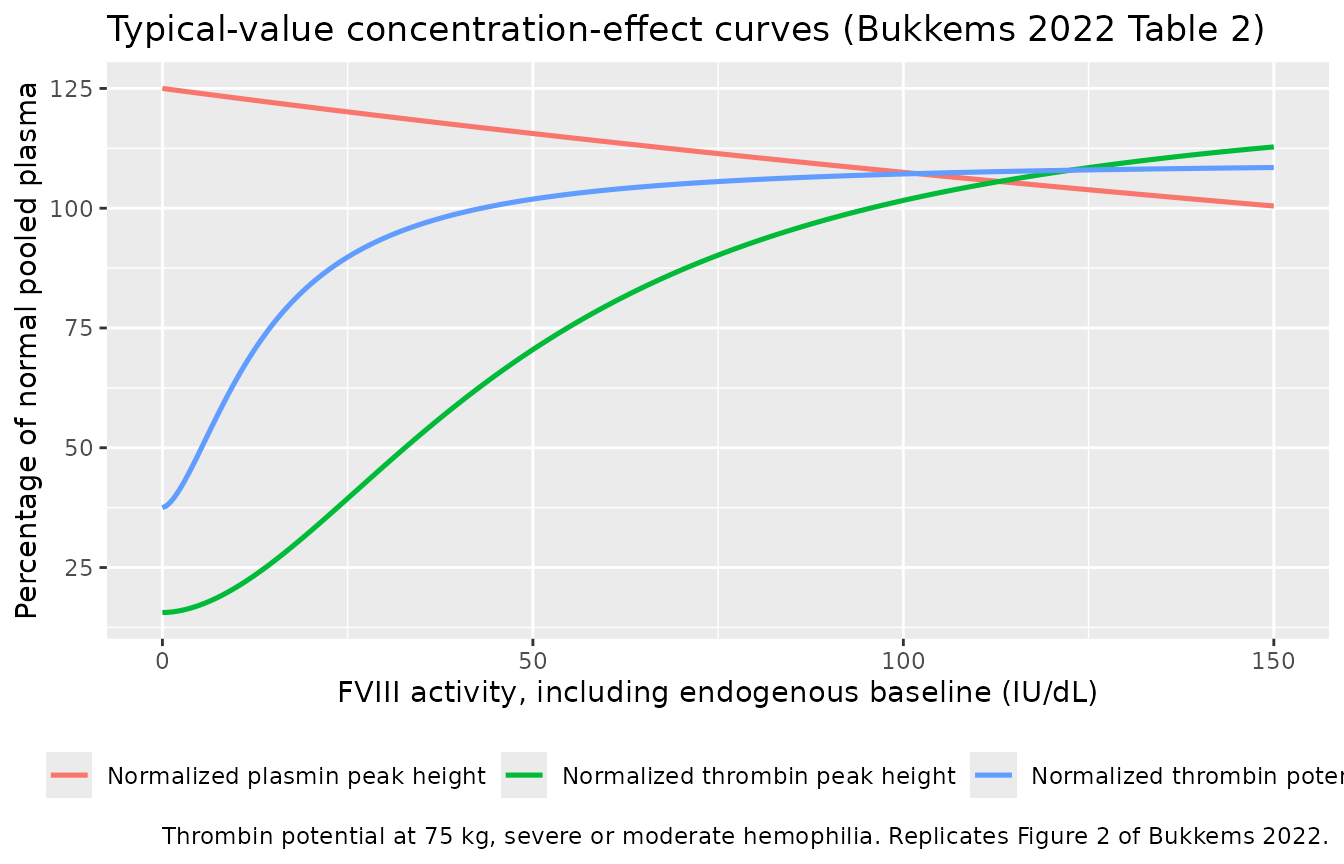
The encoded models reproduce these closed-form curves: at a common FVIII activity the model output equals the Table 2 equation.
# Closed-form check of each encoded PD model against its own Table 2
# equation, using every simulated subject's individual parameters and PD
# driver (the one-stage FVIII activity including the endogenous baseline).
# Both sides use the same drawn parameters, so the difference is numerical
# error only and a tight bound is correct.
cf_err <- c(
  peak = with(sim_tpk, max(abs(e0 * (1 + emax * fviii_pd^hill / (ec50^hill + fviii_pd^hill)) - thrombinPeak))),
  pot  = with(sim_tpot, max(abs(e0 + emax * fviii_pd^hill / (ec50^hill + fviii_pd^hill) - thrombinPotential))),
  pls  = with(sim_ppk, max(abs(e0 * (1 - imax * fviii_pd^hill / (ec50^hill + fviii_pd^hill)) - plasminPeak)))
)
stopifnot(all(cf_err < 1e-6))
Figure 3 – FVIII activity and thrombin potential over time
Figure 3 contrasts patients with similar PK but different thrombin potential responses. The typical 75 kg patient with severe hemophilia is shown with the IIV-driven spread of the simulated cohort around it.
typ_tpot <- solve_one("Bukkems_2022_factorviii_thrombinPotential", typ_events(1), typical = TRUE)
#> ℹ parameter labels from comments will be replaced by 'label()'
#> ℹ omega/sigma items treated as zero: 'etalcl', 'etalvc', 'etae_assay_osa_cc', 'etale0', 'etalec50', 'etalemax'

fig3 <- bind_rows(
  qtile(sim_pk, "Cc") |> mutate(panel = "A: FVIII activity (IU/dL)"),
  qtile(sim_tpot, "thrombinPotential") |> mutate(panel = "B: Normalized thrombin potential (% NPP)")
)
fig3_typ <- bind_rows(
  typ_fl |> transmute(time, value = Cc, panel = "A: FVIII activity (IU/dL)"),
  typ_tpot |> transmute(time, value = thrombinPotential, panel = "B: Normalized thrombin potential (% NPP)")
)

ggplot(fig3, aes(time)) +
  geom_ribbon(aes(ymin = lo, ymax = hi), alpha = 0.2) +
  geom_line(aes(y = med)) +
  geom_line(data = fig3_typ, aes(y = value), colour = "steelblue", linewidth = 0.9) +
  facet_wrap(~panel, ncol = 1, scales = "free_y") +
  labs(
    x = "Time (h)", y = NULL,
    title = "FVIII activity and normalized thrombin potential after 29 IU/kg",
    caption = paste(
      "Grey: simulated median and 95% interval (n = 200). Blue: typical 75 kg",
      "patient, full-length recombinant product. Replicates Figure 3 of Bukkems 2022."
    )
  )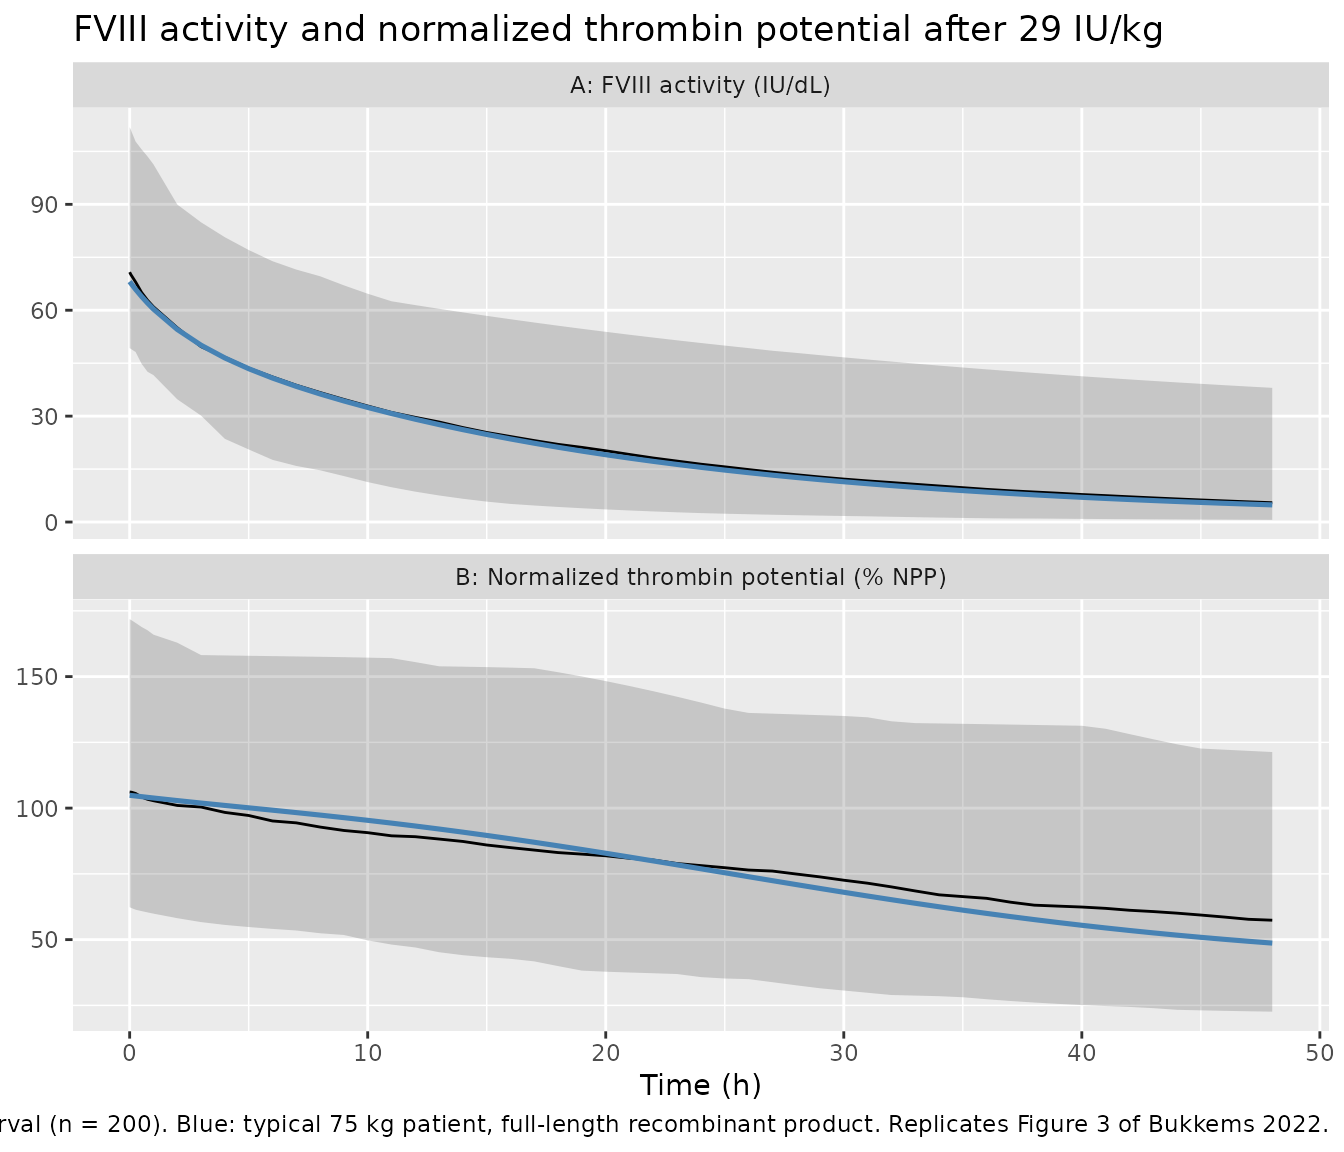
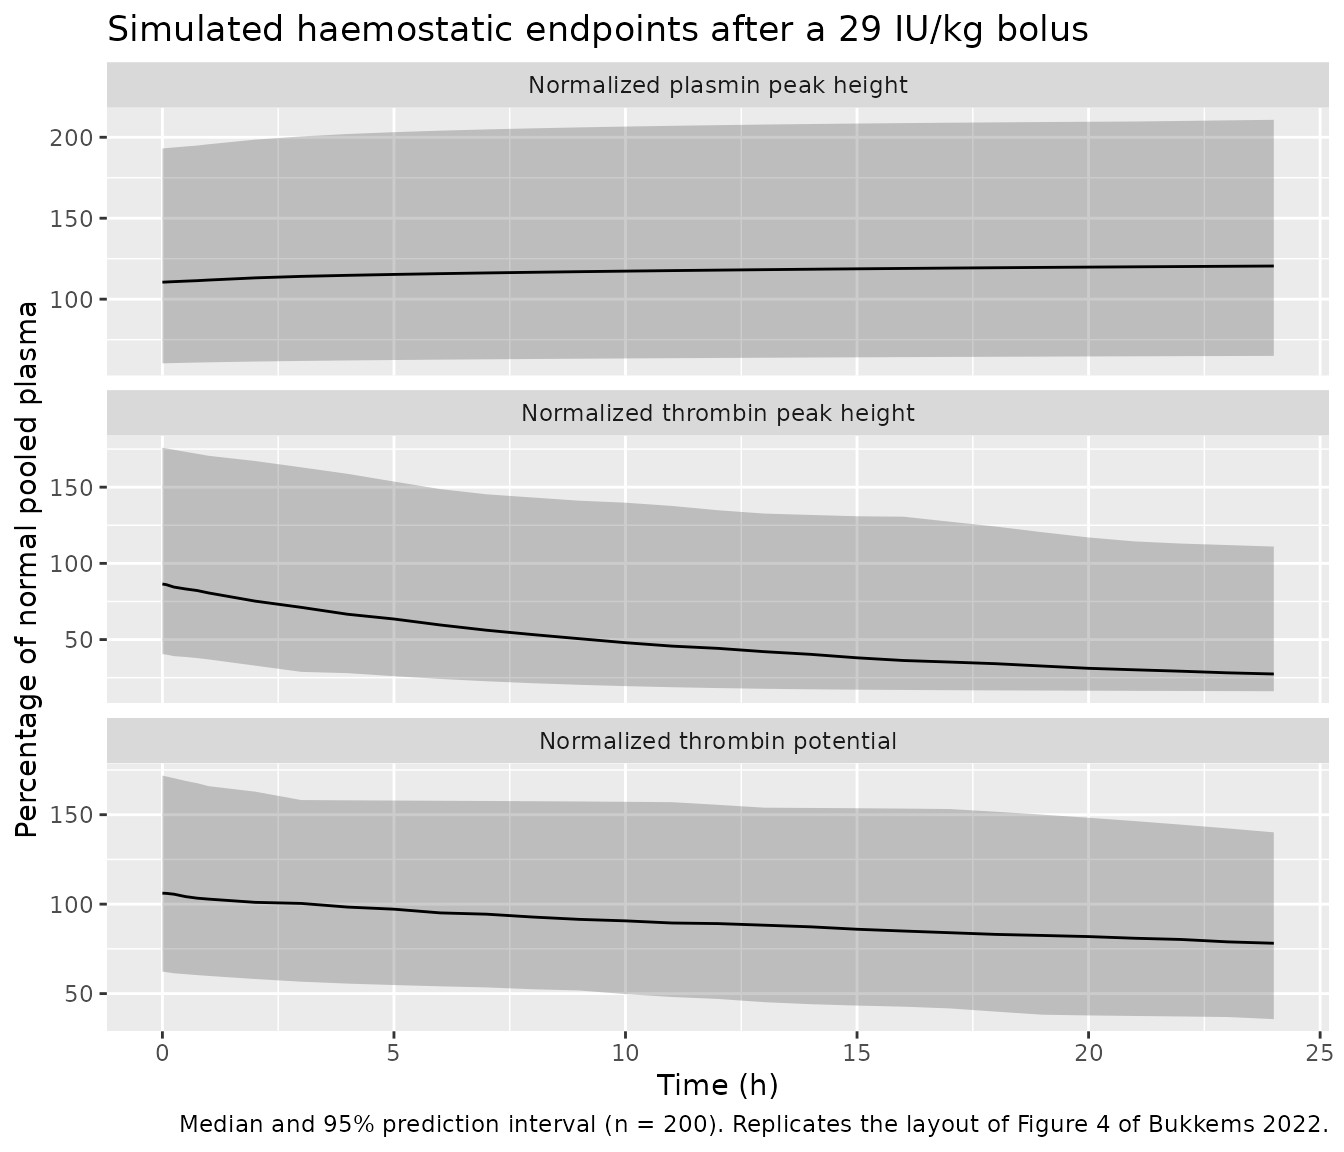
Figure 4 – visual predictive check of the three haemostatic endpoints
fig4 <- bind_rows(
  qtile(sim_tpk,  "thrombinPeak")      |> mutate(endpoint = "Normalized thrombin peak height"),
  qtile(sim_tpot, "thrombinPotential") |> mutate(endpoint = "Normalized thrombin potential"),
  qtile(sim_ppk,  "plasminPeak")       |> mutate(endpoint = "Normalized plasmin peak height")
)

ggplot(fig4 |> filter(time <= 24), aes(time, med)) +
  geom_ribbon(aes(ymin = lo, ymax = hi), alpha = 0.25) +
  geom_line() +
  facet_wrap(~endpoint, ncol = 1, scales = "free_y") +
  labs(
    x = "Time (h)", y = "Percentage of normal pooled plasma",
    title = "Simulated haemostatic endpoints after a 29 IU/kg bolus",
    caption = "Median and 95% prediction interval (n = 200). Replicates the layout of Figure 4 of Bukkems 2022."
  )
Thrombin potential at 24 h
The normalized thrombin potential stays elevated as FVIII activity falls. Valke 2024 (Eur J Drug Metab Pharmacokinet 49:191-205, Discussion) reports for this same Nijmegen cohort a normalized thrombin potential of 75% of normal (IQR 59-87) 24 h after dosing, with FVIII activity 15 IU/dL (IQR 10-26), the same FVIII summary as Bukkems 2022 Supplementary Table S1.
tpot_at_15 <- 37.5 + 72.5 * 15^1.62 / (13.9^1.62 + 15^1.62)
typ_24 <- typ_tpot |> filter(time == 24)

tibble::tibble(
  Quantity = c(
    "Closed-form thrombin potential at FVIII 15 IU/dL (75 kg, severe)",
    "Typical-patient model prediction at 24 h",
    "Observed median at 24 h (IQR 59-87)"
  ),
  `% of NPP` = c(tpot_at_15, typ_24$thrombinPotential, 75)
) |>
knitr::kable(digits = 1)| Quantity | % of NPP |
|---|---|
| Closed-form thrombin potential at FVIII 15 IU/dL (75 kg, severe) | 76.0 |
| Typical-patient model prediction at 24 h | 76.9 |
| Observed median at 24 h (IQR 59-87) | 75.0 |
Supplementary Figures S2 and S4 – covariate effects
typ_par <- function(WT = 75, VWF = 100, form = 0, nltia = 0) {
  tibble::tibble(
    CL = 1.69 * (WT / 75)^0.75 * (VWF / 100)^-0.52 * 1.27^form * 1.49^nltia,
    V1 = 27.7 * (WT / 75) * 1.17^form * 1.14^nltia
  )
}

bind_rows(
  typ_par() |> mutate(Scenario = "Reference: 75 kg, VWF 100%, plasma-derived, NLTIA negative"),
  typ_par(VWF = 28)  |> mutate(Scenario = "VWF 28% (cohort minimum)"),
  typ_par(VWF = 216) |> mutate(Scenario = "VWF 216% (cohort maximum)"),
  typ_par(form = 1)  |> mutate(Scenario = "Full-length recombinant product"),
  typ_par(nltia = 1) |> mutate(Scenario = "NLTIA positive"),
  typ_par(WT = 20)   |> mutate(Scenario = "Body weight 20 kg")
) |>
  relocate(Scenario) |>
  dplyr::rename("CL (dL/h)" = CL, "V1 (dL)" = V1) |>
knitr::kable(digits = 2, caption = "Typical PK parameters across the covariate ranges of Supplementary Figure S2.")| Scenario | CL (dL/h) | V1 (dL) |
|---|---|---|
| Reference: 75 kg, VWF 100%, plasma-derived, NLTIA negative | 1.69 | 27.70 |
| VWF 28% (cohort minimum) | 3.28 | 27.70 |
| VWF 216% (cohort maximum) | 1.13 | 27.70 |
| Full-length recombinant product | 2.15 | 32.41 |
| NLTIA positive | 2.52 | 31.58 |
| Body weight 20 kg | 0.63 | 7.39 |
tibble::tibble(WT = c(20, 50, 75, 100, 134)) |>
  mutate(
    `Emax, severe (% NPP)`           = 72.5 * (WT / 75)^-0.28,
    `Emax, mild (% NPP)`             = 72.5 * (WT / 75)^-0.28 * 0.709,
    `Ebase + Emax, severe (% NPP)`   = 37.5 + 72.5 * (WT / 75)^-0.28
  ) |>
  dplyr::rename("Body weight (kg)" = WT) |>
knitr::kable(digits = 1, caption = "Thrombin potential Emax across body weight (Supplementary Figure S4).")| Body weight (kg) | Emax, severe (% NPP) | Emax, mild (% NPP) | Ebase + Emax, severe (% NPP) |
|---|---|---|---|
| 20 | 105.0 | 74.4 | 142.5 |
| 50 | 81.2 | 57.6 | 118.7 |
| 75 | 72.5 | 51.4 | 110.0 |
| 100 | 66.9 | 47.4 | 104.4 |
| 134 | 61.6 | 43.7 | 99.1 |
PKNCA validation
The NCA is run on the exogenous (drug-derived) FVIII activity,
Cc minus the patient’s endogenous baseline, which is the
quantity the model was fitted to after baseline subtraction. Including
the baseline would flatten the terminal phase of every moderate and mild
patient and inflate the half-life.
sim_nca <- sim_pk |>
  dplyr::filter(!is.na(Cc)) |>
  dplyr::mutate(
    Cc      = Cc - 100 * FVIII_BL,
    product = ifelse(FORM_FVIII_RECOMB_FULLLENGTH == 1, "Full-length recombinant", "Plasma-derived or BDD")
  ) |>
  dplyr::select(id, time, Cc, product)

# Guarantee a time = 0 row per subject. This is an IV bolus, so the time-zero
# value is the post-bolus concentration produced by the solver; any row
# already present at time 0 wins via .keep_all on the first occurrence.
sim_nca <- dplyr::bind_rows(
  sim_nca,
  sim_nca |>
    dplyr::group_by(id, product) |>
    dplyr::slice_min(time, n = 1, with_ties = FALSE) |>
    dplyr::ungroup() |>
    dplyr::mutate(time = 0)
) |>
  dplyr::distinct(id, product, time, .keep_all = TRUE) |>
  dplyr::arrange(id, product, time)

conc_obj <- PKNCA::PKNCAconc(sim_nca, Cc ~ time | product + id)

dose_df <- events |>
  dplyr::filter(evid == 1L) |>
  dplyr::mutate(product = ifelse(FORM_FVIII_RECOMB_FULLLENGTH == 1, "Full-length recombinant", "Plasma-derived or BDD")) |>
  dplyr::select(id, time, amt, product)

dose_obj <- PKNCA::PKNCAdose(dose_df, amt ~ time | product + id)

intervals <- data.frame(
  start      = 0,
  end        = Inf,
  cmax       = TRUE,
  tmax       = TRUE,
  aucinf.obs = TRUE,
  half.life  = TRUE
)

nca_res <- PKNCA::pk.nca(PKNCA::PKNCAdata(conc_obj, dose_obj, intervals = intervals))

as.data.frame(summary(nca_res)) |>
knitr::kable(caption = "Simulated NCA by product group (PKNCA), 29 IU/kg IV bolus.")| start | end | product | N | cmax | tmax | half.life | aucinf.obs |
|---|---|---|---|---|---|---|---|
| 0 | Inf | Full-length recombinant | 133 | 63.4 [15.5] | 0.000 [0.000, 0.000] | 12.7 [5.49] | 857 [52.1] |
| 0 | Inf | Plasma-derived or BDD | 67 | 76.3 [15.3] | 0.000 [0.000, 0.000] | 14.6 [5.67] | 1150 [45.9] |
Comparison against published NCA
Bukkems 2022 reports no non-compartmental parameters (no Cmax, AUC or half-life summary), so there is no published NCA to compare against. The typical-value comparison with the Supplementary Table S1 medians above is the quantitative check of the PK layer. As a closed-form cross-check, the typical 75 kg plasma-derived parameters (CL 1.69 dL/h, V1 27.7 dL, Q 2.27 dL/h, V2 5.63 dL) give a terminal half-life of about 14 h, near which the simulated median half-life of the plasma-derived / B-domain-deleted group should sit.
k10  <- 1.69 / 27.7
k12  <- 2.27 / 27.7
k21  <- 2.27 / 5.63
beta <- ((k10 + k12 + k21) - sqrt((k10 + k12 + k21)^2 - 4 * k10 * k21)) / 2
thalf_typ <- log(2) / beta
thalf_sim <- as.data.frame(nca_res$result) |>
  dplyr::filter(PPTESTCD == "half.life", product == "Plasma-derived or BDD") |>
  dplyr::pull(PPORRES)
c(typical = thalf_typ, simulated_median = median(thalf_sim, na.rm = TRUE))
#>          typical simulated_median
#>         13.99358         14.00309
# Centre-of-distribution check only: the group still carries body-weight, VWF
# and inhibitor variability, so the median is compared within a generous band.
stopifnot(abs(median(thalf_sim, na.rm = TRUE) / thalf_typ - 1) < 0.25)
Assumptions and deviations
-
Final equations followed over the Supplementary Methods for
allometric scaling. Supplementary Methods Eq. 3 describes a
priori allometric scaling of all PK parameters at 70 kg. The final-model
equations printed beneath Table 2 instead scale CL and V1 at 75 kg and
leave Q and V2 unscaled (
Q = theta_Q,V2 = theta_V2), and Supplementary Figure S2 describes a 75 kg typical patient. The printed final equations are encoded. -
Table 2 is used over the narrative text for the PD
estimates. The Abstract and Results quote EC50 values of 11.6,
56.6 and 593 IU/dL and IIV of 86.9% (EC50) and 15.8% (Emax) for thrombin
potential; Table 2 gives 13.9, 50.1 and 614 IU/dL and 88.0% and 22.9%.
The Valke 2024 replication study reproduces the Table 2 values as the
Bukkems 2022 estimates, so Table 2 is taken as final. The narrative
statement that a 20 kg patient reaches 127% and a 100 kg patient 84% of
NPP for the maximal thrombin potential does not follow from Table 2
either (
37.5 + 72.5 * (WT / 75)^-0.28gives 142% and 104%; Emax alone gives 105% and 67%), and is likewise treated as stale. -
IIV is converted with
omega^2 = log(CV^2 + 1). Table 2 states that CV was calculated assqrt(exp(omega^2) - 1) * 100, so this is the inverse. The CL-V1 correlation of 43.6% is applied to the converted variances. - Sign of the VWF and body-weight exponents. The minus signs are lost in the PDF text layer. The values -0.52 (VWF on CL) and -0.28 (body weight on thrombin potential Emax) are confirmed by their bootstrap intervals (-0.79 to -0.20 and -0.42 to -0.11), by the Results (“Higher VWF:Act levels were associated with a lower FVIII clearance”; lower body weight gives a higher Emax) and by Valke 2024 Table 3.
-
Assay correction and the endogenous baseline. The
1.20 CSA correction factor (with its 18.1% IIV) is applied to the
predicted exogenous FVIII, and the endogenous baseline is then added.
The paper subtracted the lowest-ever measured FVIII activity from the
observations and states the residual model as
(C_pred + baseline) * (1 + eps_prop) + eps_add, but does not print where the correction factor enters; correcting the exogenous part is the reading consistent with a baseline-subtracted fit. The difference is negligible for severe patients and small for moderate ones. -
The CSA residual magnitudes are encoded as ratios.
As in the Valke 2024 models, the CSA proportional and additive residual
SDs are reached through multipliers of the OSA values
(
0.9375 = 10.5% / 11.2%,1.0313 = 4.28 / 4.15 IU/dL), so all four Table 2 values are recoverable. Valke 2024 Table 2 lists the Bukkems CSA additive error as 2.69 IU/dL (RSE 49.8%); the primary source’s 4.28 IU/dL (RSE 9.7%) is used. -
PD driver on the one-stage scale. Equation 1
defines C as the FVIII activity including the endogenous baseline, and
the Discussion states that the OSA PK parameters are related to the PD
parameters, so every PD model is driven by
central / vc + 100 * FVIII_BLregardless ofASSAY_OSA. -
Mild-hemophilia reference group. The Table 2 row
reads “Mild haemophilia on Emax (% of severe)”, but the equation
contrasts mild against not-mild, so moderate patients share the severe
reference (
DIS_HEMOPHILIA_A_MILD = 0). - Missing-covariate parameters are not encoded. The paper estimated separate parameters for patients with missing VWF or NLTIA (Supplementary Methods Eq. 6) but does not report their values. VWF and the NLTIA status must be supplied for every simulated patient.
-
Inhibitor status mapped to
ADA_POS. The NLTIA detects neutralising FVIII alloantibodies; following the Valke 2024 models it is carried on the canonical anti-drug-antibody column. - Virtual-cohort assumptions. The paper reports medians and ranges only. Adult weights were drawn log-normally around 80 kg (truncated to 45-134 kg) and children’s weights uniformly over 11-40 kg; VWF was drawn log-normally around 100% and truncated to the observed 28-216%; the lowest-ever FVIII activity was drawn uniformly within each severity band. Product type, NLTIA positivity and severity were drawn at the Table 1 frequencies. Every virtual patient received the median dose of 29 IU/kg. Sex and race were not reported and are not simulated.