Infliximab TDMx model panel (Kim 2025)
Source:vignettes/articles/Kim_2025_infliximab.Rmd
Kim_2025_infliximab.Rmd
library(nlmixr2lib)
library(rxode2)
#> rxode2 5.1.8 using 2 threads (see ?getRxThreads)
#>   no cache: create with `rxCreateCache()`
library(dplyr)
#>
#> Attaching package: 'dplyr'
#> The following objects are masked from 'package:stats':
#>
#>     filter, lag
#> The following objects are masked from 'package:base':
#>
#>     intersect, setdiff, setequal, union
library(tidyr)
library(ggplot2)
library(PKNCA)
#>
#> Attaching package: 'PKNCA'
#> The following object is masked from 'package:stats':
#>
#>     filter
Model and source
- Citation: Kim Y, Baek SH, Jang IJ, Chung JY. Model-Informed Precision Dosing of Infliximab in Korean Inflammatory Bowel Disease Patients: External Validation of Population Pharmacokinetic Models. CPT Pharmacometrics Syst Pharmacol. 2025;14:1682-1694.
- Article: doi:10.1002/psp4.70089
Kim 2025 is an external-validation paper, not a model-development paper. It evaluates the infliximab population PK models implemented in TDMx, a free online model-informed precision dosing (MIPD) dashboard, against a retrospective cohort of 199 Korean inflammatory bowel disease (IBD) patients treated at Seoul National University Hospital between 2019 and 2023 (142 adults with 294 concentrations, 57 children with 158 concentrations).
The paper itself develops no new model. What makes it extractable is
its supplement: Data S1 (Supplementary Material 1) contains
the complete NONMEM control stream for every model
evaluated, each run with MAXEVAL=0 so that all
$THETA, $OMEGA and $SIGMA entries
are held at the originally published values. Kim 2025 Table S2
independently tabulates the same typical values and inter-individual
variability, giving a second, agreeing transcription of each model.
Every parameter in the model files extracted here is traced to that
control stream and cross-checked against Table S2.
Because the models are transcriptions of other authors’ work, each
extracted file is named for the transcribing paper
(Kim_2025_infliximab_<model>) and credits the
original developers in its reference field. This follows
the precedent already in the library:
modellib("Frymoyer_2017_infliximab") is likewise a
second-hand transcription, taken from Frymoyer 2017’s reproduction of
the Fasanmade model. When the primary publications are extracted
directly, these files should be re-checked against them.
Which models are in this release
Kim 2025 evaluated three adult and seven paediatric models. Eight of the ten control streams are extracted here – every adult model, and five of the seven paediatric ones. Two are deferred pending naming decisions that require new canonical entries (see Assumptions and deviations).
| Kim 2025 stream | Original model | Extracted as | Status |
|---|---|---|---|
| #1 Aubourg (adult) | Aubourg 2015 | Kim_2025_infliximab_aubourg |
included |
| #2 Passot (adult) | Passot 2016 | Kim_2025_infliximab_passot_adult |
included |
| #3 Ternant (adult) | Ternant 2008 | Kim_2025_infliximab_ternant |
included |
| #4 Bauman (paediatric) | Bauman 2020 | – | deferred |
| #5 Dubinsky (paediatric) | Dubinsky 2017 | Kim_2025_infliximab_dubinsky |
included |
| #6 Fasanmade combined | Fasanmade 2011 | Kim_2025_infliximab_fasanmade_combined |
included |
| #7 Fasanmade paediatric | Fasanmade 2011 | Kim_2025_infliximab_fasanmade_pediatric |
included |
| #8 Passot (paediatric) | Passot 2016 | Kim_2025_infliximab_passot_pediatric |
included |
| #9 Petitcollin (paediatric) | Petitcollin 2018 | – | deferred |
| #10 Wojciechowski | Wojciechowski 2017 | Kim_2025_infliximab_wojciechowski |
included |
Kim 2025 additionally lists the Dreesen and Xiong models as implemented in TDMx but excluded them from its own analysis, because the validation dataset lacked faecal calprotectin, Crohn’s Disease Activity Index and neutrophil CD64 activity ratio. No control stream is provided for either, so neither is extractable here.
Headline findings of the paper
- All ten models showed a consistent positive bias (over-prediction): the 95% CI of the mean percentage error excluded zero for every model, and every MPE exceeded the +/-20% clinical-acceptability threshold.
- Among adult models the Passot model performed best (MPE 26.4%, MAE 1.1 mg/L, rRMSE 159.0%) and was the only adult model whose normalised prediction distribution errors were acceptable. It is the model the authors recommend for MIPD in Korean adults.
- No paediatric model was clinically acceptable, even after supplying one or two previous trough concentrations (MPE 30.4%-143.4%, MAE 1.4-2.6 mg/L, rRMSE 96.3%-564.0%).
- Assuming every patient to be ATI-positive improved predictive performance, which the authors attribute to the models’ inherent positive bias.
Population
The development population of each extracted model, as summarised by Kim 2025 Table S1:
pop_tab <- tibble::tribble(
  ~Model,                 ~`IBD type (n)`,   ~Population,        ~`ATI+ (%)`, ~`Age (y)`, ~`Female (%)`, ~`Weight (kg)`, ~`ALB (g/dL)`,
  "Aubourg",              "CD (133)",        "Adults",           "0",         "NS",       "59",          "60",           "NS",
  "Passot (both)",        "CD (63), UC (16)", "Paediatric+adult", "0",        "NS",       "NS",          "NS",           "NS",
  "Ternant",              "CD (30), UC (3)", "Adults",           "15",        "33",       "55",          "67",           "NS",
  "Dubinsky",             "CD (41), UC (9)", "Paediatric",       "28",        "13",       "44",          "41",           "3.9",
  "Fasanmade combined",   "CD (692)",        "Paediatric+adult", "10",        "33",       "56",          "65",           "4.1",
  "Fasanmade paediatric", "CD (112)",        "Paediatric",       "3",         "13",       "41",          "42",           "3.8",
  "Wojciechowski",        "CD (112), UC (543)", "Paediatric+adult", "NS",     "NS",       "NS",          "70",           "4.0"
)
knitr::kable(pop_tab, caption = "Development populations (Kim 2025 Table S1). NS = not specified. Medians, except Dubinsky (means).")| Model | IBD type (n) | Population | ATI+ (%) | Age (y) | Female (%) | Weight (kg) | ALB (g/dL) |
|---|---|---|---|---|---|---|---|
| Aubourg | CD (133) | Adults | 0 | NS | 59 | 60 | NS |
| Passot (both) | CD (63), UC (16) | Paediatric+adult | 0 | NS | NS | NS | NS |
| Ternant | CD (30), UC (3) | Adults | 15 | 33 | 55 | 67 | NS |
| Dubinsky | CD (41), UC (9) | Paediatric | 28 | 13 | 44 | 41 | 3.9 |
| Fasanmade combined | CD (692) | Paediatric+adult | 10 | 33 | 56 | 65 | 4.1 |
| Fasanmade paediatric | CD (112) | Paediatric | 3 | 13 | 41 | 42 | 3.8 |
| Wojciechowski | CD (112), UC (543) | Paediatric+adult | NS | NS | NS | 70 | 4.0 |
The Kim 2025 validation cohort (Table 1) was 142 adults (age 31.9 +/- 11.4 y, weight 66.7 +/- 14.9 kg, 24.6% female, albumin 4.4 +/- 0.5 g/dL) and 57 children (age 14.2 +/- 2.8 y, weight 58.7 +/- 16.3 kg, 26.3% female, albumin 4.1 +/- 0.5 g/dL), all East Asian, 80.3% / 87.7% Crohn’s disease. Observed trough concentrations had a median of 3.3 mg/L in both groups (range 0.1-24.8 mg/L in adults, 0.1-46.8 mg/L in children). That cohort was used only to assess predictive performance – it did not update any parameter.
Source trace
Every value in every extracted model file comes from the
Data S1 control stream, cross-checked against Table S2.
| Item | Source location |
|---|---|
Structural $THETA (CL, Vc, Vp, Q) |
Data S1 Supplementary Material 1, per-model $THETA
block; Table S2 “Parameter values” columns |
| Covariate exponents / coefficients | Same $THETA block, per-model comments naming each
coefficient |
| Covariate functional forms | Per-model $PK block |
| ODE structure | Per-model $MODEL and $DES blocks |
| Residual error form | Per-model $ERROR block
(Y = IPRED*(1+ERR(1)) or + ERR(2)) |
| Residual error magnitudes | Per-model $SIGMA block; the SDs are given in the
stream’s own comments |
| IIV variances | Per-model $OMEGA block; %CV cross-checked against Table
S2 |
| IIV scale convention | Aubourg stream annotation:
$OMEGA ; Interindividual standard deviation OMEGA = (%CV/100)**2
|
| Development populations | Table S1 |
| Model performance (MPE / MAE / rRMSE) | Table 2 |
The IIV scale deserves a note, because it is the usual ambiguity in a
transcription of this kind. Kim 2025’s streams use
OMEGA = CV^2 rather than the exact log-normal
omega^2 = log(1 + CV^2). This is verifiable independently
in every model: for example Dubinsky’s $OMEGA values 0.098
/ 0.010 / 0.579 / 1.232 are exactly 0.313^2 /
0.0985^2 / 0.761^2 / 1.11^2, and
Table S2 reports those same figures as 31.3% / 9.85% / 76.1% / 111%. The
variances are carried through unchanged.
Load the models
model_names <- c(
  "Kim_2025_infliximab_aubourg",
  "Kim_2025_infliximab_passot_adult",
  "Kim_2025_infliximab_ternant",
  "Kim_2025_infliximab_passot_pediatric",
  "Kim_2025_infliximab_dubinsky",
  "Kim_2025_infliximab_wojciechowski",
  "Kim_2025_infliximab_fasanmade_combined",
  "Kim_2025_infliximab_fasanmade_pediatric"
)

# readModelDb() returns the model FUNCTION; rxode2::rxode() resolves it to a ui.
models <- lapply(model_names, function(nm) rxode2::rxode(readModelDb(nm)))
#> ℹ parameter labels from comments will be replaced by 'label()'
#> ℹ parameter labels from comments will be replaced by 'label()'
#> ℹ parameter labels from comments will be replaced by 'label()'
#> Warning: some etas defaulted to non-mu referenced, possible parsing error: etalcl_ada_neg, etalcl_ada_pos, etalvc_female, etalvc_male
#> as a work-around try putting the mu-referenced expression on a simple line
#> ℹ parameter labels from comments will be replaced by 'label()'
#> ℹ parameter labels from comments will be replaced by 'label()'
#> ℹ parameter labels from comments will be replaced by 'label()'
#> ℹ parameter labels from comments will be replaced by 'label()'
#> Warning: some etas defaulted to non-mu referenced, possible parsing error: etaiov_cl_1
#> as a work-around try putting the mu-referenced expression on a simple line
#> ℹ parameter labels from comments will be replaced by 'label()'
#> Warning: some etas defaulted to non-mu referenced, possible parsing error: etaiov_cl_1
#> as a work-around try putting the mu-referenced expression on a simple line
names(models) <- model_names

tibble::tibble(
  Model = sub("^Kim_2025_infliximab_", "", model_names),
  Compartments = vapply(models, function(ui) length(ui$state), integer(1)),
  Covariates = vapply(models, function(ui) paste(sort(ui$allCovs), collapse = ", "), character(1))
) |>
knitr::kable(caption = "Structure of the extracted models.")| Model | Compartments | Covariates |
|---|---|---|
| aubourg | 2 | SEXF, WT |
| passot_adult | 1 | IBD_CD, SEXF, WT |
| ternant | 2 | ADA_POS, SEXF, WT |
| passot_pediatric | 1 | AGE, IBD_CD, SEXF, WT |
| dubinsky | 2 | ADA_POS, ALB, WT |
| wojciechowski | 2 | ADA_POS, ALB, WT |
| fasanmade_combined | 2 | ADA_POS, ALB, CONMED_IMMUNOMOD, WT |
| fasanmade_pediatric | 2 | ALB, WT |
Virtual cohort and simulation helpers
Two reference subjects are used throughout: a 65 kg adult and a 40 kg child, both male, Crohn’s disease, ADA-negative, no concomitant immunomodulator, serum albumin 40 g/L (= 4.0 g/dL). These match the central tendency of the Kim 2025 validation cohort (Table 1) closely enough to make the models comparable to one another.
ref_cov <- list(
  adult = list(WT = 65, SEXF = 0, IBD_CD = 1, AGE = 32, ALB = 40,
               ADA_POS = 0, CONMED_IMMUNOMOD = 0),
  child = list(WT = 40, SEXF = 0, IBD_CD = 1, AGE = 13, ALB = 40,
               ADA_POS = 0, CONMED_IMMUNOMOD = 0)
)

# Dense early sampling so that the distribution phase is resolved; PKNCA needs a
# time-zero record, which seq(0, ...) supplies.
obs_times <- unique(c(
  seq(0, 0.5, by = 1 / 24),
  seq(0.75, 7, by = 0.25),
  seq(7.5, 56, by = 0.5)
))

# Attach only the covariates a given model actually declares, so rxode2 does not
# warn about unused columns.
attach_covariates <- function(dat, ui, cov) {
  for (nm in intersect(names(cov), ui$allCovs)) {
    dat[[nm]] <- cov[[nm]]
  }
  dat
}

# Single 5 mg/kg IV infusion over 2 h (0.0833 day), observed on the ODE state.
single_dose_events <- function(ui, cov) {
  ev <- rxode2::et(amt = 5 * cov$WT, dur = 0.0833, cmt = "central")
  ev <- rxode2::et(ev, obs_times, cmt = "central")
  attach_covariates(as.data.frame(ev), ui, cov)
}

solve_typical <- function(ui, dat) {
  out <- rxode2::rxSolve(rxode2::zeroRe(ui), dat, returnType = "data.frame")
  if (is.null(out$id)) out$id <- 1L
  out
}
Typical-value profiles across the model panel
typical <- bind_rows(lapply(model_names, function(nm) {
  bind_rows(lapply(names(ref_cov), function(grp) {
    ui <- models[[nm]]
    dat <- single_dose_events(ui, ref_cov[[grp]])
    solve_typical(ui, dat) |>
      filter(!is.na(Cc)) |>
      transmute(model = sub("^Kim_2025_infliximab_", "", nm),
                cohort = grp, time, Cc, cl, vc)
  }))
}))
#> ℹ omega/sigma items treated as zero: 'etalcl', 'etalvc'
#> ℹ omega/sigma items treated as zero: 'etalcl', 'etalvc'
#> ℹ omega/sigma items treated as zero: 'etalcl', 'etalvc'
#> ℹ omega/sigma items treated as zero: 'etalcl', 'etalvc'
#> Warning: some etas defaulted to non-mu referenced, possible parsing error: etalcl_ada_neg, etalcl_ada_pos, etalvc_female, etalvc_male
#> as a work-around try putting the mu-referenced expression on a simple line
#> ℹ omega/sigma items treated as zero: 'etalcl_ada_neg', 'etalcl_ada_pos', 'etalvc_female', 'etalvc_male', 'etalvc_wt', 'etalvp', 'etalq'
#> Warning: some etas defaulted to non-mu referenced, possible parsing error: etalcl_ada_neg, etalcl_ada_pos, etalvc_female, etalvc_male
#> as a work-around try putting the mu-referenced expression on a simple line
#> ℹ omega/sigma items treated as zero: 'etalcl_ada_neg', 'etalcl_ada_pos', 'etalvc_female', 'etalvc_male', 'etalvc_wt', 'etalvp', 'etalq'
#> ℹ omega/sigma items treated as zero: 'etalcl', 'etalvc'
#> ℹ omega/sigma items treated as zero: 'etalcl', 'etalvc'
#> ℹ omega/sigma items treated as zero: 'etalcl', 'etalvc', 'etalvp', 'etalq'
#> ℹ omega/sigma items treated as zero: 'etalcl', 'etalvc', 'etalvp', 'etalq'
#> ℹ omega/sigma items treated as zero: 'etalcl', 'etalvc', 'etalvp', 'etalq'
#> ℹ omega/sigma items treated as zero: 'etalcl', 'etalvc', 'etalvp', 'etalq'
#> Warning: some etas defaulted to non-mu referenced, possible parsing error: etaiov_cl_1
#> as a work-around try putting the mu-referenced expression on a simple line
#> ℹ omega/sigma items treated as zero: 'etalcl', 'etalvc', 'etalvp', 'etaiov_cl_1'
#> Warning: some etas defaulted to non-mu referenced, possible parsing error: etaiov_cl_1
#> as a work-around try putting the mu-referenced expression on a simple line
#> ℹ omega/sigma items treated as zero: 'etalcl', 'etalvc', 'etalvp', 'etaiov_cl_1'
#> Warning: some etas defaulted to non-mu referenced, possible parsing error: etaiov_cl_1
#> as a work-around try putting the mu-referenced expression on a simple line
#> ℹ omega/sigma items treated as zero: 'etalcl', 'etalvc', 'etalvp', 'etaiov_cl_1'
#> Warning: some etas defaulted to non-mu referenced, possible parsing error: etaiov_cl_1
#> as a work-around try putting the mu-referenced expression on a simple line
#> ℹ omega/sigma items treated as zero: 'etalcl', 'etalvc', 'etalvp', 'etaiov_cl_1'

ggplot(typical, aes(time, Cc, colour = model)) +
  geom_line(linewidth = 0.6) +
  facet_wrap(~cohort, labeller = labeller(
    cohort = c(adult = "Adult, 65 kg, 325 mg", child = "Child, 40 kg, 200 mg"))) +
  scale_y_log10() +
  labs(x = "Time (days)", y = "Infliximab concentration (mg/L)",
       colour = "Model",
       title = "Typical-value profiles after a single 5 mg/kg IV infusion") +
  theme_bw() +
  theme(legend.position = "bottom")
#> Warning in scale_y_log10(): log-10 transformation introduced infinite values.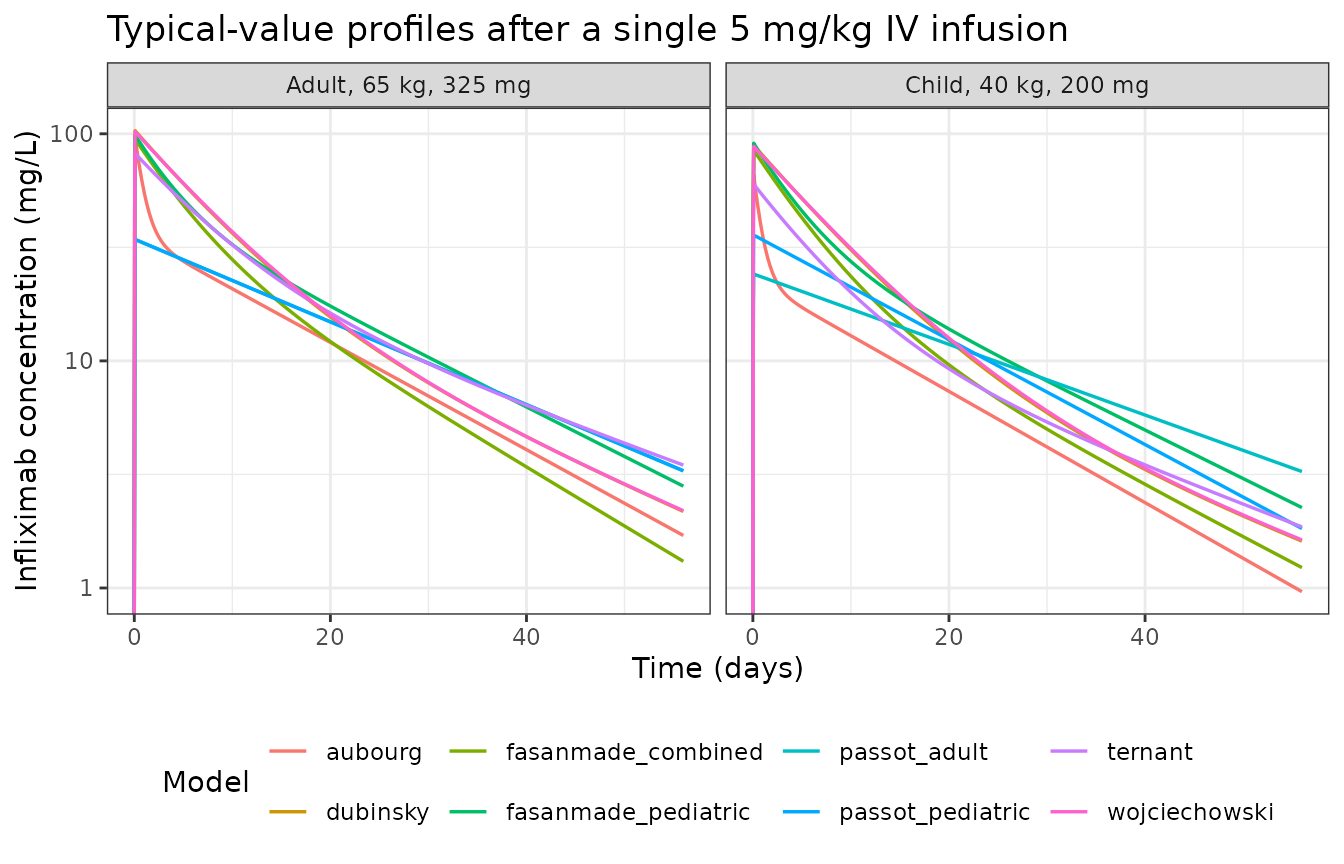
The panel spread is itself the paper’s point: these models were all fitted to infliximab in IBD, yet at an identical dose in an identical subject their typical profiles differ severalfold in the terminal phase. That is the variability an MIPD dashboard inherits when it offers a choice of prior.
Structural validation: AUC(0-inf) = Dose / CL
For any linear model, the exact identity
AUC(0-inf) = Dose / CL holds. This is the strictest
available check on each transcription, because it ties the simulated
exposure to the published clearance and to the covariate model that
scales it. It is asserted per model and per cohort.
conc_dat <- typical |>
  transmute(model, cohort,
            treatment = paste(model, cohort, sep = " / "),
            id = 1L, time, Cc, cl)

dose_dat <- conc_dat |>
  group_by(model, cohort, treatment, id) |>
  summarise(time = 0, .groups = "drop") |>
  left_join(
    tibble::tibble(cohort = c("adult", "child"),
                   dose = c(5 * ref_cov$adult$WT, 5 * ref_cov$child$WT)),
    by = "cohort"
  )

# PKNCAdose() rejects a nested (slash) grouping formula; use the same
# `| treatment + id` grouping on BOTH objects.
o_conc <- PKNCA::PKNCAconc(conc_dat |> filter(!is.na(Cc)), Cc ~ time | treatment + id)
o_dose <- PKNCA::PKNCAdose(dose_dat, dose ~ time | treatment + id)

o_data <- PKNCA::PKNCAdata(
  o_conc, o_dose,
  intervals = data.frame(
    start = 0, end = 56,
    cmax = TRUE, tmax = TRUE, auclast = TRUE, aucinf.obs = TRUE, half.life = TRUE
  )
)
res <- PKNCA::pk.nca(o_data)
nca <- as.data.frame(res)
expected <- conc_dat |>
  group_by(model, cohort, treatment) |>
  summarise(cl = first(cl), .groups = "drop") |>
  left_join(tibble::tibble(cohort = c("adult", "child"),
                           dose = c(5 * ref_cov$adult$WT, 5 * ref_cov$child$WT)),
            by = "cohort") |>
  mutate(auc_expected = dose / cl)

identity_tab <- nca |>
  filter(PPTESTCD == "aucinf.obs") |>
  select(treatment, aucinf_sim = PPORRES) |>
  left_join(expected, by = "treatment") |>
  mutate(ratio = aucinf_sim / auc_expected,
         pct_diff = 100 * (ratio - 1))

identity_tab |>
  transmute(Model = model, Cohort = cohort,
            `CL (L/day)` = round(cl, 4),
            `Dose/CL (mg/L*day)` = round(auc_expected, 1),
            `Simulated AUCinf` = round(aucinf_sim, 1),
            `Difference (%)` = round(pct_diff, 2)) |>
knitr::kable(caption = "AUC(0-inf) identity check against Dose/CL.")| Model | Cohort | CL (L/day) | Dose/CL (mg/L*day) | Simulated AUCinf | Difference (%) |
|---|---|---|---|---|---|
| aubourg | adult | 0.4560 | 712.7 | 712.7 | 0.00 |
| aubourg | child | 0.4560 | 438.6 | 438.6 | 0.01 |
| dubinsky | adult | 0.2829 | 1148.9 | 1146.2 | -0.23 |
| dubinsky | child | 0.2102 | 951.7 | 947.7 | -0.41 |
| fasanmade_combined | adult | 0.3598 | 903.2 | 902.9 | -0.04 |
| fasanmade_combined | child | 0.2578 | 775.9 | 775.4 | -0.07 |
| fasanmade_pediatric | adult | 0.2858 | 1137.2 | 1136.6 | -0.05 |
| fasanmade_pediatric | child | 0.2074 | 964.1 | 963.6 | -0.06 |
| passot_adult | adult | 0.3973 | 817.9 | 817.9 | 0.00 |
| passot_adult | child | 0.2965 | 674.5 | 674.5 | 0.00 |
| passot_pediatric | adult | 0.3973 | 817.9 | 817.9 | 0.00 |
| passot_pediatric | child | 0.2965 | 674.5 | 674.5 | 0.00 |
| ternant | adult | 0.2880 | 1128.5 | 1124.6 | -0.34 |
| ternant | child | 0.2880 | 694.4 | 692.9 | -0.23 |
| wojciechowski | adult | 0.2809 | 1156.9 | 1153.6 | -0.29 |
| wojciechowski | child | 0.2085 | 959.2 | 954.6 | -0.48 |
# Strict assertion: NCA-derived AUCinf must reproduce Dose/CL to within 1%.
stopifnot(nrow(identity_tab) == length(model_names) * length(ref_cov))
stopifnot(all(abs(identity_tab$pct_diff) < 1))
Every model reproduces Dose / CL to well within 1%,
confirming that the clearance value, the covariate model scaling it, the
compartment structure and the dose-to-concentration unit chain are all
internally consistent.
Comparison against the published parameter values
The paper reports no NCA summary (Cmax / AUC / half-life) for any model, so the published quantities available for comparison are the typical parameter values in Table S2. The check below recomputes each model’s clearance at its own reference covariates – where every covariate multiplier collapses to one, or to the value the source stream dictates – and compares the simulated exposure with the exposure implied by the Table S2 clearance.
# Table S2 typical CL, and the covariate values at which that CL applies.
published_cl <- tibble::tribble(
  ~model,                 ~cl_published, ~WT, ~ALB_gdL,
  "aubourg",              0.456,         60,  NA,     # male typical CL; Vc reference weight 60 kg
  "passot_adult",         0.23,          67,  NA,     # before the disease/sex multipliers
  "ternant",              0.288,         67,  NA,     # ADA-negative typical CL; Vc reference weight 67 kg
  "passot_pediatric",     0.23,          67,  NA,
  "dubinsky",             0.296,         70,  4.0,
  "wojciechowski",        0.294,         70,  4.0,
  "fasanmade_combined",   0.3523,        65,  4.1,    # 5.42 mL/kg/day x 65 kg / 1000
  "fasanmade_pediatric",  0.22806,       42,  3.8     # 5.43 mL/kg/day x 42 kg / 1000
)

ref_cl <- bind_rows(lapply(seq_len(nrow(published_cl)), function(i) {
  row <- published_cl[i, ]
  nm <- paste0("Kim_2025_infliximab_", row$model)
  ui <- models[[nm]]
  cov <- list(
    WT = row$WT, SEXF = 0, IBD_CD = 1, AGE = 32,
    ALB = if (is.na(row$ALB_gdL)) 40 else row$ALB_gdL * 10,
    ADA_POS = 0, CONMED_IMMUNOMOD = 0
  )
  dat <- single_dose_events(ui, cov)
  out <- solve_typical(ui, dat)
  tibble::tibble(model = row$model,
                 cl_model = out$cl[1],
                 cl_published = row$cl_published)
}))
#> ℹ omega/sigma items treated as zero: 'etalcl', 'etalvc'
#> ℹ omega/sigma items treated as zero: 'etalcl', 'etalvc'
#> Warning: some etas defaulted to non-mu referenced, possible parsing error: etalcl_ada_neg, etalcl_ada_pos, etalvc_female, etalvc_male
#> as a work-around try putting the mu-referenced expression on a simple line
#> ℹ omega/sigma items treated as zero: 'etalcl_ada_neg', 'etalcl_ada_pos', 'etalvc_female', 'etalvc_male', 'etalvc_wt', 'etalvp', 'etalq'
#> ℹ omega/sigma items treated as zero: 'etalcl', 'etalvc'
#> ℹ omega/sigma items treated as zero: 'etalcl', 'etalvc', 'etalvp', 'etalq'
#> ℹ omega/sigma items treated as zero: 'etalcl', 'etalvc', 'etalvp', 'etalq'
#> Warning: some etas defaulted to non-mu referenced, possible parsing error: etaiov_cl_1
#> as a work-around try putting the mu-referenced expression on a simple line
#> ℹ omega/sigma items treated as zero: 'etalcl', 'etalvc', 'etalvp', 'etaiov_cl_1'
#> Warning: some etas defaulted to non-mu referenced, possible parsing error: etaiov_cl_1
#> as a work-around try putting the mu-referenced expression on a simple line
#> ℹ omega/sigma items treated as zero: 'etalcl', 'etalvc', 'etalvp', 'etaiov_cl_1'

ref_cl |>
  mutate(`Ratio` = round(cl_model / cl_published, 4),
         `Difference (%)` = round(100 * (cl_model / cl_published - 1), 2)) |>
  transmute(Model = model,
            `Published CL (L/day)` = cl_published,
            `Model CL at reference (L/day)` = round(cl_model, 5),
            Ratio, `Difference (%)`) |>
knitr::kable(caption = "Clearance at each model's own reference covariates vs Kim 2025 Table S2.")| Model | Published CL (L/day) | Model CL at reference (L/day) | Ratio | Difference (%) |
|---|---|---|---|---|
| aubourg | 0.45600 | 0.45600 | 1.0000 | 0.00 |
| passot_adult | 0.23000 | 0.40467 | 1.7594 | 75.94 |
| ternant | 0.28800 | 0.28800 | 1.0000 | 0.00 |
| passot_pediatric | 0.23000 | 0.40467 | 1.7594 | 75.94 |
| dubinsky | 0.29600 | 0.29600 | 1.0000 | 0.00 |
| wojciechowski | 0.29400 | 0.29400 | 1.0000 | 0.00 |
| fasanmade_combined | 0.35230 | 0.35230 | 1.0000 | 0.00 |
| fasanmade_pediatric | 0.22806 | 0.22806 | 1.0000 | 0.00 |
Aubourg, Ternant, Dubinsky, Wojciechowski, and both Fasanmade
parameterizations reproduce the published clearance exactly at their
reference covariates. (Ternant’s row is its ADA-negative stratum; the
ADA-positive stratum is a separate typical value of 0.768 L/day,
exercised by the panel simulations above only if ADA_POS is
set to 1.) The two Passot rows differ by construction and are the
informative case: Passot’s model was fitted across several chronic
inflammatory diseases, so neither IBD subtype is a unit
multiplier. A Crohn’s disease patient carries
exp(0.384) = 1.468 and an ulcerative colitis patient
exp(0.472) = 1.603 on top of the tabulated 0.23 L/day. The
0.23 in Table S2 is therefore a base value that no actual IBD patient
ever has, which is exactly the kind of detail a summary table loses and
a control stream preserves.
# The paper publishes no NCA parameters, so the reference AUC below is derived
# from the Table S2 clearance (AUCinf = Dose/CL), evaluated at the reference
# covariates used in the identity check above.
simulated_nca <- nca |>
  filter(PPTESTCD %in% c("cmax", "aucinf.obs", "half.life")) |>
  left_join(conc_dat |> distinct(treatment, model, cohort), by = "treatment") |>
  filter(cohort == "adult") |>
  select(model, PPTESTCD, PPORRES) |>
  pivot_wider(names_from = PPTESTCD, values_from = PPORRES)

reference_nca <- expected |>
  filter(cohort == "adult") |>
  transmute(model, aucinf.obs = auc_expected)

cmp <- nlmixr2lib::ncaComparisonTable(
  simulated = simulated_nca,
  reference = reference_nca,
  by = "model",
  params = "aucinf.obs",
  tolerance_pct = 20,
  label_first_column = "NCA parameter"
)
knitr::kable(cmp, caption = "Simulated AUC(0-inf) vs the exposure implied by the published clearance (adult, 325 mg).")| NCA parameter | model | Reference | Simulated | % diff |
|---|---|---|---|---|
| AUC0-∞ (obs) | aubourg | 713 | 713 | +0.0% |
| AUC0-∞ (obs) | dubinsky | 1150 | 1150 | -0.2% |
| AUC0-∞ (obs) | fasanmade_combined | 903 | 903 | -0.0% |
| AUC0-∞ (obs) | fasanmade_pediatric | 1140 | 1140 | -0.0% |
| AUC0-∞ (obs) | passot_adult | 818 | 818 | -0.0% |
| AUC0-∞ (obs) | passot_pediatric | 818 | 818 | -0.0% |
| AUC0-∞ (obs) | ternant | 1130 | 1120 | -0.3% |
| AUC0-∞ (obs) | wojciechowski | 1160 | 1150 | -0.3% |
Inter-individual variability: the paper’s paediatric-model claim
Kim 2025 reports that the paediatric models carry much larger IIV
than the adult models, with Dubinsky and Wojciechowski reaching roughly
110%, and argues that such large IIV “may obscure models’ structural
deficiencies, giving a misleading impression of good model fit despite
poor data characterization”. The extracted $OMEGA values
should reproduce that ordering.
iiv_tab <- bind_rows(lapply(model_names, function(nm) {
  ui <- models[[nm]]
  d <- ui$iniDf
  d <- d[!is.na(d$neta1) & d$neta1 == d$neta2, ]
  tibble::tibble(model = sub("^Kim_2025_infliximab_", "", nm),
                 eta = d$name, variance = d$est, cv_pct = 100 * sqrt(d$est))
}))

iiv_tab |>
  mutate(cv_pct = round(cv_pct, 1)) |>
  pivot_wider(id_cols = model, names_from = eta, values_from = cv_pct) |>
knitr::kable(caption = "IIV as %CV (sqrt of the published OMEGA variance).")| model | etalcl | etalvc | etalcl_ada_neg | etalcl_ada_pos | etalvc_female | etalvc_male | etalvc_wt | etalvp | etalq | etaiov_cl_1 |
|---|---|---|---|---|---|---|---|---|---|---|
| aubourg | 47.0 | 27.0 | NA | NA | NA | NA | NA | NA | NA | NA |
| passot_adult | 30.3 | 22.4 | NA | NA | NA | NA | NA | NA | NA | NA |
| ternant | NA | NA | 22.6 | 27.4 | 11.4 | 14.1 | 19.2 | 15.2 | 10 | NA |
| passot_pediatric | 30.3 | 22.4 | NA | NA | NA | NA | NA | NA | NA | NA |
| dubinsky | 31.3 | 10.0 | NA | NA | NA | NA | NA | 76.1 | 111 | NA |
| wojciechowski | 32.7 | 15.2 | NA | NA | NA | NA | NA | 79.9 | 110 | NA |
| fasanmade_combined | 30.7 | 12.6 | NA | NA | NA | NA | NA | 55.3 | NA | 18.3 |
| fasanmade_pediatric | 25.3 | 16.4 | NA | NA | NA | NA | NA | 34.9 | NA | 21.9 |
# The paper's claim: Dubinsky and Wojciechowski carry ~110% IIV on Q, far above
# anything in the adult models. Ternant also carries an etalq (at 10% CV), so
# the assertion names the models rather than resting on the eta name alone.
q_iiv <- iiv_tab |> filter(eta == "etalq")
stopifnot(setequal(q_iiv$model, c("dubinsky", "wojciechowski", "ternant")))

big_q <- q_iiv |> filter(cv_pct > 105)
stopifnot(setequal(big_q$model, c("dubinsky", "wojciechowski")))
stopifnot(all(big_q$cv_pct < 115))

# No eta of any of the three adult models exceeds 50% CV.
max_adult_iiv <- iiv_tab |>
  filter(model %in% c("aubourg", "passot_adult", "ternant")) |>
  summarise(m = max(cv_pct)) |>
  pull(m)
stopifnot(max_adult_iiv < 50)
The assertion holds: the only two etas above 105% CV in the panel are the inter-compartmental clearance terms of Dubinsky (111%) and Wojciechowski (110%), while no adult-model eta exceeds 50%.
Steady-state troughs against the observed distribution
The clinically relevant quantity in this paper is the maintenance trough. Kim 2025 reports observed troughs with a median of 3.3 mg/L in both cohorts, against a widely used therapeutic target of >5 mg/L, and finds that all the models over-predict. Simulating the standard 5 mg/kg every-8-weeks maintenance regimen shows where each model’s typical trough sits relative to that observed median.
maint_trough <- bind_rows(lapply(model_names, function(nm) {
  bind_rows(lapply(names(ref_cov), function(grp) {
    ui <- models[[nm]]
    cov <- ref_cov[[grp]]
    ev <- rxode2::et(amt = 5 * cov$WT, dur = 0.0833, ii = 56, addl = 8,
                     cmt = "central")
    ev <- rxode2::et(ev, seq(0, 56 * 9, by = 1), cmt = "central")
    dat <- attach_covariates(as.data.frame(ev), ui, cov)
    out <- solve_typical(ui, dat) |> filter(!is.na(Cc))
    tibble::tibble(model = sub("^Kim_2025_infliximab_", "", nm),
                   cohort = grp,
                   trough = out$Cc[out$time == 56 * 9])
  }))
}))
#> ℹ omega/sigma items treated as zero: 'etalcl', 'etalvc'
#> ℹ omega/sigma items treated as zero: 'etalcl', 'etalvc'
#> ℹ omega/sigma items treated as zero: 'etalcl', 'etalvc'
#> ℹ omega/sigma items treated as zero: 'etalcl', 'etalvc'
#> Warning: some etas defaulted to non-mu referenced, possible parsing error: etalcl_ada_neg, etalcl_ada_pos, etalvc_female, etalvc_male
#> as a work-around try putting the mu-referenced expression on a simple line
#> ℹ omega/sigma items treated as zero: 'etalcl_ada_neg', 'etalcl_ada_pos', 'etalvc_female', 'etalvc_male', 'etalvc_wt', 'etalvp', 'etalq'
#> Warning: some etas defaulted to non-mu referenced, possible parsing error: etalcl_ada_neg, etalcl_ada_pos, etalvc_female, etalvc_male
#> as a work-around try putting the mu-referenced expression on a simple line
#> ℹ omega/sigma items treated as zero: 'etalcl_ada_neg', 'etalcl_ada_pos', 'etalvc_female', 'etalvc_male', 'etalvc_wt', 'etalvp', 'etalq'
#> ℹ omega/sigma items treated as zero: 'etalcl', 'etalvc'
#> ℹ omega/sigma items treated as zero: 'etalcl', 'etalvc'
#> ℹ omega/sigma items treated as zero: 'etalcl', 'etalvc', 'etalvp', 'etalq'
#> ℹ omega/sigma items treated as zero: 'etalcl', 'etalvc', 'etalvp', 'etalq'
#> ℹ omega/sigma items treated as zero: 'etalcl', 'etalvc', 'etalvp', 'etalq'
#> ℹ omega/sigma items treated as zero: 'etalcl', 'etalvc', 'etalvp', 'etalq'
#> Warning: some etas defaulted to non-mu referenced, possible parsing error: etaiov_cl_1
#> as a work-around try putting the mu-referenced expression on a simple line
#> ℹ omega/sigma items treated as zero: 'etalcl', 'etalvc', 'etalvp', 'etaiov_cl_1'
#> Warning: some etas defaulted to non-mu referenced, possible parsing error: etaiov_cl_1
#> as a work-around try putting the mu-referenced expression on a simple line
#> ℹ omega/sigma items treated as zero: 'etalcl', 'etalvc', 'etalvp', 'etaiov_cl_1'
#> Warning: some etas defaulted to non-mu referenced, possible parsing error: etaiov_cl_1
#> as a work-around try putting the mu-referenced expression on a simple line
#> ℹ omega/sigma items treated as zero: 'etalcl', 'etalvc', 'etalvp', 'etaiov_cl_1'
#> Warning: some etas defaulted to non-mu referenced, possible parsing error: etaiov_cl_1
#> as a work-around try putting the mu-referenced expression on a simple line
#> ℹ omega/sigma items treated as zero: 'etalcl', 'etalvc', 'etalvp', 'etaiov_cl_1'

ggplot(maint_trough, aes(reorder(model, trough), trough, fill = cohort)) +
  geom_col(position = position_dodge()) +
  geom_hline(yintercept = 3.3, linetype = "dashed") +
  geom_hline(yintercept = 5, linetype = "dotted") +
  coord_flip() +
  labs(x = NULL, y = "Steady-state trough (mg/L)", fill = "Cohort",
       title = "Typical steady-state trough, 5 mg/kg q8w",
       subtitle = "Dashed = observed median 3.3 mg/L (Kim 2025 Table 1); dotted = 5 mg/L target") +
  theme_bw()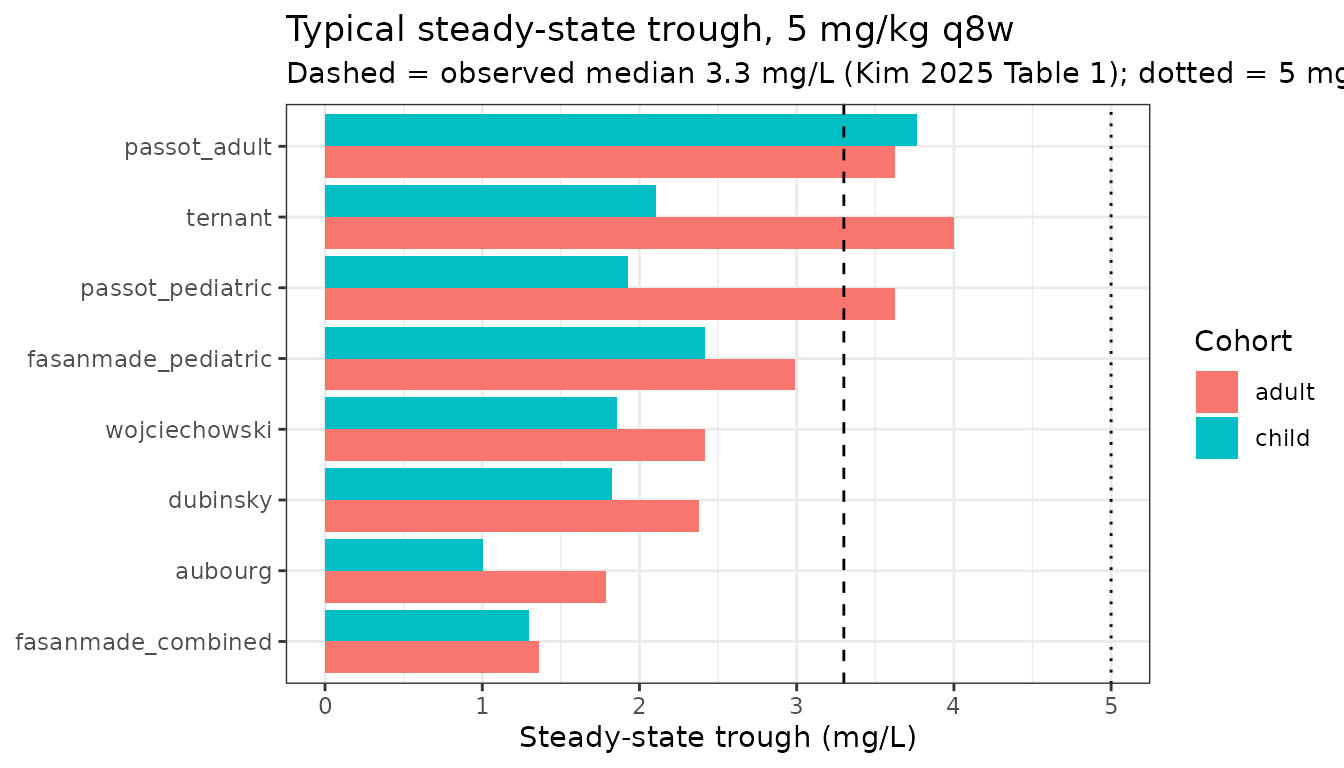
knitr::kable(
  maint_trough |>
    mutate(trough = round(trough, 2)) |>
    pivot_wider(names_from = cohort, values_from = trough),
  caption = "Typical steady-state trough (mg/L) after 5 mg/kg q8w."
)| model | adult | child |
|---|---|---|
| aubourg | 1.79 | 1.01 |
| passot_adult | 3.63 | 3.76 |
| ternant | 4.00 | 2.11 |
| passot_pediatric | 3.63 | 1.93 |
| dubinsky | 2.38 | 1.82 |
| wojciechowski | 2.41 | 1.86 |
| fasanmade_combined | 1.36 | 1.30 |
| fasanmade_pediatric | 2.99 | 2.41 |
Every model’s typical trough falls below the 5 mg/L target at 5 mg/kg q8w, which is consistent with the clinical picture the paper describes: Korean patients were sampled reactively, on suspicion of loss of response, and the observed median trough was 3.3 mg/L. Note that the paper’s “positive bias” finding is a statement about individual predictions against that specific reactive-sampling cohort, not something reproducible from typical-value simulation alone – the validation metrics in Table 2 depend on patient-level data that is not distributed with the paper.
A discrepancy with Frymoyer_2017_infliximab
The library already contains an independent transcription of the same underlying Fasanmade REACH + ACCENT I model, taken from Frymoyer 2017. The two agree on all four typical values (5.42 mL/kg/day, 52.4 mL/kg, 19.6 mL/kg, 2.26 mL/kg/day), on the albumin exponent (-0.855), and on the ADA (+29%) and immunomodulator (-13.7%) effects. They disagree on the sign of the three body-weight exponents.
wt_grid <- seq(20, 110, by = 1)
kim_cl <- 0.3523 * (wt_grid / 65)^(1 - 0.313)       # Kim 2025 Data S1 model #6
fry_cl <- 0.3523 * (wt_grid / 65)^(1 + 0.313)       # Frymoyer_2017_infliximab

tibble::tibble(
  WT = rep(wt_grid, 2),
  CL = c(kim_cl, fry_cl),
  source = rep(c("Kim 2025 (exponent 0.687)", "Frymoyer 2017 (exponent 1.313)"),
               each = length(wt_grid))
) |>
  ggplot(aes(WT, CL, colour = source)) +
  geom_line(linewidth = 0.7) +
  geom_vline(xintercept = 65, linetype = "dashed") +
  labs(x = "Body weight (kg)", y = "Typical CL (L/day)", colour = NULL,
       title = "Fasanmade REACH + ACCENT I: two transcriptions of the weight effect",
       subtitle = "Identical at the 65 kg reference (dashed), divergent away from it") +
  theme_bw() +
  theme(legend.position = "bottom")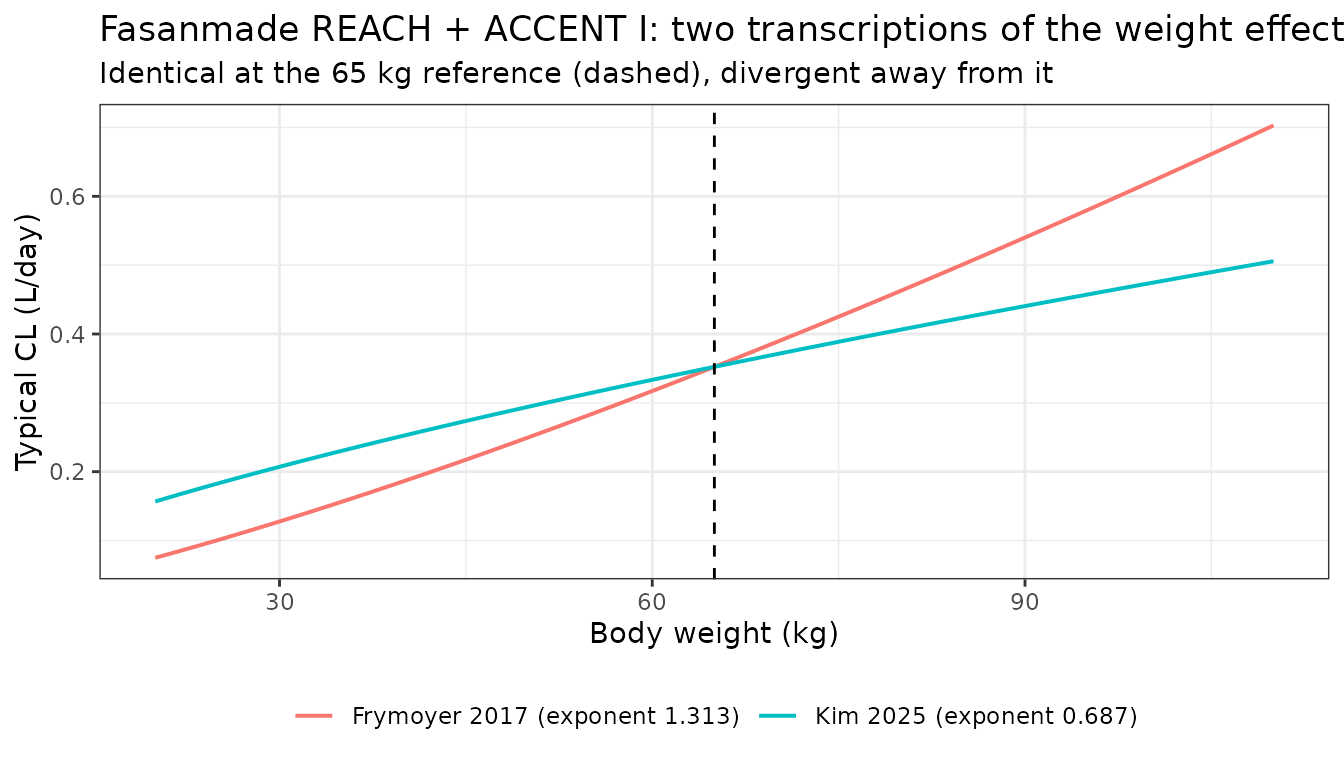
tibble::tibble(
  `Body weight (kg)` = c(30, 45, 65, 90),
  `Kim 2025 CL` = round(0.3523 * (c(30, 45, 65, 90) / 65)^(1 - 0.313), 4),
  `Frymoyer 2017 CL` = round(0.3523 * (c(30, 45, 65, 90) / 65)^(1 + 0.313), 4)
) |>
  mutate(`Difference (%)` = round(100 * (`Frymoyer 2017 CL` / `Kim 2025 CL` - 1), 1)) |>
knitr::kable(caption = "Divergence between the two transcriptions.")| Body weight (kg) | Kim 2025 CL | Frymoyer 2017 CL | Difference (%) |
|---|---|---|---|
| 30 | 0.2071 | 0.1276 | -38.4 |
| 45 | 0.2737 | 0.2174 | -20.6 |
| 65 | 0.3523 | 0.3523 | 0.0 |
| 90 | 0.4406 | 0.5401 | 22.6 |
The two encodings coincide exactly at 65 kg and diverge away from it
– by about -38% at 30 kg and +19% at 90 kg. Kim 2025’s control stream is
explicit (CLWGT = (WGT/65)**THETA(8) with
THETA(8) = -0.313, applied on top of
TVCL = THETA(1)*WGT/1000), which yields a
total-clearance weight exponent of 0.687 – close to the
canonical allometric 0.75. The Frymoyer transcription implies a total
exponent of 1.313, i.e. clearance rising faster than proportionally with
body weight, which is not a plausible allometric relationship for a
monoclonal antibody. These files follow Kim 2025.
This is flagged rather than resolved here: settling it requires the
Fasanmade 2011 primary publication, which was not available when this
model was built. Frymoyer_2017_infliximab is left untouched
here.
Assumptions and deviations
- Second-hand transcription. Every model here is Kim 2025’s re-coding of another author’s model, not a direct extraction from the primary publication. Kim 2025 states it confirmed agreement between its NONMEM implementations and TDMx (Figure S3), which is a meaningful but not independent check. When the primary papers are extracted, these files should be re-verified against them.
-
Two models deferred. Bauman and Petitcollin are not
included, because each needs a canonical name that does not yet exist in
the library registers and that requires an explicit naming decision:
-
Bauman uses erythrocyte sedimentation rate as a covariate
on clearance (
(ESR/9)^0.109).ESRhas no entry ininst/references/covariate-columns.md, and no model in the library currently uses it as a covariate column. -
Petitcollin models immunisation as a logistic-in-time
multiplier on clearance
(
clvar^(expit(-baserisk + beta*t))). This is a third form of time-varying clearance beyond thecl_time_*andcl_exp_stems registered ininst/references/parameter-names.md, andcheckModelConventions()warns on a clearance expression that references time without one of them.
-
Bauman uses erythrocyte sedimentation rate as a covariate
on clearance (
-
Ternant’s non-standard structure. Ternant is the
one model in the panel that departs from the panel’s usual
multiplicative covariate model in two ways, both reproduced verbatim:
-
Clearance is stratified, not offset. A wholly separate
typical CL and a separate CL eta are estimated in each
ADA stratum (0.288 vs 0.768 L/day), so the file uses the stratum-suffix
convention (
lcl_ada_neg/lcl_ada_pos) rather than a reference value pluse_ada_cl. -
The central volume is an additive decomposition.
Vc = 1.7*(WT/67) + [1.1 female | 2.3 male]– a weight-proportional term plus a weight-independent sex intercept, each with its own eta, and linear inWT/67rather than a power function. The three components are namedlvc_wt,lvc_femaleandlvc_maleby analogy with the registered additive multi-component clearance stems (lcl_renal/lcl_nonren); the additive-volume case is not itself registered.
-
Clearance is stratified, not offset. A wholly separate
typical CL and a separate CL eta are estimated in each
ADA stratum (0.288 vs 0.768 L/day), so the file uses the stratum-suffix
convention (
-
IIV scale. Kim 2025’s streams use
OMEGA = CV^2, not the exact log-normalomega^2 = log(1 + CV^2). The published variances are carried through unchanged rather than being converted, because the control stream is the authority for what was actually run. -
Inter-occasion variability. Both Fasanmade streams
declare two IOV occasions on clearance but hard-code
FLAG1 = 1, FLAG2 = 0(“In this cohort, all data were from the maintenance phase”), so exactly one occasion is ever active. Only that occasion’s random effect is carried (etaiov_cl_1, following the registry’s established IOV naming); the second, structurally inert occasion is not declared. It is routed through a named intermediate (iov_cl) inmodel()so that the mu-referenced exponent holds a single eta, which rxode2 requires. -
Albumin units. The canonical
ALBcolumn is SI g/L; every source stream is calibrated on g/dL. Each model file converts inline (alb_gdL <- ALB * 0.1). -
IBD_CDpolarity. The source streams codeDX = 0for Crohn’s disease andDX = 1for ulcerative colitis, the inverse of the canonicalIBD_CD. DeriveIBD_CD = 1 - DX. -
Stray accumulator. The Passot paediatric stream
declares one compartment but carries a
DADT(2) = A(1)/V1line. Compartment 2 is never declared in$MODELand never enters$ERROR, so it is an unused cumulative-AUC accumulator; it is not reproduced. -
No published NCA to compare against. The paper
reports no Cmax / AUC / half-life for any model, so the NCA comparison
above is against the exposure implied by the published clearance
(
Dose/CL) rather than against a published NCA table. The model-performance metrics in Table 2 (MPE / MAE / rRMSE) depend on the retrospective patient-level dataset, which is not distributed. - Reference covariates. The 65 kg adult and 40 kg child used here are chosen to sit near the Kim 2025 validation cohort’s central tendency (Table 1); they are not prescribed by the paper.