Acute hepatitis B virus infection QSP model (Asin-Prieto 2021)
Source:vignettes/articles/AsinPrieto_2021_hepatitisB_qsp.Rmd
AsinPrieto_2021_hepatitisB_qsp.RmdModel and source
- Citation: Asin-Prieto E, Parra-Guillen ZP, Gomez Mantilla JD, Vandenbossche J, Stuyckens K, Woot de Trixhe X, Perez-Ruixo JJ, Troconiz IF. A quantitative systems pharmacology model for acute viral hepatitis B. Comput Struct Biotechnol J. 2021;19:4997-5007. doi:10.1016/j.csbj.2021.08.052. Equations from Supplementary Appendix 1 (equations 1-47); parameter values from Table S1 and initial conditions from Table S2 of the supplementary tables.
- Article: https://doi.org/10.1016/j.csbj.2021.08.052
Asin-Prieto, Parra-Guillen and colleagues (Computational and Structural Biotechnology Journal, 2021) built a quantitative systems pharmacology (QSP) model of acute hepatitis B virus (HBV) infection in adults. It links viral dynamics in the liver to the innate response (dendritic cells, IFN-alpha, natural killer cells, IFN-gamma), the cellular adaptive response (cytotoxic T lymphocytes primed in the lymph node), the humoral response (B cells, plasmablasts, plasma cells, anti-HBs and anti-HBc) and the immunotolerant response (regulatory T cells driving CTL exhaustion), across liver, plasma and lymph-node compartments. The authors implemented it in MATLAB SimBiology.
This is a typical-individual, deterministic mechanism model: every parameter is a literature value, a homeostasis derivation or a calibrated constant (Table S1), so there is no IIV and no residual-error model. The paper’s 500-subject chronicity analysis (30% log-normal variability on 11 parameters) is an exploratory simulation and is not encoded here.
Infection starts from an HBV inoculum in the liver, HBV0
= 0.67 virion/mL (Table S2; about 1000 copies in 1500 mL, the minimum
needle-stick inoculum cited in the Discussion). Setting
HBV0 = 0 gives the uninfected baseline.
mod <- rxode2::rxode2(readModelDb("AsinPrieto_2021_hepatitisB_qsp"))
length(mod$state)
#> [1] 36
# Tight tolerances: rates span 4e-3 to 33/day and states span 0 to 1.3e8
# cell/mL, and several assertions below read times off threshold crossings.
solve_hbv <- function(params = NULL, times = seq(0, 315, by = 0.25)) {
  as.data.frame(rxode2::rxSolve(
    mod,
    rxode2::et(times),
    params = params,
    atol = 1e-10,
    rtol = 1e-8,
    maxsteps = 1e6
  ))
}
Population
The model was not fitted to individual patient data. Typical-value predictions were compared with digitised biomarker time courses from four published cohorts of adults with acute, self-resolving HBV infection (Table 1 of the paper): Webster 2000 (5 patients identified during the incubation period), Dunn 2009 (21 patients sampled during the pre-symptomatic phase), Fisicaro 2009 (2 blood donors who seroconverted) and Chulanov 2003 (21 hospitalised patients). Only the ALT data were used to calibrate model parameters (the ALT release and degradation rate constants); the other biomarkers served as validation data.
Source trace
| Model element | Source location |
|---|---|
Hepatocytes, infection, debris, ALT in liver (iHep_LV,
dHep_LV, ALT_LV; Hep_LV
algebraic) |
Supplementary Appendix 1, eq 1-3, 18 |
| HBV and HBsAg in liver and plasma | eq 4, 5, 20, 22; HBV DNA output eq 21 |
Dendritic cells (DC_LV, DCa_LV,
DC_PL, DCa_LN) |
eq 6, 7, 23, 35 |
| IFN-alpha, NK cells, TRAIL+ NK, IFN-gamma | eq 8-12, 24-26 |
| CTL in liver, plasma and lymph node; exhaustion | eq 13-15, 27, 36, 37 |
| Th0 and Treg | eq 16, 17 |
| B cells, plasmablast chain, plasma cells | eq 40-47 (plasma cells summed, see below) |
| Anti-HBs, anti-HBc and antigen complexes | eq 29-34 |
| Replication cut-off below 1 infected hepatocyte | Main text section 2.2 |
| All parameter values | Table S1 (one row per ini() entry; see the model file
comments) |
| Initial conditions | Table S2; CTL_LN(0) from its footnote 35 |
| HBV DNA conversion (0.2 IU/copy) | Table S2 footnote 33 |
| HBsAg conversion (3.011e11 molecule/ug) | Table S1 footnote 2 |
ini_df <- as.data.frame(mod$iniDf) |>
  dplyr::filter(is.na(neta1)) |>
  dplyr::select(name, est, label)
knitr::kable(ini_df, digits = 6, row.names = FALSE)| name | est | label |
|---|---|---|
| V_LV | 1.5000e+03 | Liver volume (mL) |
| V_PL | 3.0000e+03 | Plasma volume (mL) |
| V_LN | 7.3000e+02 | Lymph nodes volume (mL) |
| HBV0 | 6.7000e-01 | Initial liver HBV inoculum (virion/mL); 0 = uninfected baseline |
| kinf | 0.0000e+00 | Hepatocyte infection rate constant (mL/virion/day) |
| ksyn_HBV | 3.1500e+02 | HBV synthesis rate constant by infected hepatocytes (virion/cell/day) |
| ksyn_HBsAg | 4.5165e+04 | HBsAg synthesis rate constant by infected hepatocytes (molecule/cell/day) |
| kact_DC | 2.0000e-01 | Naive DC activation rate constant (1/day) |
| ksyn_IFNa | 4.5920e+02 | IFN-alpha independent production (pg/mL/day) |
| ksyn_IFNa_DC | 1.0000e-01 | IFN-alpha produced by the pDC fraction of activated DC (pg/cell/day) |
| kact_NK | 1.8000e-05 | Naive NK activation rate constant (1/day) |
| ksyn_IFNg_NK | 3.3400e-03 | IFN-gamma production by activated NK (pg/cell/day) |
| ksyn_IFNg_CTL | 3.4000e-03 | IFN-gamma production by liver IFN-gamma+ CTL (pg/cell/day) |
| kprol_CTL | 5.7000e-01 | Proliferation of activated CTL in liver and lymph node (1/day) |
| kact_Treg | 2.5600e-02 | Activation of Treg in the liver (mL/cell/day) |
| kprol_Treg | 7.0000e-01 | Proliferation of Treg in the liver (1/day) |
| ksyn_ALT | 0.0000e+00 | ALT synthesis by debris hepatocytes (IU/cell/day) |
| ksyn_DC | 1.0760e+04 | Naive DC daily production (cell/mL/day) |
| ksyn_NK | 1.1850e+05 | Naive NK daily production (cell/mL/day) |
| kprod_antiHBs | 1.2000e+09 | Anti-HBs production per plasma cell (molecule/cell/day) |
| kprod_antiHBc | 1.2000e+09 | Anti-HBc production per plasma cell (molecule/cell/day) |
| ksyn_CTL | 1.0000e+03 | CTL production in the lymph node (cell/mL/day) |
| krec_CTL | 1.0000e-01 | CTL recruitment by activated DC in the lymph node (cell/cell/day) |
| kact_CTL | 1.0000e-04 | CTL activation by activated DC in the lymph node (mL/cell/day) |
| ksyn_Bcell | 2.0000e+02 | Naive B-cell daily production (cell/mL/day) |
| kact_Bcell | 1.0000e+00 | Activation of B cells (1/day) |
| kdeath_Hep | 3.9000e-03 | Natural death of healthy and infected hepatocytes (1/day) |
| kdeath_dHep | 1.3000e+01 | Disappearance of debris hepatocytes (1/day) |
| kdeg_HBV | 7.0000e-01 | Natural degradation of HBV (1/day) |
| kdeath_DC | 2.3100e-01 | Natural death of activated and naive DC (1/day) |
| kdeg_IFNa | 5.7400e+00 | Degradation of IFN-alpha (1/day) |
| kdeath_NK | 6.9000e-02 | Natural death of activated and naive NK (1/day) |
| kdeg_IFNg | 3.3400e+01 | Degradation of IFN-gamma (1/day) |
| kexh_CTLa | 4.0300e-01 | Exhaustion rate constant of activated CTL (1/day) |
| kdeath_CTLa | 3.3000e-01 | Natural death of activated CTL (1/day) |
| kdeath_CTLexh | 3.3000e-02 | Natural death of exhausted CTL (1/day) |
| kdeath_Treg | 1.0000e-01 | Natural death of Treg (1/day) |
| kdeg_ALT | 9.0000e-02 | Degradation of ALT (1/day) |
| kdeg_HBsAg | 8.3500e-02 | Natural degradation of HBsAg (1/day) |
| kdeg_antiHBs | 3.3000e-02 | Natural degradation of anti-HBs (1/day) |
| kdeg_cpxHBV | 2.7000e+00 | Natural degradation of the HBV:anti-HBs complex (1/day) |
| kdeg_cpxHBsAg | 2.7000e+00 | Natural degradation of the HBsAg:anti-HBs complex (1/day) |
| kdeg_antiHBc | 3.3000e-02 | Natural degradation of anti-HBc (1/day) |
| kdeath_CTL | 1.0200e-01 | Natural death of CTL precursors in the lymph node (1/day) |
| kdeath_Bcell | 2.0000e-01 | Natural death of naive B cells (1/day) |
| MTT_PB | 5.0000e+01 | Mean transit time of plasmablasts (day) |
| N_PB | 5.0000e+00 | Number of plasmablast transit compartments (unitless) |
| kdeath_PB | 1.0000e-01 | Natural death of plasmablasts (1/day) |
| kdeath_PC | 1.0000e-01 | Natural death of plasma cells in plasma and lymph node (1/day) |
| Hep_tot | 1.3300e+08 | Total liver hepatocytes (cell/mL) |
| pDC_ratio | 3.6000e-01 | Fraction of pDC among activated DC (unitless) |
| CTLa_ratio | 6.5000e-01 | Fraction of activated CTL that are IFN-gamma+ (unitless) |
| NK_ratio | 5.0000e-01 | Fraction of activated NK that are TRAIL+ (unitless) |
| CTLa_max_LV | 2.0000e+06 | Maximal concentration of activated CTL in the liver (cell/mL) |
| Treg_max_LV | 2.0000e+06 | Maximal concentration of Treg in the liver (cell/mL) |
| CTLa_max_LN | 1.0000e+05 | Maximal concentration of activated CTL in the lymph node (cell/mL) |
| kLV_PL_HBV | 1.0000e+00 | HBV distribution from liver to plasma (1/day) |
| kPL_LV_HBV | 1.0000e+00 | HBV distribution from plasma to liver (1/day) |
| kLV_PL_HBsAg | 1.0000e+00 | HBsAg distribution from liver to plasma (1/day) |
| kPL_LV_HBsAg | 1.0000e+00 | HBsAg distribution from plasma to liver (1/day) |
| kPL_LV_DC | 5.9900e-02 | DC distribution from plasma to liver (1/day) |
| kLV_LN_DCa | 9.0000e-01 | Activated DC distribution from liver to lymph node (1/day) |
| kPL_LV_NK | 5.7500e-01 | NK distribution from plasma to liver (1/day) |
| kPL_LV_CTLa | 9.0000e-01 | Activated CTL distribution from plasma to liver (1/day) |
| kLV_PL_ALT | 9.0000e-02 | ALT distribution from liver to plasma (1/day) |
| kLN_PL_CTLa | 9.0000e-01 | Activated CTL distribution from lymph node to plasma (1/day) |
| kon_antiHBs | 0.0000e+00 | Association rate of HBV and HBsAg with anti-HBs (mL/molecule/day) |
| koff_antiHBs | 1.0000e+01 | Dissociation rate of anti-HBs complexes (1/day) |
| kLN_PL_PC | 9.0000e-01 | Plasma-cell distribution from lymph node to plasma (1/day) |
| klytic_CTL | 3.7000e-05 | Cytopathic effect of CTL on infected hepatocytes (mL/cell/day) |
| klytic_NK | 1.0000e-06 | Cytopathic effect of NK on infected hepatocytes (mL/cell/day) |
| IFNa50_HBV | 1.0000e+02 | IFN-alpha inhibiting 50% of HBV synthesis (pg/mL) |
| IFNg50_HBV | 5.3170e+02 | IFN-gamma inhibiting 50% of HBV synthesis (pg/mL) |
| HBV50_DC | 1.0000e+01 | HBV triggering 50% of maximal DC activation (virion/mL) |
| HBsAg50_IFNa | 2.2000e+11 | Liver HBsAg inhibiting 50% of DC-induced IFN-alpha synthesis (molecule/mL) |
| SLP_IFNa_NK | 5.2500e+00 | Fractional change in NK activation per unit IFN-alpha (mL/pg) |
| HBV50_CTL_prol | 1.0000e+01 | HBV triggering 50% of maximal CTL proliferation (virion/mL) |
| gamma_CTL | 4.0000e+00 | Shape parameter of HBV effect on CTL proliferation (unitless) |
| Treg50_CTL_exh | 1.0000e+06 | Treg triggering 50% of maximal CTL exhaustion (cell/mL) |
| CTL50_Treg_prol | 1.0000e+06 | Activated CTL triggering 50% of maximal Treg proliferation (cell/mL) |
| DC50_CTL_prol | 1.0000e+00 | Activated DC triggering 50% of maximal CTL proliferation in lymph node (cell/mL) |
| DC50_Bcell_prol | 1.0000e+00 | Activated DC triggering 50% of maximal B-cell activation in lymph node (cell/mL) |
Validation 1: uninfected steady state
With no inoculum the system should hold at its baseline: the paper derived several synthesis rates and initial conditions “to keep homeostasis” (Table S1 footnotes 3-5, 8-12 and Table S2 footnotes 32 and 35).
base <- solve_hbv(params = c(HBV0 = 0))
drift <- tibble::tibble(state = mod$state) |>
  dplyr::rowwise() |>
  dplyr::mutate(
    start = base[[state]][1],
    end = base[[state]][nrow(base)],
    rel_change = ifelse(start == 0, end, (end - start) / start)
  ) |>
  dplyr::ungroup()
drift |>
  dplyr::filter(abs(rel_change) > 1e-6) |>
knitr::kable(digits = 4)| state | start | end | rel_change |
|---|---|---|---|
| dHep_LV | 4.00e+04 | 39900.0000 | -0.0025 |
| DC_LV | 1.92e+04 | 19182.8614 | -0.0009 |
| NK_LV | 2.70e+06 | 2760253.9825 | 0.0223 |
| NKa_LV | 3.00e+05 | 306516.2038 | 0.0217 |
| IFNg_LV | 3.00e+01 | 30.6516 | 0.0217 |
| ALT_LV | 1.80e-02 | 0.0180 | -0.0025 |
| ALT_PL | 9.00e-03 | 0.0090 | -0.0025 |
| DC_PL | 3.70e+04 | 36988.6559 | -0.0003 |
| NK_PL | 1.84e+05 | 184006.2112 | 0.0000 |
stopifnot(
  # The infection-dependent states stay exactly at zero.
  all(base$iHep_LV == 0),
  all(base$HBV_PL == 0),
  # Every state is within 3% of its baseline after 45 weeks.
  max(abs(drift$rel_change)) < 0.03
)
Two small drifts remain, both from rounding in the published tables rather than from the model structure:
-
NK_LV,NKa_LVandIFNg_LVrise by about 2%. Table S1 footnote 19 deriveskPL_LV_NKfrom a plasma NK level of 1.8e5 cell/mL, but Table S2 setsNK_PL(0)to 1.84e5; the extra 2% of NK influx carries through to activated NK and the IFN-gamma they produce. -
dHep_LVand both ALT pools settle 0.25% low. Table S1 footnote 12 deriveskdeath_dHep= 13/day from 1.3e8 hepatocytes, whileHep_totis 1.33e8 anddHep_LV(0)is the rounded 40000 cell/mL.
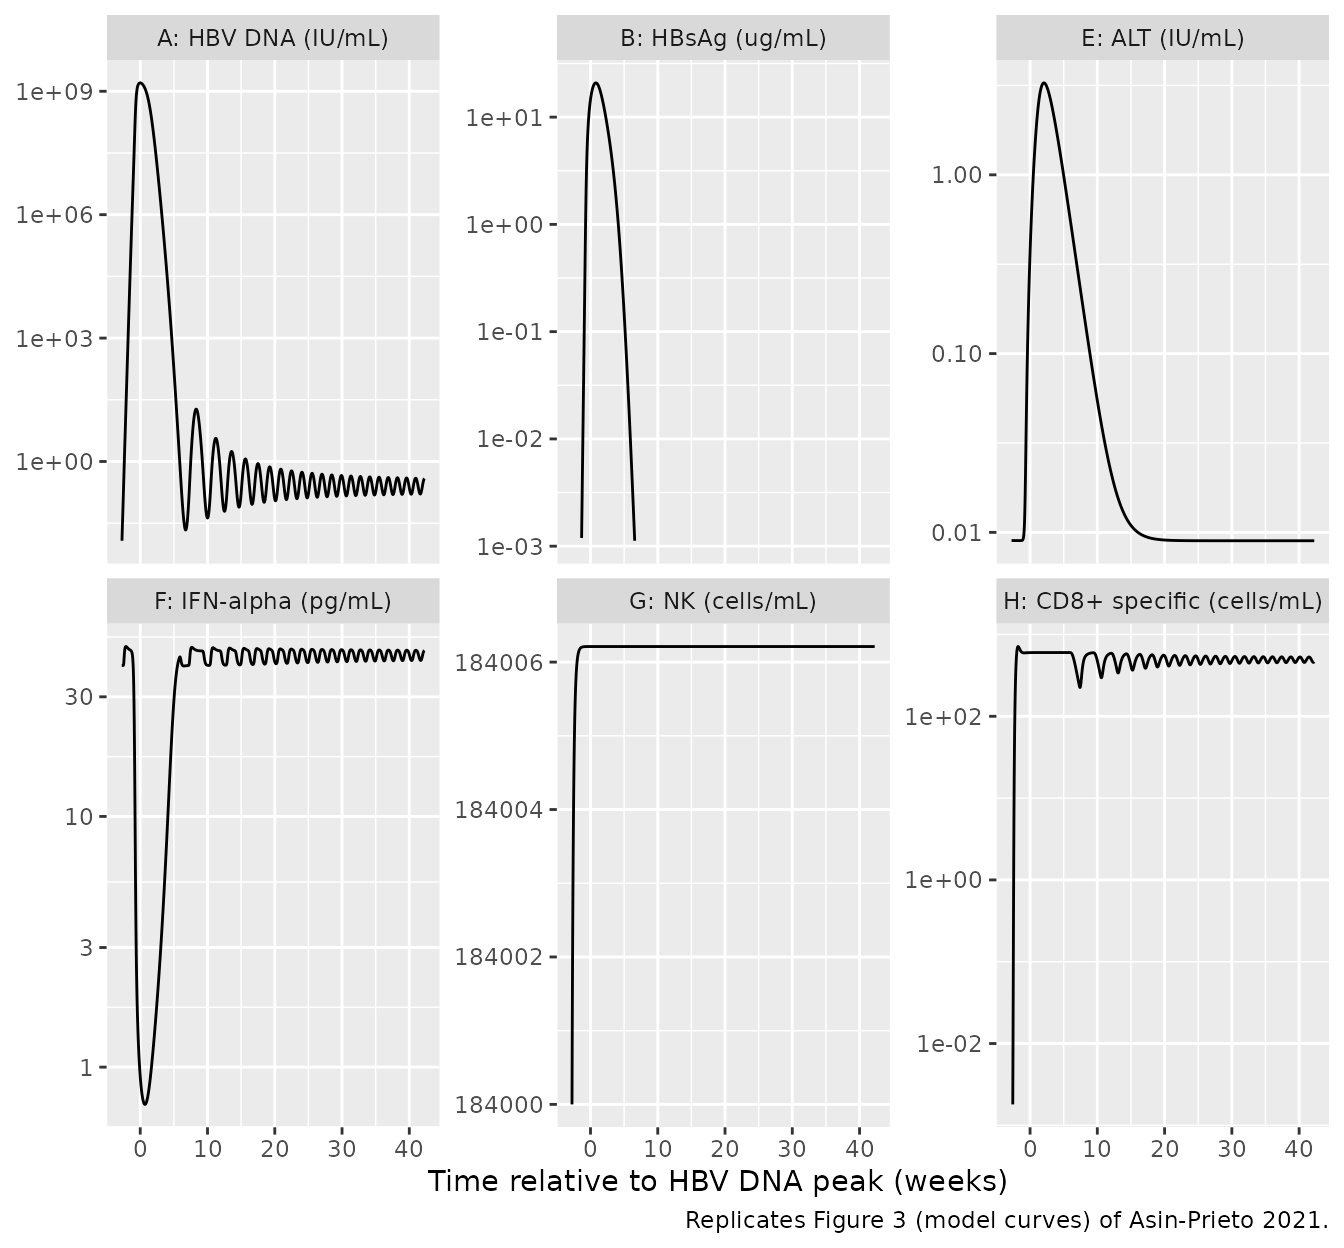
Validation 2: the reference acute infection (Figures 2 and 3)
ref <- solve_hbv()

t_peak <- ref$time[which.max(ref$HBVDNA)]
after_peak <- ref[ref$time > t_peak, ]
t_lt200 <- after_peak$time[which(after_peak$HBVDNA < 200)[1]]
t_lt20 <- after_peak$time[which(after_peak$HBVDNA < 20)[1]]
t_alt_peak <- ref$time[which.max(ref$ALT_UL)]
hbsag_pos <- ref$time[ref$HBsAg_ngmL > 0.1]
hbv_gt240 <- ref$time[ref$HBVDNA > 240]

gates <- tibble::tribble(
  ~quantity, ~paper, ~paper_days, ~model_days,
  "Time from inoculation to HBV DNA peak", "3 weeks", 21, t_peak,
  "Time from inoculation to HBV DNA < 200 IU/mL", "52 days", 52, t_lt200,
  "Time from inoculation to HBV DNA < 20 IU/mL", "approx. 8 weeks", 56, t_lt20,
  "ALT peak after HBV DNA peak", "2 weeks", 14, t_alt_peak - t_peak,
  "ALT peak after first detectable HBsAg (> 0.1 ng/mL)", "3 weeks", 21, t_alt_peak - min(hbsag_pos),
  "HBsAg above 0.1 ng/mL until", "up to 10 weeks", 70, max(hbsag_pos),
  "Duration of HBsAg antigenemia", "60 days", 60, max(hbsag_pos) - min(hbsag_pos),
  "Duration of HBV DNA above 240 IU/mL", "7 weeks", 49, max(hbv_gt240) - min(hbv_gt240)
) |>
  dplyr::mutate(pct_diff = 100 * (model_days - paper_days) / paper_days)

gates |>
  dplyr::rename(
    "Quantity" = quantity,
    "Paper (text)" = paper,
    "Paper (days)" = paper_days,
    "Model (days)" = model_days,
    "Difference (%)" = pct_diff
  ) |>
knitr::kable(digits = 1)| Quantity | Paper (text) | Paper (days) | Model (days) | Difference (%) |
|---|---|---|---|---|
| Time from inoculation to HBV DNA peak | 3 weeks | 21 | 19.2 | -8.3 |
| Time from inoculation to HBV DNA < 200 IU/mL | 52 days | 52 | 54.2 | 4.3 |
| Time from inoculation to HBV DNA < 20 IU/mL | approx. 8 weeks | 56 | 57.0 | 1.8 |
| ALT peak after HBV DNA peak | 2 weeks | 14 | 14.5 | 3.6 |
| ALT peak after first detectable HBsAg (> 0.1 ng/mL) | 3 weeks | 21 | 25.0 | 19.0 |
| HBsAg above 0.1 ng/mL until | up to 10 weeks | 70 | 69.8 | -0.4 |
| Duration of HBsAg antigenemia | 60 days | 60 | 61.0 | 1.7 |
| Duration of HBV DNA above 240 IU/mL | 7 weeks | 49 | 47.8 | -2.6 |
The paper states the HBV DNA times as “52 days after viral peak” and “a predicted time from peak to negativity (20 IU/mL) of 55 days”. Counted from the peak, the model gives 35 and 37.8 days; counted from inoculation it gives 54.2 and 57 days, matching the paper’s “complete viral eradication (< 20 IU/mL) in approximately 8 weeks”. The table therefore compares the inoculation-based times.
# The model is deterministic, so these checks do not depend on a random
# cohort. The bounds allow for the paper's rounded reporting (weeks, "52
# days") and for the plasma-cell simplification described under
# Assumptions and deviations.
stopifnot(
  abs(gates$pct_diff[gates$quantity == "Time from inoculation to HBV DNA peak"]) < 15,
  all(abs(gates$pct_diff[-c(1, 5)]) < 10),
  # Figure 3B: HBsAg peaks in the tens of ug/mL.
  max(ref$HBsAg_ngmL) / 1000 > 10, max(ref$HBsAg_ngmL) / 1000 < 100,
  # Figure 3F: IFN-alpha in plasma dips from 40 pg/mL to about 1 pg/mL.
  min(ref$IFNa_PL) < 2,
  # Figure 3H: HBV-specific CD8+ cells in plasma plateau near 1e3 cell/mL
  # and persist to week 30. After clearance they oscillate (about 250-600
  # cell/mL) with the low-level residual infection, so check the median.
  median(ref$CTLa_PL[ref$time >= 56 & ref$time <= 210]) > 300,
  median(ref$CTLa_PL[ref$time >= 56 & ref$time <= 210]) < 1000,
  # HBV DNA stays below 20 IU/mL from clearance to week 45.
  all(ref$HBVDNA[ref$time >= 60] < 20)
)
The ALT peak lags the first detectable HBsAg by about 3.6 weeks instead of 3; that gate is reported but not asserted. After clearance, liver HBV settles around 10 virion/mL (the DC and CTL half-activation level), and the immune cells and virus oscillate gently around that point; HBV DNA in plasma stays below 1 IU/mL.
# Replicates Figure 3 of Asin-Prieto 2021 (model curves only; the digitised
# clinical points are not reproduced). Time is relative to the HBV DNA peak,
# as in the paper.
fig3 <- ref |>
  dplyr::mutate(week = (time - t_peak) / 7) |>
  dplyr::transmute(
    week,
    "A: HBV DNA (IU/mL)" = HBVDNA,
    "B: HBsAg (ug/mL)" = HBsAg_ngmL / 1000,
    "E: ALT (IU/mL)" = ALT_PL,
    "F: IFN-alpha (pg/mL)" = IFNa_PL,
    "G: NK (cells/mL)" = NK_PL,
    "H: CD8+ specific (cells/mL)" = CTLa_PL
  ) |>
  tidyr::pivot_longer(-week, names_to = "panel", values_to = "value") |>
  dplyr::filter(value > 1e-3)

ggplot(fig3, aes(week, value)) +
  geom_line() +
  scale_y_log10() +
  facet_wrap(~panel, scales = "free_y") +
  labs(
    x = "Time relative to HBV DNA peak (weeks)",
    y = NULL,
    caption = "Replicates Figure 3 (model curves) of Asin-Prieto 2021."
  )
# Replicates Figure 2 of Asin-Prieto 2021 for HBV DNA and HBsAg, normalised to
# their detection limits (20 IU/mL and 0.1 ng/mL). The paper does not print
# the anti-HBs or anti-HBc unit conversions, so the antibodies are shown in
# molecule/mL on a separate panel.
fig2 <- ref |>
  dplyr::mutate(week = time / 7) |>
  dplyr::filter(week <= 30) |>
  dplyr::transmute(
    week,
    "HBV DNA / 20 IU/mL" = HBVDNA / 20,
    "HBsAg / 0.1 ng/mL" = HBsAg_ngmL / 0.1,
    "anti-HBs (molecule/mL)" = antiHBs_PL,
    "anti-HBc (molecule/mL)" = antiHBc_PL
  ) |>
  tidyr::pivot_longer(-week, names_to = "series", values_to = "value") |>
  dplyr::mutate(
    panel = ifelse(grepl("^anti", series), "Antibodies", "Relative to detection limit")
  ) |>
  dplyr::filter(value > 1e-2)

ggplot(fig2, aes(week, value, colour = series)) +
  geom_line() +
  geom_hline(
    data = data.frame(panel = "Relative to detection limit", y = 1),
    aes(yintercept = y),
    linetype = "dashed"
  ) +
  scale_y_log10() +
  facet_wrap(~panel, scales = "free_y") +
  labs(
    x = "Time since inoculation (weeks)",
    y = NULL,
    colour = NULL,
    caption = "Replicates Figure 2 of Asin-Prieto 2021."
  ) +
  theme(legend.position = "bottom")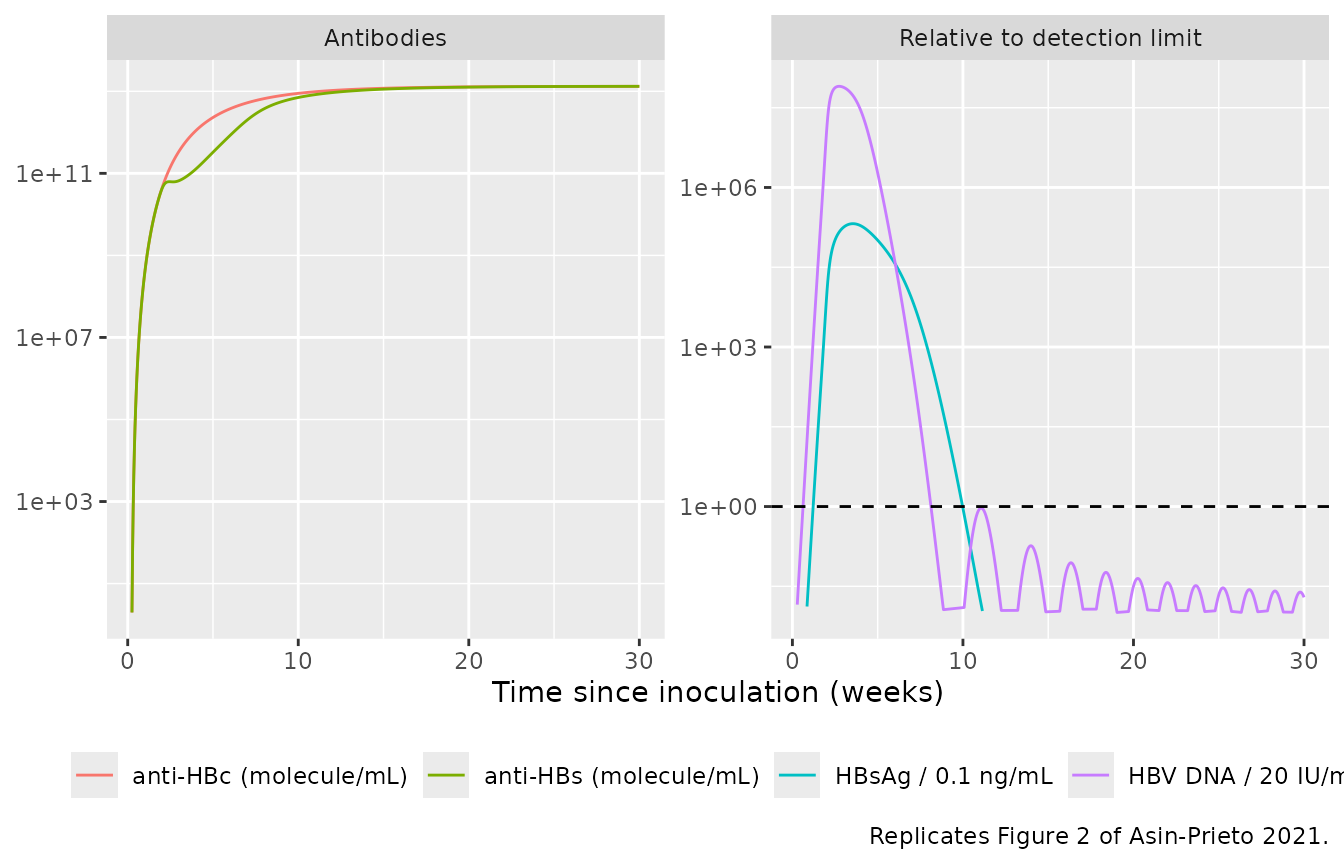
The antibodies rise to a plateau and are still rising slowly at week 30, whereas Figure 2 and Figures 3C/3D show them peaking near week 18 and then declining. See Assumptions and deviations.
Validation 3: knock-out analysis (Figure 6)
The paper switched off one immune pathway at a time. It reports that blocking NK activation had no impact, that blocking B-cell activation or raising Treg-mediated CTL exhaustion five-fold slowed clearance without changing the outcome, and that blocking CTL or DC activation, or raising the sensitivity of Treg proliferation to CTL five-fold, led to chronic infection (the last with sustained hepatic damage).
scenarios <- list(
  "Reference" = NULL,
  "No NK activation (kact_NK = 0)" = c(kact_NK = 0),
  "No CTL activation (kact_CTL = 0)" = c(kact_CTL = 0),
  "No B-cell activation (kact_Bcell = 0)" = c(kact_Bcell = 0),
  "No DC activation (kact_DC = 0)" = c(kact_DC = 0),
  "CTL50_Treg_prol = 200000" = c(CTL50_Treg_prol = 2e5),
  "Treg50_CTL_exh = 200000" = c(Treg50_CTL_exh = 2e5)
)
paper_outcome <- c(
  "resolves", "resolves", "chronic", "resolves", "chronic", "chronic", "resolves"
)
ko <- dplyr::bind_rows(lapply(names(scenarios), function(nm) {
  solve_hbv(params = scenarios[[nm]]) |> dplyr::mutate(scenario = nm)
}))
ko_summary <- ko |>
  dplyr::group_by(scenario) |>
  dplyr::summarise(
    peak_HBVDNA = max(HBVDNA),
    HBVDNA_wk45 = HBVDNA[time == 315],
    ALT_wk45 = ALT_UL[time == 315],
    .groups = "drop"
  ) |>
  dplyr::mutate(
    model_outcome = ifelse(HBVDNA_wk45 < 20, "resolves", "chronic"),
    paper_outcome = paper_outcome[match(scenario, names(scenarios))]
  ) |>
  dplyr::arrange(match(scenario, names(scenarios)))

ko_summary |>
  dplyr::rename(
    "Scenario" = scenario,
    "Peak HBV DNA (IU/mL)" = peak_HBVDNA,
    "HBV DNA at week 45 (IU/mL)" = HBVDNA_wk45,
    "ALT at week 45 (U/L)" = ALT_wk45,
    "Model outcome" = model_outcome,
    "Paper outcome" = paper_outcome
  ) |>
  dplyr::mutate(dplyr::across(dplyr::where(is.numeric), ~ signif(.x, 3))) |>
knitr::kable()| Scenario | Peak HBV DNA (IU/mL) | HBV DNA at week 45 (IU/mL) | ALT at week 45 (U/L) | Model outcome | Paper outcome |
|---|---|---|---|---|---|
| Reference | 1.60e+09 | 3.86e-01 | 8.98 | resolves | resolves |
| No NK activation (kact_NK = 0) | 1.71e+09 | 3.65e-01 | 8.98 | resolves | resolves |
| No CTL activation (kact_CTL = 0) | 2.14e+09 | 2.14e+09 | 12.00 | chronic | chronic |
| No B-cell activation (kact_Bcell = 0) | 1.62e+09 | 6.59e-01 | 8.98 | resolves | resolves |
| No DC activation (kact_DC = 0) | 2.20e+09 | 2.20e+09 | 11.40 | chronic | chronic |
| CTL50_Treg_prol = 200000 | 1.60e+09 | 9.42e+08 | 6020.00 | chronic | chronic |
| Treg50_CTL_exh = 200000 | 2.02e+09 | 2.91e-01 | 8.98 | resolves | resolves |
# Resolution is HBV DNA < 20 IU/mL at week 45, the paper's definition.
stopifnot(
  identical(ko_summary$model_outcome, ko_summary$paper_outcome),
  # "sustained hepatic damage" in the CTL50_Treg_prol scenario
  ko_summary$ALT_wk45[ko_summary$scenario == "CTL50_Treg_prol = 200000"] > 1000
)
# Replicates Figure 6 of Asin-Prieto 2021.
ko |>
  dplyr::mutate(week = time / 7, scenario = factor(scenario, names(scenarios))) |>
  dplyr::select(week, scenario, "HBV DNA (IU/mL)" = HBVDNA, "HBsAg (ng/mL)" = HBsAg_ngmL, "ALT (U/L)" = ALT_UL) |>
  tidyr::pivot_longer(-c(week, scenario), names_to = "marker", values_to = "value") |>
  dplyr::filter(value > 1e-2) |>
  ggplot(aes(week, value, colour = scenario)) +
  geom_line() +
  scale_y_log10() +
  facet_wrap(~marker, ncol = 1, scales = "free_y") +
  labs(
    x = "Time since inoculation (weeks)",
    y = NULL,
    colour = NULL,
    caption = "Replicates Figure 6 of Asin-Prieto 2021."
  ) +
  theme(legend.position = "right")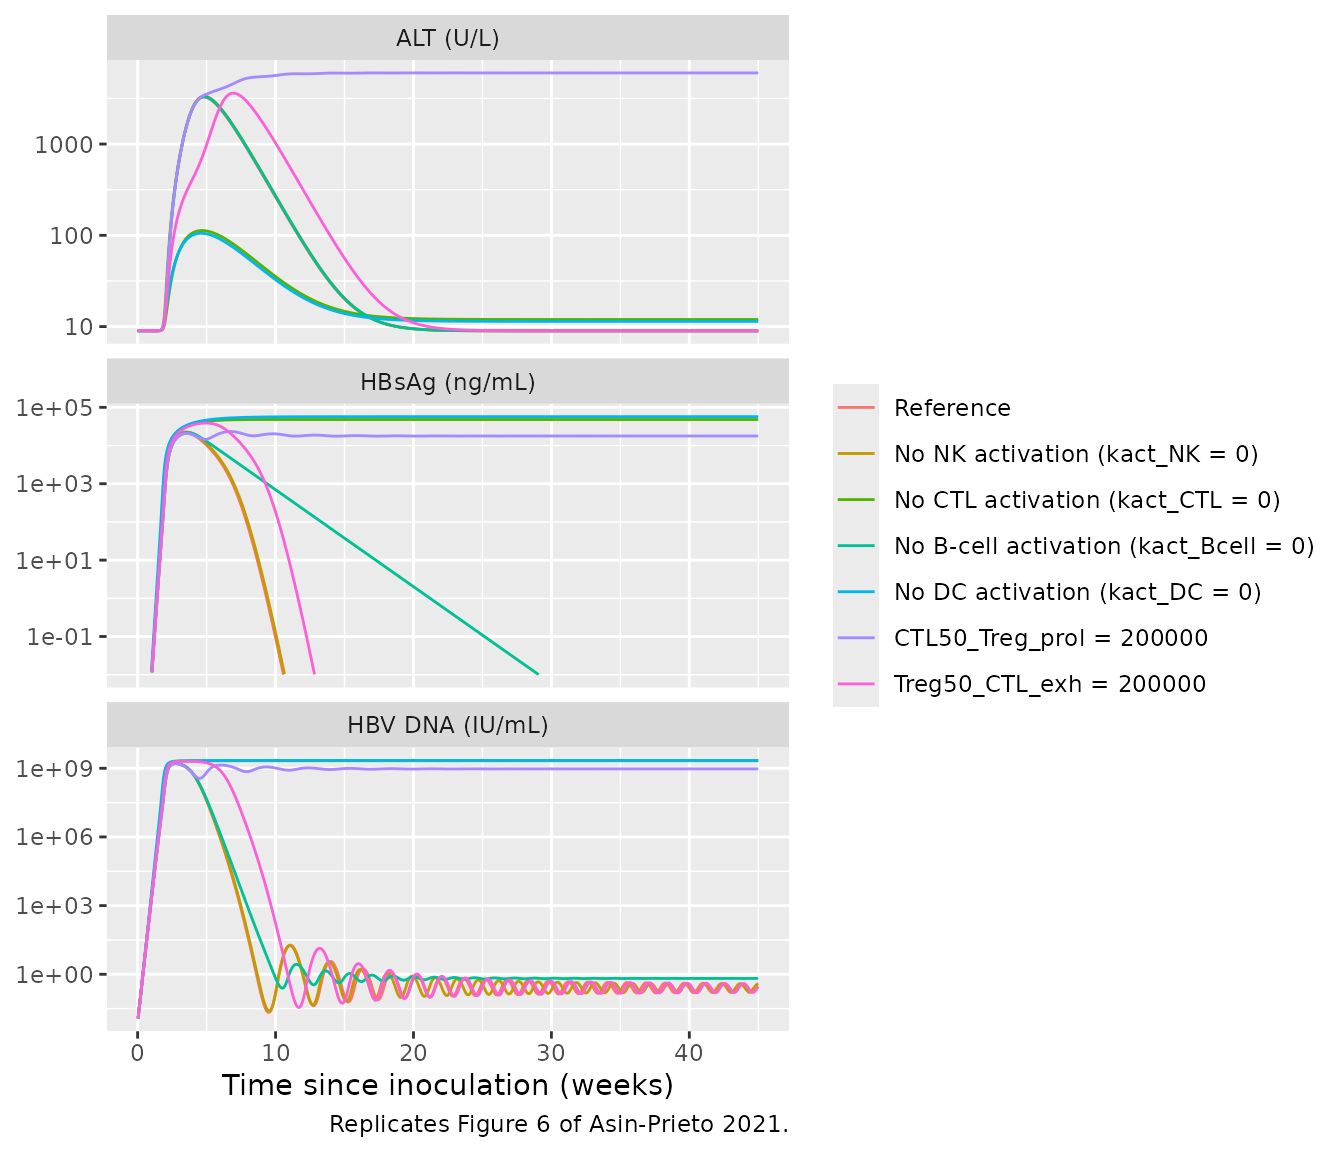
Validation 4: parameter scan (Figure 5B)
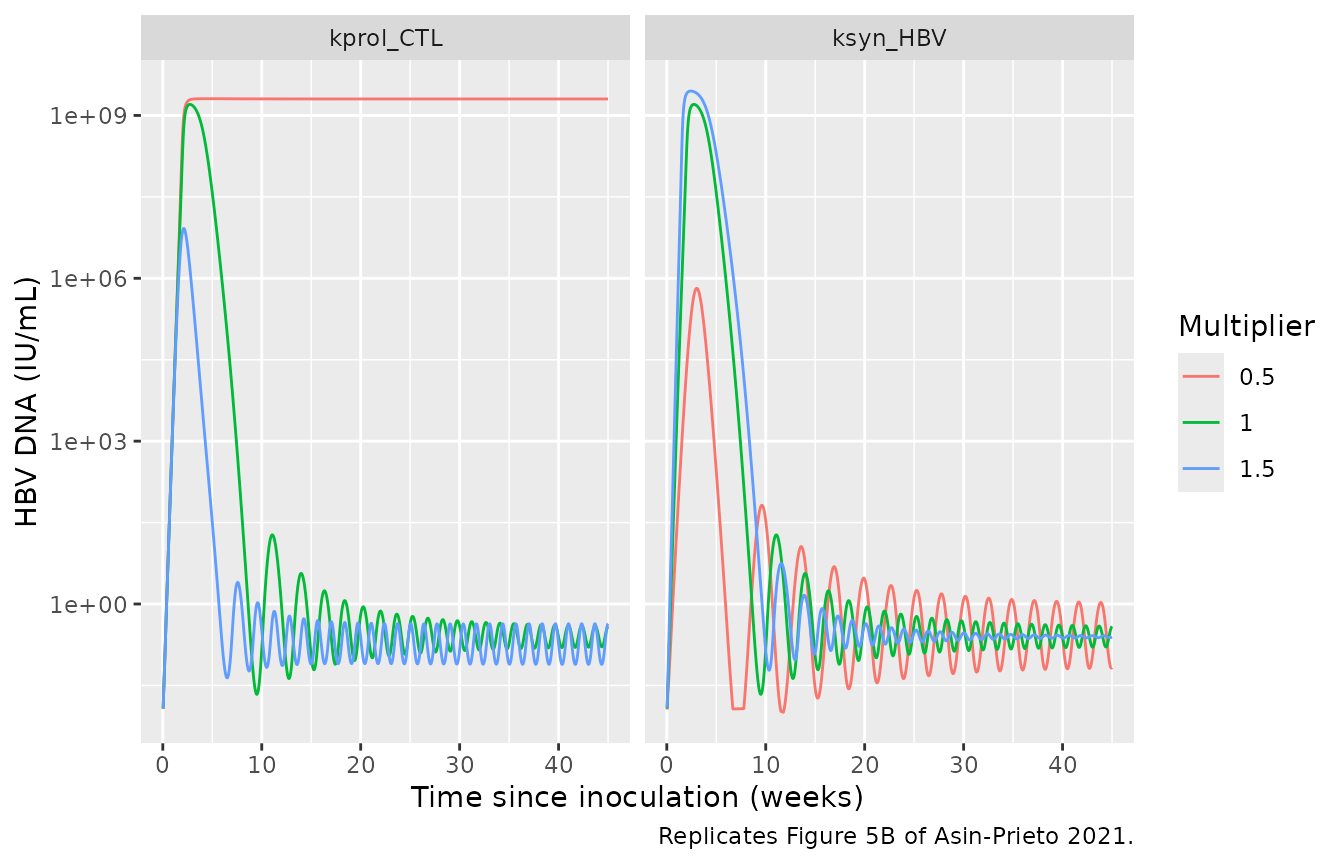
The paper reports that of the influential parameters, only a +/-50%
change in CTL proliferation (kprol_CTL) switched the
outcome from responder to non-responder; the same change in HBV
synthesis (ksyn_HBV) moved peak levels and time to cure but
not the outcome.
scan <- tidyr::expand_grid(
  parameter = c("kprol_CTL", "ksyn_HBV"),
  factor = c(0.5, 1, 1.5)
)
scan_sim <- dplyr::bind_rows(lapply(seq_len(nrow(scan)), function(i) {
  base_value <- ini_df$est[ini_df$name == scan$parameter[i]]
  p <- stats::setNames(base_value * scan$factor[i], scan$parameter[i])
  solve_hbv(params = p) |>
    dplyr::mutate(parameter = scan$parameter[i], factor = scan$factor[i])
}))
scan_summary <- scan_sim |>
  dplyr::group_by(parameter, factor) |>
  dplyr::summarise(HBVDNA_wk45 = HBVDNA[time == 315], .groups = "drop") |>
  dplyr::mutate(outcome = ifelse(HBVDNA_wk45 < 20, "resolves", "chronic"))
knitr::kable(scan_summary, digits = 3)| parameter | factor | HBVDNA_wk45 | outcome |
|---|---|---|---|
| kprol_CTL | 0.5 | 2.012977e+09 | chronic |
| kprol_CTL | 1.0 | 3.860000e-01 | resolves |
| kprol_CTL | 1.5 | 4.340000e-01 | resolves |
| ksyn_HBV | 0.5 | 6.800000e-02 | resolves |
| ksyn_HBV | 1.0 | 3.860000e-01 | resolves |
| ksyn_HBV | 1.5 | 2.460000e-01 | resolves |
stopifnot(
  scan_summary$outcome[scan_summary$parameter == "kprol_CTL" & scan_summary$factor == 0.5] == "chronic",
  all(scan_summary$outcome[scan_summary$parameter == "ksyn_HBV"] == "resolves"),
  all(scan_summary$outcome[scan_summary$factor >= 1] == "resolves")
)

scan_sim |>
  dplyr::filter(HBVDNA > 1e-2) |>
  ggplot(aes(time / 7, HBVDNA, colour = factor(factor))) +
  geom_line() +
  scale_y_log10() +
  facet_wrap(~parameter) +
  labs(
    x = "Time since inoculation (weeks)",
    y = "HBV DNA (IU/mL)",
    colour = "Multiplier",
    caption = "Replicates Figure 5B of Asin-Prieto 2021."
  )
Assumptions and deviations
Parameters used by the printed equations but not reported
Table S1 is described as listing all model parameters, but five symbols in Supplementary Appendix 1 have no value anywhere in the paper or its supplements. No value was invented for any of them:
-
The memory-CTL branch is omitted.
CTLm_ref_LN,CTLm_LNandCTLm_PL(eq 28, 38, 39) needk_tr_CTLm,k_death_CTLm_refandk_LN_PL_CTLm, none of which is reported. Memory CTL appear in no other equation, so the branch is an output-only sink and dropping it changes no other state. Table S1’sk_death_CTLm(0.22/day) andCTLm_RATIO(0.05) are therefore not carried. -
Short- and long-lived plasma cells are merged. Eq
46/47 split the plasmablast output by
PC_RATIOand give long-lived cells their own death ratek_death_LPC; neither is reported. Table S1 has a single plasma-cell death rate,k_death_PC= 0.1/day, described as applying to plasma cells in plasma and lymph node. Withk_death_LPC = k_death_PCthe two pools have identical kinetics and the antibodies depend only on their sum, so the model carries one poolPC = SPC + LPC(in lymph node and plasma) andPC_RATIOdrops out. A slower long-lived death rate would sustain the antibodies longer; across plausible values (1e-4 to 0.1/day) it moves the HBV DNA clearance time by about 4 days. This simplification is the most likely source of the remaining 2-4% gap to the paper’s clearance times.
The replication cut-off
Section 2.2 states that viral replication was considered negligible
when fewer than 1 hepatocyte was infected, without giving the form of
the threshold. It is encoded literally: HBV synthesis is switched off
while the whole-liver infected-cell count iHep_LV * V_LV is
below 1 cell (not latched). This matters only during the first day after
inoculation. After clearance a residual 0.05-1 infected cell/mL (tens to
hundreds of cells in the liver) persists, so the cut-off never fires
again: dendritic-cell and B-cell activation continue at a low level and
the antibodies plateau instead of declining after week 18 as in Figures
2, 3C and 3D. The alternative reading (switch off replication and remove
infected hepatocytes once fewer than 1 infected cell per mL remains
after the peak) reproduces the antibody peak near week 17 but collapses
the CD8+ plateau of Figure 3H by week 12, so no single reading
reproduces every published figure. The literal reading was kept.
Errata in the printed equations
Each of these was resolved by the homeostasis derivations in the table footnotes, by mass balance, or by the published figures:
-
Eq 25. The printed NK death term in plasma acts on
NK_LV; the Table S1 footnote 10 derivation ofksyn_NK((kdeath_NK + kPL_LV_NK) * NK_PL) requires it to act onNK_PL. -
Eq 37. The printed lymph-node efflux of activated
CTL acts on the liver pool
CTL*_LV; eq 27 receives it fromCTL*_LN, so mass balance requiresCTLa_LN. -
Eq 14. The printed death term for liver activated
CTL uses
k_death_CTL(0.102/day, the lymph-node precursor death rate that footnote 16 describes as including recirculation). The model usesk_death_CTL*(0.33/day, Table S1 “Natural death of CTL*“), as eq 27 and 37 do for the other activated-CTL pools. With 0.102/day the liver CTL expand faster, the HBV DNA peak falls to about 1.6e8 IU/mL (Figure 3A shows about 1e9) and the ALT peak to about 400 U/L (Figure 3E shows 1-3 IU/mL, i.e. 1000-3000 U/L). - Eq 8. As printed, the HBsAg inhibition multiplies only the pDC term, which leaves IFN-alpha flat near its 40 pg/mL baseline. Figure 3F shows IFN-alpha dipping to about 1 pg/mL; that requires the inhibition to multiply the whole synthesis (basal plus pDC), which is how it is encoded.
-
Eq 12. The printed equation has a separate basal
term
k_syn_IFNgamma, but Table S1 has no such row: footnote 5 derivesk_syn_IFNgamma_NK = kdeg_IFNg * IFNg_LV / NK*_LV= 0.00334, so all basal IFN-gamma production is carried by activated NK cells. -
Table S1 footnote 4 computes
kact_NKwith a slope of 0.0035 mL/pg, whereas the table givesSLP_IFNa_NK= 5.25 mL/pg. The tabulated pair (kact_NK= 1.82e-5/day with slope 5.25) is self-consistent at baseline and is used. -
Naming variants of a single parameter:
k_on_HBsAg/k_off_HBsAgin eq 31 arek_on_antiHBs/k_off_antiHBs;k_LN_PL_LPCandk_LN_LPL_PCin eq 30/47 arek_LN_PL_PC;k_rec_DCin eq 36 isk_rec_CTL;k_exh_CTL*is Table S1k_ex_CTL*;k_deg_complexHBsAgin eq 34 is Table S1k_deg_complexantiHBs. Eq 40/41 printDC50_CTL_prolfor B-cell activation; the model uses Table S1’sDC50_Bcell_prol, which has the same value (1 cell/mL).
Other conventions
-
CTL_LN(0)is set toksyn_CTL / kdeath_CTL= 9804 cell/mL, the definition in Table S2 footnote 35; the table prints it rounded to 1e4. - Table S2 lists ALT in “molec/mL”; Table S1 footnotes 8 and 32 and
Figure 3E use IU/mL, which is the unit used here (
ALT_UL= 1000 xALT_PL). - The IFN-alpha and IFN-gamma terms in eq 4 and 5 use the liver concentrations; plasma IFN levels are algebraic volume-scaled copies of the liver levels (eq 24, 26).
- The text gives the hepatocyte count as 2.4e11 cells in 1470 mL;
Table S1 gives
Hep_tot= 1.33e8 cell/mL (citing a different source), which is used. - All parameters are exposed as typical values without
fixed(), so they can be recalibrated; none was estimated in the usual statistical sense.
Session information
sessionInfo()
#> R version 4.6.2 (2026-10-29)
#> Platform: x86_64-pc-linux-gnu
#> Running under: Ubuntu 24.04.5 LTS
#>
#> Matrix products: default
#> BLAS:   /usr/lib/x86_64-linux-gnu/openblas-pthread/libblas.so.3
#> LAPACK: /usr/lib/x86_64-linux-gnu/openblas-pthread/libopenblasp-r0.3.26.so;  LAPACK version 3.12.0
#>
#> locale:
#>  [1] LC_CTYPE=C.UTF-8       LC_NUMERIC=C           LC_TIME=C.UTF-8
#>  [4] LC_COLLATE=C.UTF-8     LC_MONETARY=C.UTF-8    LC_MESSAGES=C.UTF-8
#>  [7] LC_PAPER=C.UTF-8       LC_NAME=C              LC_ADDRESS=C
#> [10] LC_TELEPHONE=C         LC_MEASUREMENT=C.UTF-8 LC_IDENTIFICATION=C
#>
#> time zone: UTC
#> tzcode source: system (glibc)
#>
#> attached base packages:
#> [1] stats     graphics  grDevices utils     datasets  methods   base
#>
#> other attached packages:
#> [1] ggplot2_4.0.3         tidyr_1.3.2           dplyr_1.2.1
#> [4] rxode2_5.1.8          nlmixr2lib_0.3.2.9000
#>
#> loaded via a namespace (and not attached):
#>  [1] generics_0.1.4      sass_0.4.10         xml2_1.6.0
#>  [4] digest_0.6.39       magrittr_2.0.5      RColorBrewer_1.1-3
#>  [7] evaluate_1.0.5      grid_4.6.2          fastmap_1.2.0
#> [10] lotri_1.0.5         jsonlite_2.0.0      whisker_0.4.1
#> [13] rxode2ll_2.0.18     backports_1.5.1     purrr_1.2.2
#> [16] scales_1.4.0        textshaping_1.0.5   jquerylib_0.1.4
#> [19] cli_3.6.6           crayon_1.5.3        symengine_0.2.14
#> [22] rlang_1.3.0         withr_3.0.3         cachem_1.1.0
#> [25] yaml_2.3.12         otel_0.2.0          tools_4.6.2
#> [28] parallel_4.6.2      memoise_2.0.1       checkmate_2.3.4
#> [31] rxode2lincmt_0.1.0  vctrs_0.7.3         R6_2.6.1
#> [34] lifecycle_1.0.5     fs_2.1.0            ragg_1.5.2
#> [37] PreciseSums_0.7     fontawesome_0.5.3   pkgconfig_2.0.3
#> [40] desc_1.4.3          rex_1.2.2           pkgdown_2.2.1
#> [43] pillar_1.11.1       bslib_0.12.0        gtable_0.3.6
#> [46] glue_1.8.1          data.table_1.18.6.1 Rcpp_1.1.2
#> [49] systemfonts_1.3.2   tidyselect_1.2.1    xfun_0.62
#> [52] tibble_3.3.1        sys_3.4.3           knitr_1.52
#> [55] farver_2.1.2        dparser_1.3.1-14    htmltools_0.5.9
#> [58] labeling_0.4.3      rmarkdown_2.32      compiler_4.6.2
#> [61] S7_0.2.2            downlit_0.4.5       askpass_1.2.1
#> [64] openssl_2.4.2