Creatinine-drug interactions in chronic kidney disease (Takita 2020)
Source:vignettes/articles/Takita_2020_creatinine.Rmd
Takita_2020_creatinine.RmdModel and source
- Citation: Takita H, Scotcher D, Chinnadurai R, Kalra PA, Galetin A. Physiologically-Based Pharmacokinetic Modelling of Creatinine-Drug Interactions in the Chronic Kidney Disease Population. CPT Pharmacometrics Syst Pharmacol. 2020;9(12):695-706.
- Article: https://doi.org/10.1002/psp4.12566 (open access, PMC7762809)
- Healthy-subject model being extended: Scotcher D et al. CPT Pharmacometrics Syst Pharmacol. 2020;9(6):310-321, https://doi.org/10.1002/psp4.12509
The authors deposited their MATLAB/Simulink implementation with the
Supporting Information (PSP4-9-695-s002.zip). The ODE
right-hand sides in the two model files were read off the block wiring
of the deposited Simulink diagrams
Creatinine_Inh_model_uptake.slx and
Creatinine_Inh_model_bidirectional.slx, and the system
parameters from DefineSystem.m,
ReabIVIVE_Freab.m and Run_simulation.m. The
CKD equations (Eqs S1-S16), the inhibitor PK parameters (Tables S6-S7,
NONMEM code in Text S1) and the transporter IC50 values (Table S8) come
from the Supplementary Material (PSP4-9-695-s001.docx).
The paper optimised two creatinine models independently, differing only in how creatinine crosses the basolateral membrane through OCT2, so they are packaged as two files:
mod_up <- readModelDb("Takita_2020_creatinine_uptakeOCT2")
mod_bi <- readModelDb("Takita_2020_creatinine_bidirectionalOCT2")
ui_up <- rxode2::rxode2(mod_up)
#> ℹ parameter labels from comments will be replaced by 'label()'
ui_bi <- rxode2::rxode2(mod_bi)
#> ℹ parameter labels from comments will be replaced by 'label()'
# The explicit ODEs must be integrated as written (no automatic linCmt()
# conversion of any sub-model).
stopifnot(is.null(ui_up$linCmt), is.null(ui_bi$linCmt))
Population
The creatinine model was optimised against baseline serum creatinine
in 64 patients with CKD stage G3-G4 from 8 clinical studies (35 G3, 29
G4; 31 men and 33 women; 22-88 years; body weight 44-96 kg; Table 1),
and verified against 42 further CKD patients (Table S8). Creatinine-drug
interactions were evaluated in 12 studies (90 CKD G3-4 patients) with
trimethoprim, cimetidine and famotidine, including 17 patients from the
Salford Kidney Study (UK) who received 100-200 mg/day trimethoprim
prophylaxis. The inhibitor PK models were fitted to published
concentration-time data in CKD patients (Table 3): trimethoprim by
NONMEM to 9 patients (Rieder 1974), cimetidine and famotidine by naive
pooling of mean profiles. The same information is available
programmatically as ui_up$population.
Model structure
For each patient the covariates CRCL (BSA-normalised
eGFR, mL/min/1.73 m^2), BSA, WT,
AGE and SEXF set the CKD-specific system
parameters (Supplementary Section S4):
- absolute GFR =
CRCL * BSA / 1.73(the depositedeGFR_BSAcolumn); - creatinine synthesis
R_SYN = (C0 - C1 * AGE) * WT / 24(Eq S5); - proximal-tubule volumes, passive permeability and the filtrate flow
out of the proximal tubule scale with
GFR / 125 mL/min(Eq S6, intact nephron hypothesis); the distal fraction reabsorbed is then unchanged (Eqs S7-S8); - renal blood flow is reduced by 27% (G3) or 42% (G4 and below);
- transporter clearances follow the non-INH scenario:
OAT2 declines by the GFR ratio times
Fx_OAT2(Eqs S9-S10), OCT2 and MATE decline linearly with slopeCoeff_CKD,TP(Eq S11). The INH scenario (all transporters in proportion to GFR) is recovered by settingcoeff_ckd_tp = 1,fx_oat2_slope = 0andfx_oat2_int = 1.
Creatinine occupies five states: central_creatinine, the
proximal-tubule peritubular blood and interstitium
(pt_blood), the tubular cell (pt_cell), the
tubular filtrate (pt_filtrate) and the cumulative urine
(urine_creatinine). Inhibitor unbound plasma concentrations
reduce each transporter’s intrinsic clearance by
1 / (1 + Cu / IC50) (Eq S13). The creatinine states start
at their analytic steady state, so pct_change_scr is the
percent change from the patient’s own pre-dose baseline.
# The INH scenario of Takita 2020: transporter activity proportional to GFR.
as_inh <- function(ui) {
  suppressMessages(rxode2::ini(ui, coeff_ckd_tp = 1, fx_oat2_slope = 0, fx_oat2_int = 1))
}
scenarios <- list(
  "Uptake-OCT2, non-INH" = ui_up,
  "Uptake-OCT2, INH" = as_inh(ui_up),
  "Bidirectional-OCT2, non-INH" = ui_bi,
  "Bidirectional-OCT2, INH" = as_inh(ui_bi)
)
scenarios_typ <- lapply(scenarios, rxode2::zeroRe)
Source trace
| Equation / parameter | Value | Source location |
|---|---|---|
ODEs for central_creatinine, pt_blood,
pt_cell, pt_filtrate,
urine_creatinine
|
n/a | Block wiring of Creatinine_Inh_model_uptake.slx /
Creatinine_Inh_model_bidirectional.slx (Figure 1a) |
Bidirectional OCT2 flux
CL * GHK * (f_cat,b * C_b - f_cat,c * exp(phi) * C_cell)
|
n/a |
Creatinine_Inh_model_bidirectional.slx blocks
z, Mem_Pot, F, R,
T, pH_ptc
|
gfr_healthy |
7.5 L/h | Table 2; Eq S6 (125 mL/min) |
vd_creatinine, cl_nr_creatinine
|
43.7 L, 0.17 L/h | DefineSystem.m |
q_pt_healthy, v_ptbi_healthy,
v_ptc_healthy, v_ptfilt_healthy
|
58.449 L/h, 0.08176, 0.066076, 0.053529 L |
DefineSystem.m; Table 2 healthy column |
f_qr_g3, f_qr_g4
|
0.73, 0.58 | Methods (27% / 42% reduction); CKDdata.xlsx
|
f_reab_water |
0.64 |
DefineSystem.m; Section S7 |
pka_creatinine, ph_blood,
ph_ptc, em_ptc
|
4.74, 7.4, 7.2, -0.07 V |
Run_simulation.m, DefineSystem.m
|
papp_creatinine |
28.87 (uptake) / 14.01 (bidirectional) x 1e-6 cm/s | Run_simulation.m |
sa_pt, sa_loh, sa_dt,
sa_cd, q_loh, q_dt,
q_cd, f_transcellular
|
see file | ReabIVIVE_Freab.m |
rsyn_c0_*, rsyn_c1_*
|
27 / 0.173 (men), 25 / 0.175 (women) | Eq S5 |
clint_*_healthy |
see file |
Run_simulation.m Optim_list.CLint; Table 2
healthy column |
fx_oat2_slope, fx_oat2_int
|
0.4973, 0.5027 | Eq S9 |
coeff_ckd_tp |
0.8763 (uptake) / 0.7046 (bidirectional) |
Run_simulation.m; Results (0.88 / 0.70) |
Trimethoprim lcl, lvc, lka,
e_wt_cl, e_wt_vc
|
5.07 L/h, 105 L, 1.24 1/h, 0.822, 0.532 | Table S7; Text S1 |
| Trimethoprim IIV (CL, V, ka) and residual | 0.0552, 0.0157, 0.0817; proportional variance 0.00722 | Text S1 $OMEGA; Table S7 |
Cimetidine CL, V2, ka,
Q, V3, F
|
27.30, 35.60, 0.23, 38.80, 39.30, 1 | Table S6 |
Famotidine CL, V2, ka,
Q, V3, F
|
2.61, 24.19, 0.44, 74.24, 46.67, 0.47 | Table S6 |
fu_* |
0.51, 0.84, 0.72 | Table S6 |
ic50_* |
see file | Table S8 |
clr_slope_*, clr_int_*
(Kp,uu,filtrate) |
see file | Figures S13A, S14A, S15A; Eqs S14-S16 |
mw_trimethoprim |
290.32 g/mol | Drug_info_S.mat |
mw_cimetidine, mw_famotidine
|
252.34, 337.44 g/mol | Molecular formulae (not printed in the source) |
Covariate-derived quantities match the deposited patient file
The deposited CKDdata.xlsx lists, for the CKD patients
of Myre 1987 and Tasker 1975, the creatinine synthesis rate, absolute
GFR, trimethoprim CL and V and Kp,uu,filtrate that the
authors computed. The 15 patients the paper used for evaluation (the
exclusion == 0 rows) are reproduced below; the model’s own
derived variables must agree with every column.
patients <- tibble::tribble(
  ~study, ~pid, ~AGE, ~SEX, ~WT, ~BSA, ~CRCL, ~scr_obs, ~pct_obs, ~rsyn_dep, ~gfr_dep, ~cl_dep, ~vd_dep, ~kpuu_dep,
  1, 1, 45, 1, 77.30000, 1.894714, 17.45892, 3.90, 66.700000, 61.8883, 1.14727, 5.500737, 110.69006, 8.406402,
  1, 2, 37, 0, 65.90000, 1.708503, 17.62326, 3.20, 7.800000, 50.8666, 1.04426, 4.824599, 101.68202, 9.269247,
  1, 3, 50, 1, 53.60000, 1.621670, 22.69040, 3.05, 45.900000, 40.9817, 1.27617, 4.071091, 91.09883, 8.431424,
  1, 4, 43, 0, 78.60000, 1.834928, 22.77187, 2.50, 48.000000, 57.2306, 1.44918, 5.576667, 111.67654, 7.436842,
  1, 7, 57, 0, 80.90000, 1.842279, 15.31339, 3.20, -3.100000, 50.6468, 0.97843, 5.710459, 113.40332, 9.389410,
  2, 4, 71, 0, 60.39051, 1.613468, 32.08529, 1.60, 18.750000, 31.6421, 1.79544, 4.490489, 97.06720, 7.108712,
  2, 5, 68, 1, 76.53897, 1.886764, 35.43514, 1.90, -5.263158, 48.5895, 2.31877, 5.456182, 110.10897, 5.812399,
  2, 9, 80, 1, 76.53897, 1.886764, 47.11611, 1.40, 28.571429, 41.9689, 3.08313, 5.456182, 110.10897, 5.179274,
  2, 10, 70, 1, 76.53897, 1.886764, 37.30107, 1.80, 11.111111, 47.4861, 2.44087, 5.456182, 110.10897, 5.684651,
  2, 15, 76, 1, 76.53897, 1.886764, 26.58963, 2.30, 17.391304, 44.1757, 1.73994, 5.456182, 110.10897, 6.661952,
  2, 18, 34, 1, 76.53897, 1.886764, 30.79427, 2.60, 100.000000, 67.3479, 2.01508, 5.456182, 110.10897, 6.197264,
  3, 1, 78, 0, 59.94911, 1.601682, 23.32311, 2.00, 40.000000, 28.3509, 1.29559, 4.463492, 96.68911, 8.409195,
  3, 2, 61, 0, 61.02673, 1.630388, 22.19554, 2.30, -13.043478, 36.4253, 1.25505, 4.529340, 97.60989, 8.489244,
  3, 8, 47, 0, 61.92872, 1.654237, 22.14092, 2.50, 0.000000, 43.2856, 1.27028, 4.584296, 98.37477, 8.378322,
  3, 14, 50, 0, 61.73432, 1.649111, 22.77600, 2.40, 0.000000, 41.7993, 1.30266, 4.572464, 98.21037, 8.273980
) |>
  mutate(
    id = row_number(),
    # Source column 'SEX(M1F0)' is 1 = male
    SEXF = 1 - SEX,
    study_name = c("Myre 1987", "Tasker 1975 group 1", "Tasker 1975 group 2")[study]
  )

# Every subject carries a record after time 0: a subject whose only record is
# at time 0 does not get the covariate-dependent initial conditions applied in
# a multi-subject rxSolve().
ev_cov <- patients |>
  select(id, CRCL, BSA, WT, AGE, SEXF) |>
  tidyr::crossing(time = c(0, 1)) |>
  mutate(evid = 0, amt = 0, cmt = "central_creatinine")
chk <- rxode2::rxSolve(scenarios_typ[["Uptake-OCT2, non-INH"]], ev_cov,
  returnType = "data.frame"
) |>
  filter(time == 0) |>
  left_join(patients |> select(id, rsyn_dep, gfr_dep, cl_dep, vd_dep, kpuu_dep), by = "id")
#> ℹ omega/sigma items treated as zero: 'etalcl_trimethoprim', 'etalvc_trimethoprim', 'etalka_trimethoprim'
#> Warning: multi-subject simulation without without 'omega'

rel <- function(x, y) abs(x / y - 1)
stopifnot(
  max(rel(chk$rsyn, chk$rsyn_dep)) < 1e-5,
  max(rel(chk$gfr, chk$gfr_dep)) < 1e-5,
  max(rel(chk$cl_trimethoprim, chk$cl_dep)) < 1e-5,
  max(rel(chk$vc_trimethoprim, chk$vd_dep)) < 1e-5,
  max(rel(chk$kpuu_trimethoprim, chk$kpuu_dep)) < 1e-4
)
All five derived quantities agree with the deposited values to within the rounding of the spreadsheet, for all 15 patients.
Table 2: system parameters in healthy subjects and in CKD
Table 2 prints each system parameter for a healthy subject (GFR 125 mL/min) and for a 65-year-old man of 70 kg with GFR 15 mL/min under both transporter scenarios. The model’s derived variables are evaluated for those two subjects and compared against every printed value, at the precision it is printed.
ref_subjects <- tibble::tibble(
  id = 1:2, subject = c("healthy", "CKD"),
  CRCL = c(125, 15), BSA = 1.73, WT = 70, AGE = 65, SEXF = 0
)
ev_ref <- ref_subjects |>
  select(-subject) |>
  tidyr::crossing(time = c(0, 1)) |>
  mutate(evid = 0, amt = 0, cmt = "central_creatinine")

derived <- bind_rows(lapply(names(scenarios_typ), function(sc) {
  rxode2::rxSolve(scenarios_typ[[sc]], ev_ref, returnType = "data.frame") |>
    filter(time == 0) |>
    transmute(
      scenario = sc, subject = ref_subjects$subject[id],
      GFR = gfr, Q_PT_blood = q_pt, R_SYN = rsyn,
      V_PT_bi = v_ptbi, V_PT_cell = v_ptc, V_PT_filt = v_ptfilt, Q_PT_U_filt = q_ptdt,
      CL_PD_trans = clpd_mem, CL_PD_para = clpd_para,
      CL_int_OAT2 = clint_oat2, CL_int_OCT2 = clint_oct2 * f_cation_blood,
      CL_int_MATE1 = clint_mate1, CL_int_MATE2K = clint_mate2k
    )
})) |>
  tidyr::pivot_longer(-c(scenario, subject), names_to = "parameter", values_to = "model")
#> ℹ omega/sigma items treated as zero: 'etalcl_trimethoprim', 'etalvc_trimethoprim', 'etalka_trimethoprim'
#> Warning: multi-subject simulation without without 'omega'
#> ℹ omega/sigma items treated as zero: 'etalcl_trimethoprim', 'etalvc_trimethoprim', 'etalka_trimethoprim'
#> Warning: multi-subject simulation without without 'omega'
#> ℹ omega/sigma items treated as zero: 'etalcl_trimethoprim', 'etalvc_trimethoprim', 'etalka_trimethoprim'
#> Warning: multi-subject simulation without without 'omega'
#> ℹ omega/sigma items treated as zero: 'etalcl_trimethoprim', 'etalvc_trimethoprim', 'etalka_trimethoprim'
#> Warning: multi-subject simulation without without 'omega'

# Table 2 as printed. OCT2 is printed as the clearance of total creatinine
# (the cationic-species clearance times the cationic fraction at pH 7.4).
printed <- tibble::tribble(
  ~subject, ~model_class, ~scen, ~parameter, ~printed, ~digits,
  "healthy", "both", "both", "GFR", 7.5, 1,
  "healthy", "both", "both", "Q_PT_blood", 58, 0,
  "healthy", "both", "both", "V_PT_bi", 0.082, 3,
  "healthy", "both", "both", "V_PT_cell", 0.066, 3,
  "healthy", "both", "both", "V_PT_filt", 0.054, 3,
  "healthy", "both", "both", "Q_PT_U_filt", 2.7, 1,
  "healthy", "Uptake", "both", "CL_PD_trans", 0.89, 2,
  "healthy", "Bidirectional", "both", "CL_PD_trans", 0.43, 2,
  "healthy", "Uptake", "both", "CL_PD_para", 5.9, 1,
  "healthy", "Bidirectional", "both", "CL_PD_para", 2.9, 1,
  "healthy", "Uptake", "both", "CL_int_OAT2", 20.8, 1,
  "healthy", "Bidirectional", "both", "CL_int_OAT2", 21.5, 1,
  "healthy", "Uptake", "both", "CL_int_OCT2", 23.9, 1,
  "healthy", "Bidirectional", "both", "CL_int_OCT2", 8.75, 2,
  "healthy", "Uptake", "both", "CL_int_MATE1", 0.16, 2,
  "healthy", "Bidirectional", "both", "CL_int_MATE1", 0.16, 2,
  "healthy", "Uptake", "both", "CL_int_MATE2K", 0.51, 2,
  "healthy", "Bidirectional", "both", "CL_int_MATE2K", 0.53, 2,
  "CKD", "both", "both", "GFR", 0.9, 1,
  "CKD", "both", "both", "Q_PT_blood", 34, 0,
  "CKD", "both", "both", "R_SYN", 46, 0,
  "CKD", "both", "both", "V_PT_bi", 0.0098, 4,
  "CKD", "both", "both", "V_PT_cell", 0.0079, 4,
  "CKD", "both", "both", "V_PT_filt", 0.0064, 4,
  "CKD", "both", "both", "Q_PT_U_filt", 0.3, 1,
  "CKD", "Uptake", "both", "CL_PD_trans", 0.11, 2,
  "CKD", "Bidirectional", "both", "CL_PD_trans", 0.052, 3,
  "CKD", "Uptake", "both", "CL_PD_para", 0.71, 2,
  "CKD", "Bidirectional", "both", "CL_PD_para", 0.34, 2,
  "CKD", "Uptake", "INH", "CL_int_OAT2", 2.49, 2,
  "CKD", "Bidirectional", "INH", "CL_int_OAT2", 2.58, 2,
  "CKD", "Uptake", "non-INH", "CL_int_OAT2", 1.40, 2,
  "CKD", "Bidirectional", "non-INH", "CL_int_OAT2", 1.45, 2,
  "CKD", "Uptake", "INH", "CL_int_OCT2", 2.87, 2,
  "CKD", "Bidirectional", "INH", "CL_int_OCT2", 1.05, 2,
  "CKD", "Uptake", "non-INH", "CL_int_OCT2", 5.47, 2,
  "CKD", "Bidirectional", "non-INH", "CL_int_OCT2", 3.33, 2,
  "CKD", "Uptake", "INH", "CL_int_MATE1", 0.019, 3,
  "CKD", "Bidirectional", "INH", "CL_int_MATE1", 0.019, 3,
  "CKD", "Uptake", "non-INH", "CL_int_MATE1", 0.036, 3,
  "CKD", "Bidirectional", "non-INH", "CL_int_MATE1", 0.062, 3,
  "CKD", "Uptake", "INH", "CL_int_MATE2K", 0.061, 3,
  "CKD", "Bidirectional", "INH", "CL_int_MATE2K", 0.063, 3,
  "CKD", "Uptake", "non-INH", "CL_int_MATE2K", 0.117, 3,
  "CKD", "Bidirectional", "non-INH", "CL_int_MATE2K", 0.200, 3
)

table2 <- derived |>
  mutate(
    model_class = sub("-OCT2.*", "", scenario),
    scen = sub(".*, ", "", scenario)
  ) |>
  inner_join(printed, by = c("subject", "parameter"), relationship = "many-to-many") |>
  filter(
    model_class.y == "both" | model_class.y == model_class.x,
    scen.y == "both" | scen.y == scen.x
  ) |>
  mutate(rounded = round(model, digits), match = abs(rounded - printed) < 1e-9)

# 25 printed values apply to each of the 4 model/scenario combinations
stopifnot(nrow(table2) == 100, all(table2$match))

table2 |>
  filter(scen.y != "both" | scen.x == "non-INH") |>
  distinct(subject, model_class.x, scen.y, parameter, printed, model) |>
  arrange(subject, parameter, model_class.x) |>
  mutate(model = signif(model, 4)) |>
  dplyr::rename(
    "Subject" = subject, "OCT2 model" = model_class.x, "Scenario" = scen.y,
    "Parameter" = parameter, "Table 2" = printed, "Model" = model
  ) |>
knitr::kable(caption = "Table 2 of Takita 2020 reproduced from the packaged models ('both' = same value in both scenarios).")| Subject | OCT2 model | Scenario | Parameter | Table 2 | Model |
|---|---|---|---|---|---|
| CKD | Bidirectional | both | CL_PD_para | 0.3400 | 0.343800 |
| CKD | Uptake | both | CL_PD_para | 0.7100 | 0.708400 |
| CKD | Bidirectional | both | CL_PD_trans | 0.0520 | 0.051750 |
| CKD | Uptake | both | CL_PD_trans | 0.1100 | 0.106600 |
| CKD | Bidirectional | non-INH | CL_int_MATE1 | 0.0620 | 0.061550 |
| CKD | Bidirectional | INH | CL_int_MATE1 | 0.0190 | 0.019440 |
| CKD | Uptake | non-INH | CL_int_MATE1 | 0.0360 | 0.035930 |
| CKD | Uptake | INH | CL_int_MATE1 | 0.0190 | 0.018840 |
| CKD | Bidirectional | non-INH | CL_int_MATE2K | 0.2000 | 0.200200 |
| CKD | Bidirectional | INH | CL_int_MATE2K | 0.0630 | 0.063240 |
| CKD | Uptake | non-INH | CL_int_MATE2K | 0.1170 | 0.116700 |
| CKD | Uptake | INH | CL_int_MATE2K | 0.0610 | 0.061200 |
| CKD | Bidirectional | non-INH | CL_int_OAT2 | 1.4500 | 1.450000 |
| CKD | Bidirectional | INH | CL_int_OAT2 | 2.5800 | 2.578000 |
| CKD | Uptake | non-INH | CL_int_OAT2 | 1.4000 | 1.402000 |
| CKD | Uptake | INH | CL_int_OAT2 | 2.4900 | 2.493000 |
| CKD | Bidirectional | non-INH | CL_int_OCT2 | 3.3300 | 3.326000 |
| CKD | Bidirectional | INH | CL_int_OCT2 | 1.0500 | 1.050000 |
| CKD | Uptake | non-INH | CL_int_OCT2 | 5.4700 | 5.471000 |
| CKD | Uptake | INH | CL_int_OCT2 | 2.8700 | 2.868000 |
| CKD | Bidirectional | both | GFR | 0.9000 | 0.900000 |
| CKD | Uptake | both | GFR | 0.9000 | 0.900000 |
| CKD | Bidirectional | both | Q_PT_U_filt | 0.3000 | 0.324000 |
| CKD | Uptake | both | Q_PT_U_filt | 0.3000 | 0.324000 |
| CKD | Bidirectional | both | Q_PT_blood | 34.0000 | 33.900000 |
| CKD | Uptake | both | Q_PT_blood | 34.0000 | 33.900000 |
| CKD | Bidirectional | both | R_SYN | 46.0000 | 45.950000 |
| CKD | Uptake | both | R_SYN | 46.0000 | 45.950000 |
| CKD | Bidirectional | both | V_PT_bi | 0.0098 | 0.009811 |
| CKD | Uptake | both | V_PT_bi | 0.0098 | 0.009811 |
| CKD | Bidirectional | both | V_PT_cell | 0.0079 | 0.007929 |
| CKD | Uptake | both | V_PT_cell | 0.0079 | 0.007929 |
| CKD | Bidirectional | both | V_PT_filt | 0.0064 | 0.006423 |
| CKD | Uptake | both | V_PT_filt | 0.0064 | 0.006423 |
| healthy | Bidirectional | both | CL_PD_para | 2.9000 | 2.865000 |
| healthy | Uptake | both | CL_PD_para | 5.9000 | 5.903000 |
| healthy | Bidirectional | both | CL_PD_trans | 0.4300 | 0.431200 |
| healthy | Uptake | both | CL_PD_trans | 0.8900 | 0.888600 |
| healthy | Bidirectional | both | CL_int_MATE1 | 0.1600 | 0.162000 |
| healthy | Uptake | both | CL_int_MATE1 | 0.1600 | 0.157000 |
| healthy | Bidirectional | both | CL_int_MATE2K | 0.5300 | 0.527000 |
| healthy | Uptake | both | CL_int_MATE2K | 0.5100 | 0.510000 |
| healthy | Bidirectional | both | CL_int_OAT2 | 21.5000 | 21.490000 |
| healthy | Uptake | both | CL_int_OAT2 | 20.8000 | 20.770000 |
| healthy | Bidirectional | both | CL_int_OCT2 | 8.7500 | 8.752000 |
| healthy | Uptake | both | CL_int_OCT2 | 23.9000 | 23.900000 |
| healthy | Bidirectional | both | GFR | 7.5000 | 7.500000 |
| healthy | Uptake | both | GFR | 7.5000 | 7.500000 |
| healthy | Bidirectional | both | Q_PT_U_filt | 2.7000 | 2.700000 |
| healthy | Uptake | both | Q_PT_U_filt | 2.7000 | 2.700000 |
| healthy | Bidirectional | both | Q_PT_blood | 58.0000 | 58.450000 |
| healthy | Uptake | both | Q_PT_blood | 58.0000 | 58.450000 |
| healthy | Bidirectional | both | V_PT_bi | 0.0820 | 0.081760 |
| healthy | Uptake | both | V_PT_bi | 0.0820 | 0.081760 |
| healthy | Bidirectional | both | V_PT_cell | 0.0660 | 0.066080 |
| healthy | Uptake | both | V_PT_cell | 0.0660 | 0.066080 |
| healthy | Bidirectional | both | V_PT_filt | 0.0540 | 0.053530 |
| healthy | Uptake | both | V_PT_filt | 0.0540 | 0.053530 |
All 100 comparisons (each printed value against every model and scenario it applies to) agree after rounding the model value to the printed precision. The healthy-subject creatinine synthesis rate of Table 2 (71 mg/h) is the young-adult-man value of the healthy model and is not produced by Eq S5, so it is not compared.
Steady state and mass balance
With no inhibitor the creatinine system must stay at its analytic starting point, and at steady state the synthesis rate must equal non-renal plus urinary elimination. Both checks compare the solve against its own parameters, so the bound is numerical error only.
ev_ss <- patients |>
  select(id, CRCL, BSA, WT, AGE, SEXF) |>
  tidyr::crossing(time = c(0, 100, 500)) |>
  mutate(evid = 0, amt = 0, cmt = "central_creatinine")
ss <- bind_rows(lapply(names(scenarios_typ), function(sc) {
  rxode2::rxSolve(scenarios_typ[[sc]], ev_ss,
    returnType = "data.frame",
    rtol = 1e-10, atol = 1e-12
  ) |> mutate(scenario = sc)
}))
#> ℹ omega/sigma items treated as zero: 'etalcl_trimethoprim', 'etalvc_trimethoprim', 'etalka_trimethoprim'
#> Warning: multi-subject simulation without without 'omega'
#> ℹ omega/sigma items treated as zero: 'etalcl_trimethoprim', 'etalvc_trimethoprim', 'etalka_trimethoprim'
#> Warning: multi-subject simulation without without 'omega'
#> ℹ omega/sigma items treated as zero: 'etalcl_trimethoprim', 'etalvc_trimethoprim', 'etalka_trimethoprim'
#> Warning: multi-subject simulation without without 'omega'
#> ℹ omega/sigma items treated as zero: 'etalcl_trimethoprim', 'etalvc_trimethoprim', 'etalka_trimethoprim'
#> Warning: multi-subject simulation without without 'omega'
# Non-renal clearance is a fixed ini() value, not a column of the solve
cl_nr <- ui_up$iniDf$est[ui_up$iniDf$name == "cl_nr_creatinine"]
ss_check <- ss |>
  group_by(scenario, id) |>
  summarise(
    drift = max(abs(Cc_creatinine / first(Cc_creatinine) - 1)),
    balance = abs((cl_nr * first(Cc_creatinine) +
      first(clr_creatinine) * first(Cc_creatinine)) / first(rsyn) - 1),
    .groups = "drop"
  )
stopifnot(max(ss_check$drift) < 1e-6, max(ss_check$balance) < 1e-8)
Figure 3: baseline serum creatinine and CCr/GFR
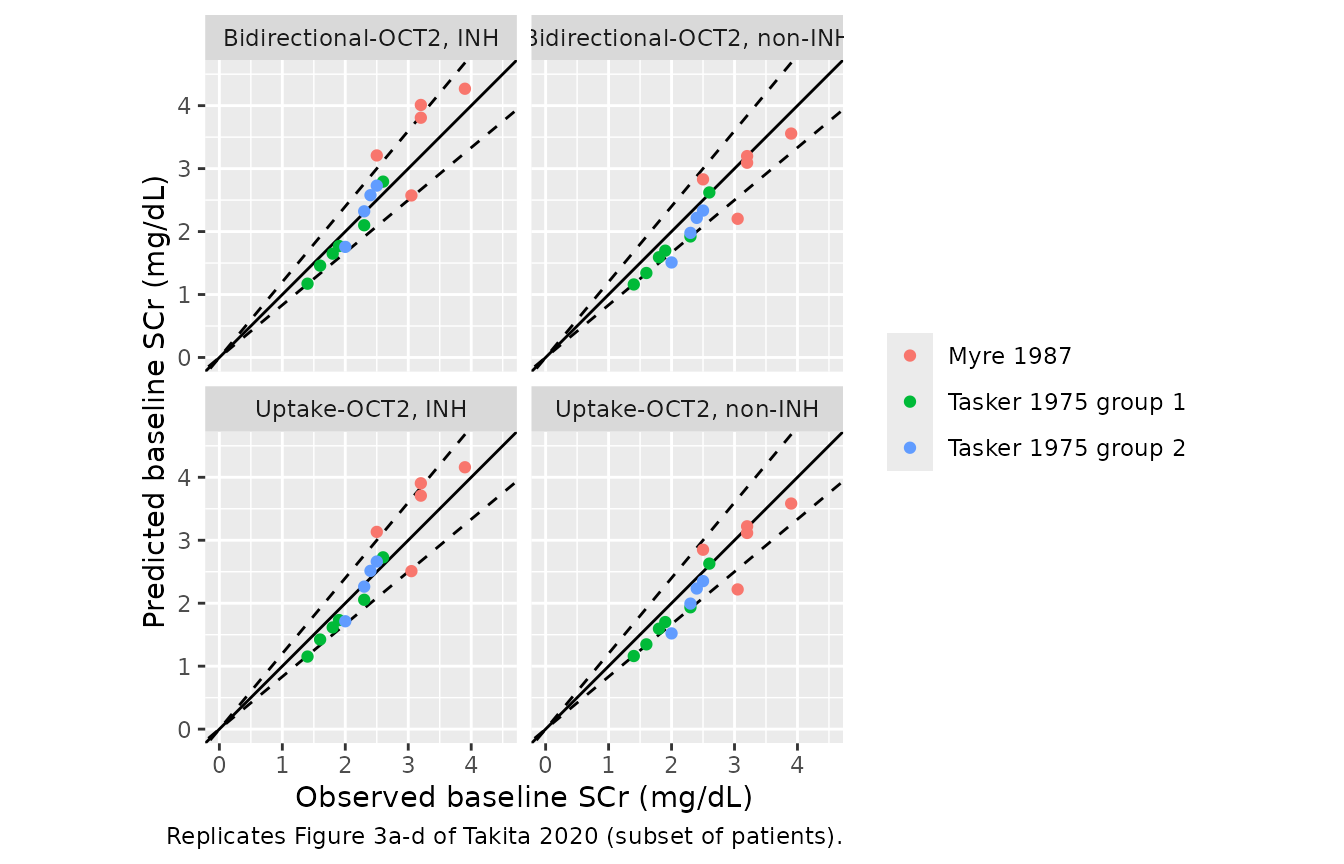
Baseline serum creatinine (Figure 3a-d)
Figure 3a-d compares predicted with observed baseline serum creatinine for the 64 CKD patients of the 8 optimisation studies. Only the 15 Myre 1987 and Tasker 1975 patients in the deposited file have individual covariates available here; they form a subset of the 64.
base <- bind_rows(lapply(names(scenarios_typ), function(sc) {
  rxode2::rxSolve(scenarios_typ[[sc]], ev_cov, returnType = "data.frame") |>
    filter(time == 0) |>
    mutate(scenario = sc)
})) |>
  left_join(patients |> select(id, scr_obs, study_name), by = "id")
#> ℹ omega/sigma items treated as zero: 'etalcl_trimethoprim', 'etalvc_trimethoprim', 'etalka_trimethoprim'
#> Warning: multi-subject simulation without without 'omega'
#> ℹ omega/sigma items treated as zero: 'etalcl_trimethoprim', 'etalvc_trimethoprim', 'etalka_trimethoprim'
#> Warning: multi-subject simulation without without 'omega'
#> ℹ omega/sigma items treated as zero: 'etalcl_trimethoprim', 'etalvc_trimethoprim', 'etalka_trimethoprim'
#> Warning: multi-subject simulation without without 'omega'
#> ℹ omega/sigma items treated as zero: 'etalcl_trimethoprim', 'etalvc_trimethoprim', 'etalka_trimethoprim'
#> Warning: multi-subject simulation without without 'omega'

gmfe <- base |>
  group_by(scenario) |>
  summarise(gmfe = exp(mean(abs(log(scr / scr_obs)))), .groups = "drop")
knitr::kable(gmfe, digits = 3, caption = "Geometric mean fold-error of baseline serum creatinine, 15 deposited patients.")| scenario | gmfe |
|---|---|
| Bidirectional-OCT2, INH | 1.127 |
| Bidirectional-OCT2, non-INH | 1.138 |
| Uptake-OCT2, INH | 1.126 |
| Uptake-OCT2, non-INH | 1.134 |
# The paper's acceptance criterion for a creatinine CKD model is gmfe < 1.15
# (reported 1.11-1.13 over all 64 patients). The model is deterministic, so
# this does not depend on any random draw.
stopifnot(all(gmfe$gmfe < 1.15))

ggplot(base, aes(scr_obs, scr, colour = study_name)) +
  geom_abline(slope = 1, intercept = 0) +
  geom_abline(slope = c(1.2, 1 / 1.2), intercept = 0, linetype = "dashed") +
  geom_point() +
  facet_wrap(~scenario) +
  coord_equal(xlim = c(0, 4.5), ylim = c(0, 4.5)) +
  labs(
    x = "Observed baseline SCr (mg/dL)", y = "Predicted baseline SCr (mg/dL)",
    colour = NULL, caption = "Replicates Figure 3a-d of Takita 2020 (subset of patients)."
  )
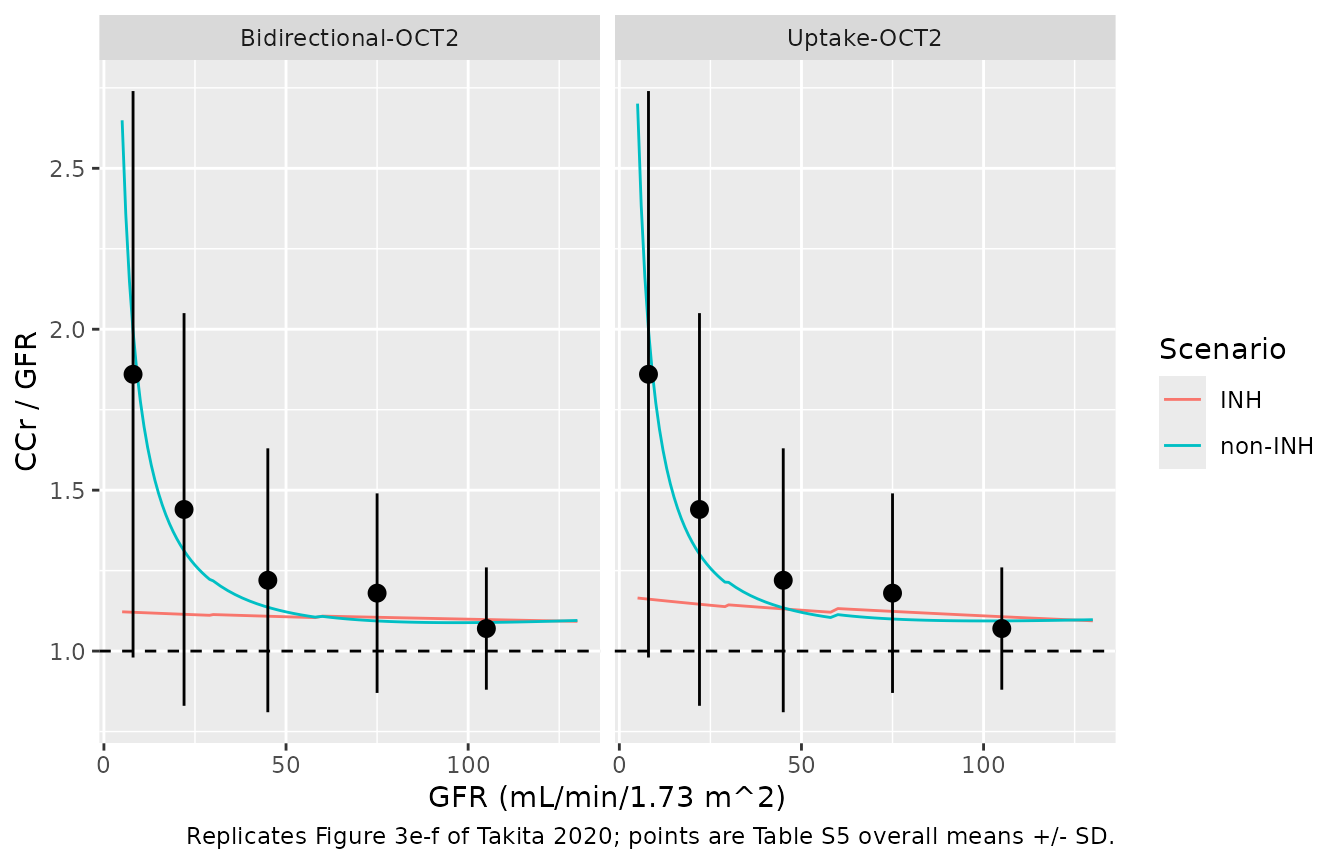
CCr/GFR against GFR (Figure 3e-f)
The motivation for the non-INH scenario is the rise of the creatinine clearance to GFR ratio as CKD progresses. The overall means per CKD stage from Table S5 are shown at stage mid-points (the paper plots them at each stage’s mean GFR, which is not tabulated).
gfr_grid <- c(seq(5, 30, by = 1), seq(32, 130, by = 2))
ev_grid <- tibble::tibble(id = seq_along(gfr_grid), CRCL = gfr_grid, BSA = 1.73, WT = 70, AGE = 50, SEXF = 0) |>
  tidyr::crossing(time = c(0, 1)) |>
  mutate(evid = 0, amt = 0, cmt = "central_creatinine")
ratio <- bind_rows(lapply(names(scenarios_typ), function(sc) {
  rxode2::rxSolve(scenarios_typ[[sc]], ev_grid, returnType = "data.frame") |>
    filter(time == 0) |>
    mutate(scenario = sc, GFR = gfr_grid[id])
})) |>
  mutate(
    model_class = sub(",.*", "", scenario),
    scen = sub(".*, ", "", scenario)
  )
#> ℹ omega/sigma items treated as zero: 'etalcl_trimethoprim', 'etalvc_trimethoprim', 'etalka_trimethoprim'
#> Warning: multi-subject simulation without without 'omega'
#> ℹ omega/sigma items treated as zero: 'etalcl_trimethoprim', 'etalvc_trimethoprim', 'etalka_trimethoprim'
#> Warning: multi-subject simulation without without 'omega'
#> ℹ omega/sigma items treated as zero: 'etalcl_trimethoprim', 'etalvc_trimethoprim', 'etalka_trimethoprim'
#> Warning: multi-subject simulation without without 'omega'
#> ℹ omega/sigma items treated as zero: 'etalcl_trimethoprim', 'etalvc_trimethoprim', 'etalka_trimethoprim'
#> Warning: multi-subject simulation without without 'omega'
table_s5 <- tibble::tibble(
  stage = c("G1", "G2", "G3", "G4", "G5"),
  GFR = c(105, 75, 45, 22, 8),
  ratio = c(1.07, 1.18, 1.22, 1.44, 1.86),
  sd = c(0.19, 0.31, 0.41, 0.61, 0.88)
)

ggplot(ratio, aes(GFR, ccr_gfr_ratio, colour = scen)) +
  geom_line() +
  geom_pointrange(
    data = table_s5, aes(GFR, ratio, ymin = ratio - sd, ymax = ratio + sd),
    inherit.aes = FALSE
  ) +
  geom_hline(yintercept = 1, linetype = "dashed") +
  facet_wrap(~model_class) +
  labs(
    x = "GFR (mL/min/1.73 m^2)", y = "CCr / GFR", colour = "Scenario",
    caption = "Replicates Figure 3e-f of Takita 2020; points are Table S5 overall means +/- SD."
  )
at <- function(sc, g) ratio$ccr_gfr_ratio[ratio$scenario == sc & ratio$GFR == g]
stopifnot(
  # Non-INH recovers the stage means it was fitted to (within 15% for G3-G5)
  abs(at("Uptake-OCT2, non-INH", 44) / 1.22 - 1) < 0.15,
  abs(at("Uptake-OCT2, non-INH", 22) / 1.44 - 1) < 0.15,
  abs(at("Uptake-OCT2, non-INH", 8) / 1.86 - 1) < 0.15,
  abs(at("Bidirectional-OCT2, non-INH", 44) / 1.22 - 1) < 0.15,
  abs(at("Bidirectional-OCT2, non-INH", 22) / 1.44 - 1) < 0.15,
  abs(at("Bidirectional-OCT2, non-INH", 8) / 1.86 - 1) < 0.15,
  # INH underestimates the ratio in advanced CKD (Results, Figure 3e-f)
  at("Uptake-OCT2, INH", 8) < 1.25,
  at("Bidirectional-OCT2, INH", 8) < 1.25
)
Figure 4: creatinine-trimethoprim interactions
The deposited code simulates the three trimethoprim studies with individual covariates: Myre 1987 (100 mg twice daily, sampled 2-4 h after the day-10 morning dose), and Tasker 1975 group 1 (160 mg twice daily) and group 2 (160 mg twice daily for 3 days then once daily), sampled on days 6-10. As in the paper, the predicted interaction is the maximum percent change in serum creatinine within the sampling window, trimethoprim PK uses each patient’s typical (weight-scaled) parameters, and the unbound plasma concentration inhibits all four transporters.
dose_tab <- list(
  `1` = tibble::tibble(time = seq(0, 240, by = 12), amt = 100),
  `2` = tibble::tibble(time = seq(0, 228, by = 12), amt = 160),
  `3` = tibble::tibble(time = c(seq(0, 72, by = 12), seq(96, 216, by = 24)), amt = 160)
)
window <- tibble::tibble(study = 1:3, t_start = c(218, 120, 120), t_end = c(220, 216, 216))

ev_tmp <- bind_rows(lapply(seq_len(nrow(patients)), function(i) {
  p <- patients[i, ]
  bind_rows(
    dose_tab[[as.character(p$study)]] |> mutate(evid = 1, cmt = "depot_trimethoprim"),
    tibble::tibble(time = seq(0, 250, by = 0.5), amt = 0, evid = 0, cmt = "central_creatinine")
  ) |>
    mutate(id = p$id, CRCL = p$CRCL, BSA = p$BSA, WT = p$WT, AGE = p$AGE, SEXF = p$SEXF, study = p$study)
})) |>
  arrange(id, time, desc(evid))

sim_scr <- function(ui, ev) {
  rxode2::rxSolve(ui, ev, returnType = "data.frame", keep = "study") |>
    left_join(window, by = "study") |>
    filter(time >= t_start, time <= t_end) |>
    group_by(id, study) |>
    summarise(pred = max(pct_change_scr), .groups = "drop")
}
pct <- bind_rows(lapply(names(scenarios_typ), function(sc) {
  sim_scr(scenarios_typ[[sc]], ev_tmp) |> mutate(scenario = sc)
})) |>
  left_join(patients |> select(id, pct_obs, study_name), by = "id")
#> ℹ omega/sigma items treated as zero: 'etalcl_trimethoprim', 'etalvc_trimethoprim', 'etalka_trimethoprim'
#> Warning: multi-subject simulation without without 'omega'
#> ℹ omega/sigma items treated as zero: 'etalcl_trimethoprim', 'etalvc_trimethoprim', 'etalka_trimethoprim'
#> Warning: multi-subject simulation without without 'omega'
#> ℹ omega/sigma items treated as zero: 'etalcl_trimethoprim', 'etalvc_trimethoprim', 'etalka_trimethoprim'
#> Warning: multi-subject simulation without without 'omega'
#> ℹ omega/sigma items treated as zero: 'etalcl_trimethoprim', 'etalvc_trimethoprim', 'etalka_trimethoprim'
#> Warning: multi-subject simulation without without 'omega'

by_study <- pct |>
  group_by(scenario, study_name) |>
  summarise(obs = mean(pct_obs), sd_obs = sd(pct_obs), pred = mean(pred), .groups = "drop")

# Prediction limits of the paper (PredError.m; Section S9): the wider of a
# two-fold band and +/- the 8.9% intra-individual CV of baseline SCr.
pred_limits <- function(obs, cv = 8.91) {
  o <- obs / 100
  a <- cv / 100
  a_ul <- a / (1 - a)
  ul2 <- ifelse(o > 0, 2 * o, o / (o + 2))
  ll2 <- ifelse(o > 0, o / 2, 2 * o / (1 - o))
  ul <- ifelse(o + a_ul < ul2 | o < -0.5, ul2, o + a_ul)
  ll <- ifelse(o - ll2 > a | o < -0.5, ll2, o - a)
  tibble::tibble(ll = 100 * ll, ul = 100 * ul)
}
by_study <- bind_cols(by_study, pred_limits(by_study$obs)) |>
  mutate(class = case_when(pred < ll ~ "under", pred > ul ~ "over", TRUE ~ "within"))

by_study |>
  mutate(across(c(obs, sd_obs, pred, ll, ul), ~ round(.x, 1))) |>
  dplyr::rename(
    "Scenario" = scenario, "Study" = study_name, "Observed mean (%)" = obs,
    "Observed SD (%)" = sd_obs, "Predicted mean (%)" = pred,
    "Lower limit (%)" = ll, "Upper limit (%)" = ul, "Classification" = class
  ) |>
knitr::kable(caption = "Mean percent change in serum creatinine after trimethoprim, 15 deposited patients.")| Scenario | Study | Observed mean (%) | Observed SD (%) | Predicted mean (%) | Lower limit (%) | Upper limit (%) | Classification |
|---|---|---|---|---|---|---|---|
| Bidirectional-OCT2, INH | Myre 1987 | 33.1 | 29.4 | 23.0 | 16.5 | 66.1 | within |
| Bidirectional-OCT2, INH | Tasker 1975 group 1 | 28.4 | 36.8 | 26.8 | 14.2 | 56.9 | within |
| Bidirectional-OCT2, INH | Tasker 1975 group 2 | 6.7 | 23.0 | 23.6 | -2.2 | 16.5 | over |
| Bidirectional-OCT2, non-INH | Myre 1987 | 33.1 | 29.4 | 46.5 | 16.5 | 66.1 | within |
| Bidirectional-OCT2, non-INH | Tasker 1975 group 1 | 28.4 | 36.8 | 40.2 | 14.2 | 56.9 | within |
| Bidirectional-OCT2, non-INH | Tasker 1975 group 2 | 6.7 | 23.0 | 45.6 | -2.2 | 16.5 | over |
| Uptake-OCT2, INH | Myre 1987 | 33.1 | 29.4 | 14.1 | 16.5 | 66.1 | under |
| Uptake-OCT2, INH | Tasker 1975 group 1 | 28.4 | 36.8 | 17.7 | 14.2 | 56.9 | within |
| Uptake-OCT2, INH | Tasker 1975 group 2 | 6.7 | 23.0 | 15.0 | -2.2 | 16.5 | within |
| Uptake-OCT2, non-INH | Myre 1987 | 33.1 | 29.4 | 20.3 | 16.5 | 66.1 | within |
| Uptake-OCT2, non-INH | Tasker 1975 group 1 | 28.4 | 36.8 | 21.8 | 14.2 | 56.9 | within |
| Uptake-OCT2, non-INH | Tasker 1975 group 2 | 6.7 | 23.0 | 21.1 | -2.2 | 16.5 | over |
# Observed means reproduce Table 1 (33 +/- 26, 28 +/- 34, 7 +/- 20)
obs_study <- by_study |> distinct(study_name, obs)
stopifnot(all(abs(obs_study$obs - c(33, 28, 7)) < 0.8))

# Table S9 classifies the 5 trimethoprim studies (these 3 plus the 2 Salford
# groups) as: uptake INH 3 within / 2 under / 0 over; bidirectional INH 3 / 0 / 2;
# non-INH 3 / 0 / 2 for both models. The 3 deposited studies cannot exceed
# those per-class counts.
counts <- by_study |> count(scenario, class) |> tidyr::complete(scenario, class, fill = list(n = 0))
table_s9 <- tibble::tribble(
  ~scenario, ~within, ~under, ~over,
  "Uptake-OCT2, INH", 3, 2, 0,
  "Uptake-OCT2, non-INH", 3, 0, 2,
  "Bidirectional-OCT2, INH", 3, 0, 2,
  "Bidirectional-OCT2, non-INH", 3, 0, 2
) |> tidyr::pivot_longer(-scenario, names_to = "class", values_to = "max_n")
s9 <- left_join(counts, table_s9, by = c("scenario", "class"))
stopifnot(all(s9$n <= s9$max_n))

ggplot(by_study, aes(obs, pred, colour = study_name)) +
  geom_abline(slope = 1, intercept = 0) +
  geom_errorbarh(aes(xmin = obs - sd_obs, xmax = obs + sd_obs), height = 0) +
  geom_point(size = 2) +
  facet_wrap(~scenario) +
  coord_equal(xlim = c(-20, 70), ylim = c(-20, 70)) +
  labs(
    x = "Observed % change in SCr", y = "Predicted % change in SCr", colour = NULL,
    caption = "Replicates the trimethoprim points of Figure 4 of Takita 2020 (3 of 5 studies)."
  )
#> Warning: `geom_errorbarh()` was deprecated in ggplot2 4.0.0.
#> ℹ Please use the `orientation` argument of `geom_errorbar()` instead.
#> This warning is displayed once per session.
#> Call `lifecycle::last_lifecycle_warnings()` to see where this warning was
#> generated.
#> `height` was translated to `width`.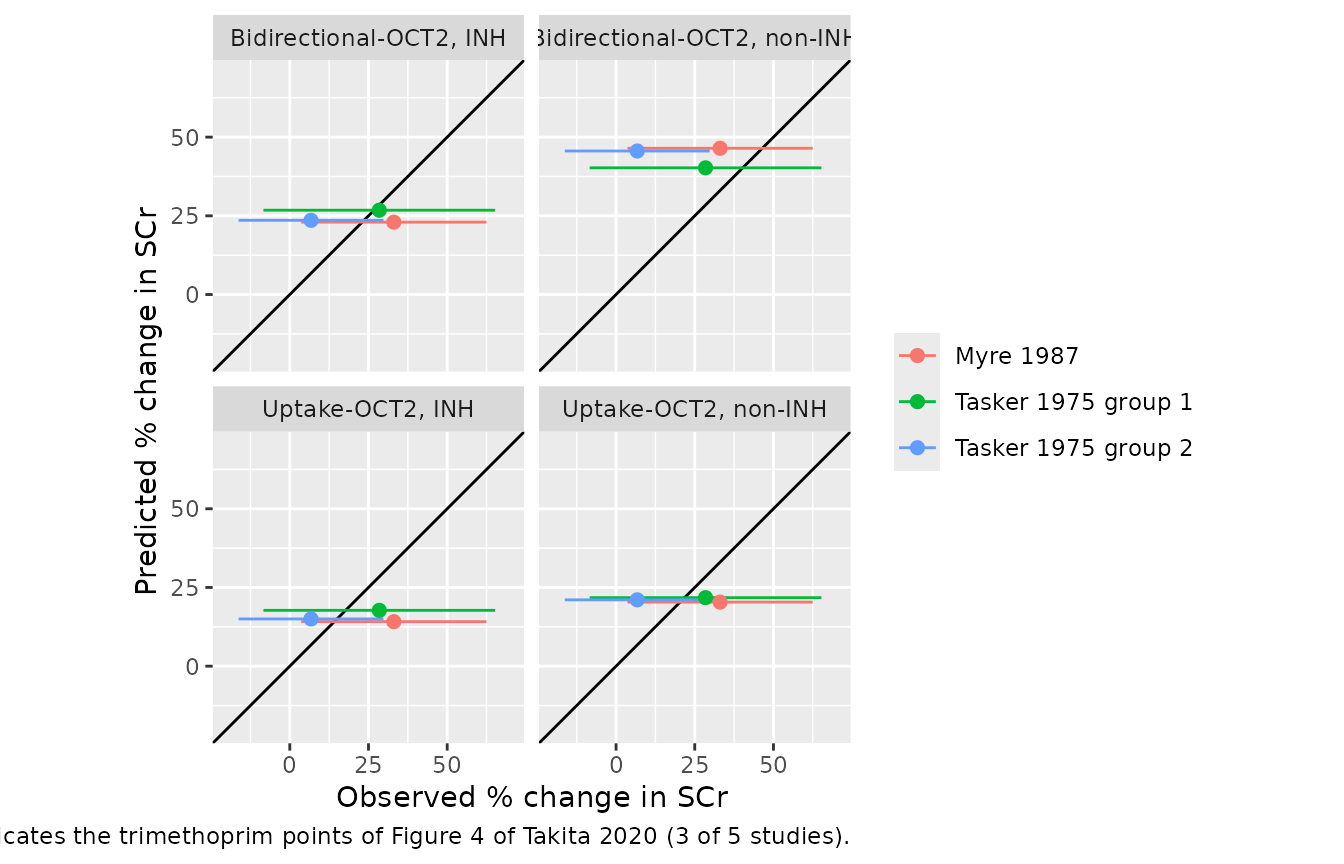
Consistent with the paper, the non-INH scenario predicts larger interactions than the INH scenario, most visibly in the bidirectional-OCT2 model, and the uptake-OCT2 INH scenario underpredicts the Myre 1987 interaction.
gap <- pct |>
  mutate(
    model_class = sub(",.*", "", scenario),
    scen = sub(".*, ", "", scenario)
  ) |>
  select(id, model_class, scen, pred) |>
  tidyr::pivot_wider(names_from = scen, values_from = pred) |>
  mutate(gap = `non-INH` - INH)
mean_gap <- gap |>
  group_by(model_class) |>
  summarise(gap = mean(gap), .groups = "drop")
stopifnot(
  # The typical-value solves are deterministic, so these are exact orderings
  all(gap$gap > 0),
  mean_gap$gap[mean_gap$model_class == "Bidirectional-OCT2"] >
    mean_gap$gap[mean_gap$model_class == "Uptake-OCT2"],
  by_study$class[by_study$scenario == "Uptake-OCT2, INH" & by_study$study_name == "Myre 1987"] == "under"
)
Inhibition at the proximal-tubular filtrate concentration
Section S7 also tests the unbound filtrate concentration
C_PT,filt as the inhibitory concentration at the apical
MATE transporters, a worst-case scenario (Figure S17, Table S10). It is
selected with mate_ic_filtrate = 1. Because
Kp,uu,filtrate exceeds 1 in every patient, the predicted
interaction can only increase, which the paper describes as exacerbating
the overprediction for trimethoprim.
filt <- bind_rows(lapply(names(scenarios_typ), function(sc) {
  ui_f <- suppressMessages(rxode2::ini(scenarios_typ[[sc]], mate_ic_filtrate = 1))
  sim_scr(ui_f, ev_tmp) |> mutate(scenario = sc)
})) |>
  rename(pred_filt = pred) |>
  left_join(pct |> select(id, scenario, pred), by = c("id", "scenario"))
#> ℹ omega/sigma items treated as zero: 'etalcl_trimethoprim', 'etalvc_trimethoprim', 'etalka_trimethoprim'
#> Warning: multi-subject simulation without without 'omega'
#> ℹ omega/sigma items treated as zero: 'etalcl_trimethoprim', 'etalvc_trimethoprim', 'etalka_trimethoprim'
#> Warning: multi-subject simulation without without 'omega'
#> ℹ omega/sigma items treated as zero: 'etalcl_trimethoprim', 'etalvc_trimethoprim', 'etalka_trimethoprim'
#> Warning: multi-subject simulation without without 'omega'
#> ℹ omega/sigma items treated as zero: 'etalcl_trimethoprim', 'etalvc_trimethoprim', 'etalka_trimethoprim'
#> Warning: multi-subject simulation without without 'omega'
stopifnot(all(chk$kpuu_trimethoprim > 1), all(filt$pred_filt > filt$pred))
filt |>
  group_by(scenario) |>
  summarise(`Cp,u (%)` = mean(pred), `C_PT,filt for MATE (%)` = mean(pred_filt), .groups = "drop") |>
knitr::kable(digits = 1, caption = "Mean predicted percent change in SCr, all 15 patients.")| scenario | Cp,u (%) | C_PT,filt for MATE (%) |
|---|---|---|
| Bidirectional-OCT2, INH | 24.7 | 32.4 |
| Bidirectional-OCT2, non-INH | 43.7 | 60.6 |
| Uptake-OCT2, INH | 15.8 | 19.2 |
| Uptake-OCT2, non-INH | 21.1 | 26.5 |
Cimetidine and famotidine
Individual covariates for the cimetidine and famotidine studies are
not in the deposited files, so this section illustrates those study
designs for a typical patient (man, 60 years, 70 kg, BSA 1.73 m^2) at
the midpoint of each study’s GFR range in Table 1, rather than
reproducing Figure 4. Where Table 1 gives a total daily dose split
unevenly, the larger dose was placed last in the day; intravenous doses
are given as boluses. The predicted interaction is the maximum percent
change in serum creatinine within the study’s sampling window. Each
design exercises a different dosing path of the model (oral cimetidine,
intravenous cimetidine, oral famotidine with F = 0.47,
intravenous famotidine).
day <- function(n) (n - 1) * 24
designs <- list(
  list(
    design = "Larsson 1980 group 1: cimetidine 200 mg q.d. oral", cmt = "depot_cimetidine",
    time = day(1:7), amt = 200, CRCL = 30.5, t_start = day(7), t_end = day(8), obs = 25
  ),
  list(
    design = "Larsson 1980 group 2: cimetidine 200 mg x 3 + 400 mg per day oral", cmt = "depot_cimetidine",
    time = as.vector(outer(c(0, 6, 12, 18), day(1:7), "+")), amt = rep(c(200, 200, 200, 400), 7),
    CRCL = 45.5, t_start = day(7), t_end = day(8), obs = 31
  ),
  list(
    design = "Ishigami 1989: cimetidine 400 mg b.i.d. oral", cmt = "depot_cimetidine",
    time = as.vector(outer(c(0, 12), day(1:7), "+")), amt = 400,
    CRCL = 22.5, t_start = day(7), t_end = day(8), obs = 12
  ),
  list(
    design = "Hilbrands 1991: cimetidine 400 mg x 2 + 600 mg per day oral", cmt = "depot_cimetidine",
    time = as.vector(outer(c(0, 8, 16), day(1:7), "+")), amt = rep(c(400, 400, 600), 7),
    CRCL = 30, t_start = day(7), t_end = day(8), obs = 26
  ),
  list(
    design = "Ma 1978: cimetidine 300 mg single dose IV", cmt = "central_cimetidine",
    time = 0, amt = 300, CRCL = 37.5, t_start = 24, t_end = 48, obs = 10
  ),
  list(
    design = "Ishigami 1989: famotidine 20 mg b.i.d. oral", cmt = "depot_famotidine",
    time = as.vector(outer(c(0, 12), day(1:7), "+")), amt = 20,
    CRCL = 22.5, t_start = day(7), t_end = day(8), obs = 7
  ),
  list(
    design = "Abraham 1987: famotidine 10 mg single dose IV", cmt = "central_famotidine",
    time = 0, amt = 10, CRCL = 25.5, t_start = 0, t_end = 4, obs = 0
  )
)

ev_cf <- bind_rows(lapply(seq_along(designs), function(i) {
  d <- designs[[i]]
  bind_rows(
    tibble::tibble(time = d$time, amt = d$amt, evid = 1, cmt = d$cmt),
    tibble::tibble(time = seq(0, 192, by = 0.25), amt = 0, evid = 0, cmt = "central_creatinine")
  ) |>
    mutate(id = i, CRCL = d$CRCL, BSA = 1.73, WT = 70, AGE = 60, SEXF = 0)
})) |>
  arrange(id, time, desc(evid))
win_cf <- tibble::tibble(
  id = seq_along(designs),
  design = vapply(designs, `[[`, "", "design"),
  t_start = vapply(designs, `[[`, 0, "t_start"),
  t_end = vapply(designs, `[[`, 0, "t_end"),
  obs = vapply(designs, `[[`, 0, "obs")
)

cf <- bind_rows(lapply(names(scenarios_typ), function(sc) {
  rxode2::rxSolve(scenarios_typ[[sc]], ev_cf, returnType = "data.frame") |>
    mutate(scenario = sc)
}))
#> ℹ omega/sigma items treated as zero: 'etalcl_trimethoprim', 'etalvc_trimethoprim', 'etalka_trimethoprim'
#> Warning: multi-subject simulation without without 'omega'
#> ℹ omega/sigma items treated as zero: 'etalcl_trimethoprim', 'etalvc_trimethoprim', 'etalka_trimethoprim'
#> Warning: multi-subject simulation without without 'omega'
#> ℹ omega/sigma items treated as zero: 'etalcl_trimethoprim', 'etalvc_trimethoprim', 'etalka_trimethoprim'
#> Warning: multi-subject simulation without without 'omega'
#> ℹ omega/sigma items treated as zero: 'etalcl_trimethoprim', 'etalvc_trimethoprim', 'etalka_trimethoprim'
#> Warning: multi-subject simulation without without 'omega'
# Transporter inhibition reduces creatinine secretion, so serum creatinine
# rises above its baseline. The only dip below baseline is a transient of
# about -0.002% in the uptake-OCT2 model at the onset of MATE inhibition, when
# creatinine collects in the tubular cell (which has no basolateral efflux
# through OCT2 in that model) before the reduced secretion raises the serum
# level.
stopifnot(min(cf$pct_change_scr) > -0.01)

cf_pred <- cf |>
  left_join(win_cf, by = "id") |>
  filter(time >= t_start, time <= t_end) |>
  group_by(scenario, design, obs) |>
  summarise(pred = max(pct_change_scr), .groups = "drop")

cf_pred |>
  mutate(pred = round(pred, 1)) |>
  tidyr::pivot_wider(names_from = scenario, values_from = pred) |>
  dplyr::rename("Study design" = design, "Observed mean (%)" = obs) |>
knitr::kable(caption = "Predicted percent change in serum creatinine for a typical patient per study design (cimetidine and famotidine).")| Study design | Observed mean (%) | Bidirectional-OCT2, INH | Bidirectional-OCT2, non-INH | Uptake-OCT2, INH | Uptake-OCT2, non-INH |
|---|---|---|---|---|---|
| Abraham 1987: famotidine 10 mg single dose IV | 0 | 0.5 | 0.9 | 0.3 | 0.4 |
| Hilbrands 1991: cimetidine 400 mg x 2 + 600 mg per day oral | 26 | 8.6 | 13.0 | 11.5 | 13.7 |
| Ishigami 1989: cimetidine 400 mg b.i.d. oral | 12 | 5.6 | 9.4 | 6.9 | 8.6 |
| Ishigami 1989: famotidine 20 mg b.i.d. oral | 7 | 5.3 | 8.5 | 3.2 | 4.0 |
| Larsson 1980 group 1: cimetidine 200 mg q.d. oral | 25 | 2.0 | 3.0 | 2.2 | 2.6 |
| Larsson 1980 group 2: cimetidine 200 mg x 3 + 400 mg per day oral | 31 | 7.1 | 9.1 | 8.8 | 9.8 |
| Ma 1978: cimetidine 300 mg single dose IV | 10 | 0.8 | 1.1 | 1.0 | 1.1 |
For this typical patient the model predicts smaller increases than observed in most of the cimetidine studies. This is the same direction as the paper’s finding with unbound plasma concentration as the inhibitory concentration: 40-60% of cimetidine studies fell below the prediction limits (Table S9). The typical patient is not any study’s actual cohort, so the values here are not expected to match Figure 4 study by study. The famotidine predictions stay small, as observed.
cim_uptake_noninh <- cf_pred |>
  filter(scenario == "Uptake-OCT2, non-INH", grepl("cimetidine", design))
fam_all <- cf_pred |> filter(grepl("famotidine", design))
stopifnot(
  # Cimetidine interaction below the observed mean in most studies
  sum(cim_uptake_noninh$pred < cim_uptake_noninh$obs) >= 3,
  # Famotidine interaction small in every scenario (observed 0-7%)
  all(fam_all$pred < 15)
)
Inhibitor pharmacokinetics (PKNCA)
The inhibitor PK sub-models are standard compartmental models. A
single dose of each (trimethoprim 160 mg oral as in Rieder 1974,
cimetidine 300 mg intravenous as in Ma 1978, famotidine 20 mg oral as in
Inotsume 1989) is simulated for a 70 kg typical patient and analysed
with PKNCA. The paper does not tabulate NCA results for these profiles,
so the check is against the closed form
AUC(0-inf) = F * Dose / CL, which holds for every linear
model regardless of the number of compartments.
nca_design <- tibble::tribble(
  ~treatment, ~cmt, ~amt, ~conc_var, ~F, ~CL,
  "Trimethoprim 160 mg oral", "depot_trimethoprim", 160, "Cc_trimethoprim", 1, 5.07,
  "Cimetidine 300 mg IV", "central_cimetidine", 300, "Cc_cimetidine", 1, 27.30,
  "Famotidine 20 mg oral", "depot_famotidine", 20, "Cc_famotidine", 0.47, 2.61
) |>
  mutate(id = row_number())
obs_grid <- sort(unique(c(seq(0, 2, by = 0.05), seq(2, 24, by = 0.25), seq(24, 240, by = 1))))
ev_nca <- bind_rows(lapply(seq_len(nrow(nca_design)), function(i) {
  d <- nca_design[i, ]
  bind_rows(
    tibble::tibble(time = 0, amt = d$amt, evid = 1, cmt = d$cmt),
    tibble::tibble(time = obs_grid, amt = 0, evid = 0, cmt = "central_creatinine")
  ) |>
    mutate(id = d$id, CRCL = 30, BSA = 1.73, WT = 70, AGE = 60, SEXF = 0)
})) |>
  arrange(id, time, desc(evid))

sim_nca <- rxode2::rxSolve(scenarios_typ[["Uptake-OCT2, non-INH"]], ev_nca, returnType = "data.frame") |>
  left_join(nca_design |> select(id, treatment, conc_var), by = "id")
#> ℹ omega/sigma items treated as zero: 'etalcl_trimethoprim', 'etalvc_trimethoprim', 'etalka_trimethoprim'
#> Warning: multi-subject simulation without without 'omega'
sim_nca$conc <- ifelse(sim_nca$conc_var == "Cc_trimethoprim", sim_nca$Cc_trimethoprim,
  ifelse(sim_nca$conc_var == "Cc_cimetidine", sim_nca$Cc_cimetidine, sim_nca$Cc_famotidine)
)
conc_df <- sim_nca |>
  filter(!is.na(conc)) |>
  select(id, time, conc, treatment)
dose_df <- nca_design |>
  transmute(id, time = 0, amt, treatment)

conc_obj <- PKNCA::PKNCAconc(conc_df, conc ~ time | treatment + id, concu = "mg/L", timeu = "h")
dose_obj <- PKNCA::PKNCAdose(dose_df, amt ~ time | treatment + id, doseu = "mg")
intervals <- data.frame(
  start = 0, end = Inf, cmax = TRUE, tmax = TRUE,
  aucinf.obs = TRUE, half.life = TRUE
)
nca_res <- PKNCA::pk.nca(PKNCA::PKNCAdata(conc_obj, dose_obj, intervals = intervals))
nca_tab <- as.data.frame(nca_res) |>
  filter(PPTESTCD %in% c("cmax", "tmax", "aucinf.obs", "half.life")) |>
  select(treatment, PPTESTCD, PPORRES) |>
  tidyr::pivot_wider(names_from = PPTESTCD, values_from = PPORRES) |>
  left_join(nca_design |> select(treatment, amt, F, CL), by = "treatment") |>
  mutate(auc_closed = F * amt / CL, rel_diff = aucinf.obs / auc_closed - 1)

nca_tab |>
  mutate(across(c(cmax, tmax, aucinf.obs, half.life, auc_closed), ~ signif(.x, 4)), rel_diff = signif(100 * rel_diff, 2)) |>
  select(treatment, cmax, tmax, half.life, aucinf.obs, auc_closed, rel_diff) |>
  dplyr::rename(
    "Treatment" = treatment, "Cmax (mg/L)" = cmax, "Tmax (h)" = tmax,
    "t1/2 (h)" = half.life, "AUC0-inf (mg*h/L)" = aucinf.obs,
    "F * Dose / CL (mg*h/L)" = auc_closed, "Difference (%)" = rel_diff
  ) |>
knitr::kable(caption = "PKNCA results for single doses of each inhibitor, typical 70 kg patient.")| Treatment | Cmax (mg/L) | Tmax (h) | t1/2 (h) | AUC0-inf (mg*h/L) | F * Dose / CL (mg*h/L) | Difference (%) |
|---|---|---|---|---|---|---|
| Cimetidine 300 mg IV | 8.4270 | 0.00 | 2.331 | 10.990 | 10.990 | 0.0140 |
| Famotidine 20 mg oral | 0.1048 | 5.75 | 19.130 | 3.601 | 3.602 | -0.0037 |
| Trimethoprim 160 mg oral | 1.3360 | 2.75 | 14.360 | 31.560 | 31.560 | -0.0038 |
Assumptions and deviations
- Source of the model structure. The paper describes the creatinine model in words and refers to Scotcher et al. (2020) for its structure. The ODEs were taken from the Simulink diagrams deposited with this paper, which include the CKD modifications; the resulting system reproduces Table 2 and the derived quantities of the deposited patient file (above).
-
Two model files. The uptake-OCT2 and
bidirectional-OCT2 models were optimised independently (Methods), so
they are packaged separately. Both default to the final non-INH
scenario; the INH scenario is the three-value
ini()override shown inas_inh(). -
Per-patient scaling. In the deposited
Run_simulation.m, the GFR ratio that scales the transporter clearances is taken from the first patient of each study rather than from each patient. The packaged models follow the paper’s equations (Eqs S6, S9-S11), which are per patient. -
Molecular weights. Cimetidine (252.34 g/mol) and
famotidine (337.44 g/mol) are not printed in the paper or deposited;
they were computed from the molecular formulae (C10H16N6S and
C8H15N7O2S3). Trimethoprim (290.32 g/mol) is from the deposited
Drug_info_S.mat. -
Famotidine Kp,uu,filtrate. Figure S15A regresses
famotidine renal clearance on creatinine clearance rather than GFR; the
model evaluates it at
CRCL. This only matters whenmate_ic_filtrate = 1. -
Trimethoprim PK. Final estimates are from Table S7.
The
$OMEGAvalues printed in Text S1 equal the squares of the Table S7 CVs (23.5%, 12.5%, 28.6%) and are used as the IIV variances.kais 1.24 1/h (Table S7) rather than the initial value 1.23 of Text S1. Cimetidine and famotidine were fitted by naive pooling and carry no between-subject variability. -
Creatinine baseline. The creatinine states start at
the analytic steady state of the uninhibited system, which is what the
deposited code reaches by a run-in period. In a multi-subject
rxSolve(), give every subject at least one record after time 0 so that the covariate-dependent initial conditions are applied. - Validation subset. Only the 15 patients of the deposited file (Myre 1987, Tasker 1975) have individual covariates, so baseline creatinine and the trimethoprim interactions are reproduced for this subset rather than for all 64 optimisation patients or all 12 interaction studies. The Salford Kidney Study patients are not public.