OAT1,3 renal secretion ontogeny: clavulanic acid, amoxicillin, piperacillin and cefazolin (Cristea 2021)
Source:vignettes/articles/Cristea_2021_oat13_renal_ontogeny_pbpk.Rmd
Cristea_2021_oat13_renal_ontogeny_pbpk.RmdModel and source
#> ℹ parameter labels from comments will be replaced by 'label()'- Citation: Cristea S, Krekels EHJ, Allegaert K, De Paepe P, de Jaeger A, De Cock P, Knibbe CAJ. Estimation of Ontogeny Functions for Renal Transporters Using a Combined Population Pharmacokinetic and Physiology-Based Pharmacokinetic Approach: Application to OAT1,3. AAPS J. 2021;23(3):65. doi:10.1208/s12248-021-00595-9. Model equations 1-6 and the Results estimates are from the main article; the system-parameter age functions (Table S1) and the retrospective IVIVE for piperacillin and cefazolin (equation S1 and Table S2) are from the Supplemental Material (ESM 1). The individual CLR values used as dependent variables came from the popPK model of De Cock PAJG et al. Antimicrob Agents Chemother. 2015;59(11):7027-7035 (doi:10.1128/AAC.01368-15).
- Description: PBPK (renal clearance, popPBPK; NONMEM 7.3). Paediatric renal clearance (CLR) of the OAT1,3 probe pair clavulanic acid and amoxicillin in critically ill children aged 1 month to 15 years (Cristea 2021), plus the paper’s PBPK predictions for two further OAT1,3 substrates, piperacillin and cefazolin. CLR is glomerular filtration (GF) plus active tubular secretion (ATS) in series: CLR = fu * GFR + (QR - GFR) * fu * CLsec / (QR + fu * CLsec / BP). Clavulanic acid is cleared by GF only; amoxicillin by GF and ATS. OAT1,3 secretion is CLsec = CLint * ont * KW, and the OAT1,3 ontogeny is a sigmoid (Hill) function of postnatal age with TM50 = 27.3 weeks and Hill 1.17. GFR, renal blood flow, kidney weight, albumin-driven fu and hematocrit-driven BP all follow published age functions (Table S1). IIV is on a GF correction factor and on CLint. The model has no compartments, ODEs or dosing. Each record gives CLR (L/h) from its covariates (PNA, GA, WT, BSA); the time column is not used.
- Article: https://doi.org/10.1208/s12248-021-00595-9
Cristea 2021 estimates how renal secretion by the organic anion transporters OAT1 and OAT3 matures in vivo. The approach combines population PK with PBPK (“popPBPK”). Clavulanic acid and amoxicillin were given together, at a fixed 1:10 dose ratio, to critically ill children aged 1 month to 15 years. Clavulanic acid is taken to be cleared by glomerular filtration (GF) only, and amoxicillin by GF plus OAT1,3-mediated active tubular secretion (ATS). The authors took each child’s post hoc renal clearance (CLR) of both drugs from the earlier popPK model of De Cock 2015. They then re-expressed CLR in PBPK terms and fitted it in NONMEM 7.3. The fit gives a GF correction factor for critical illness, an adult OAT1,3 intrinsic clearance, and a sigmoid OAT1,3 ontogeny in postnatal age. The ontogeny was then carried into PBPK predictions of renal clearance for piperacillin in children and cefazolin in neonates.
The packaged model has no compartments, ODEs or doses. Each record returns the renal clearances implied by that subject’s covariates:
Outputs are clr_clav, clr_amox (split into
clr_amox_gf and clr_amox_ats),
clr_pip and clr_cef, all in L/h. Other outputs
are the ontogeny fraction ont_oat13 and the system
quantities gfr, qr (mL/min) and
kw (g).
Population
The fit used one pair of individual CLR values (clavulanic acid and amoxicillin) for each of 50 critically ill children in paediatric intensive care at Ghent University Hospital. They were aged 1 month to 15 years (median 2.6 years) and had no renal dysfunction (Methods). Their weights, sex split and other demographics are reported in De Cock 2015, not in Cristea 2021. The piperacillin predictions are for 47 critically ill children aged 2.5 months to 15 years (median 2.83 years). The cefazolin predictions are for 26 near-term neonates with gestational age over 35 weeks and postnatal age 1 to 30 days (median 8 days).
Source trace
| Quantity | Value / equation | Source |
|---|---|---|
| CLR, GF + ATS in series | Eq. 1 | Methods, Eq. 1; Supplement Eq. S2 |
| OAT1,3 secretion clearance | CLsec = CLint x ont x PTCPGK x KW | Methods, Eqs. 2 and 5; Table S1 |
| Clavulanic acid CLR | GFR x fu x theta_corr x exp(eta_GFR) | Methods, Eq. 3 |
| Amoxicillin CLR | Eq. 3 term + ATS term with uncorrected GFR | Methods, Eq. 4 |
| OAT1,3 ontogeny | COV^hill / (COV^hill + TM50^hill), COV = PNA (weeks) | Methods, Eq. 6; Results; Figure 1 |
lclint_oat13 |
15.8 mL/h/g kidney (RSE 5%) | Results |
lpna50 (TM50) |
27.3 weeks (RSE 28%) | Results |
lhill |
1.17 (RSE 36%) | Results |
lfcorr_gfr (theta_corr) |
1.83 (RSE 4%) | Results |
etalclint_oat13 |
IIV 78.5% | Results |
etalfcorr_gfr |
IIV 24.4% | Results |
fu_clav, fu_amox,
bpr_amox
|
0.75, 0.82, 0.55 | Methods; Table S1 |
fu_pip, fu_cef, bpr_pip,
bpr_cef
|
0.8, 0.31, 0.55, 0.55 | Methods; Table S2 |
clint_vitro_pip, clint_vitro_cef
|
1.95, 7.1 uL/min/mg protein | Methods; Table S2 |
prot_hek, raf_oat3
|
0.25 mg protein per 10^6 cells, 4.6 | Supplement, Retrospective IVIVE |
aaf_pip, aaf_cef
|
11.6, 0.65 | Table S2 |
ptcpgk |
60 x 10^6 cells/g | Table S1 |
| GFR | 112 x (WT/70)^0.63 x PMA^3.3 / (PMA^3.3 + 55.4^3.3) | Table S1 |
| Plasma albumin | 1.1287 x ln(AGE, days) + 33.746 | Table S1 |
| Paediatric fu | 1 / (1 + (1 - fu) x HSA_ped / (HSA_adult x fu)) | Table S1 |
| Cardiac output | BSA x (110 + 184 x exp(-0.0378 AGE) - exp(-0.24477 AGE)) | Table S1 |
| Renal fraction of cardiac output | mean of the male and female functions | Table S1 |
| Kidney weight | 1050 x (4.214 WT^0.823 + 4.456 WT^0.795) / 1000 | Table S1 |
| Hematocrit, BP | mean of the male and female functions; BP = 1 + hct x (fu x kp - 1) | Table S1 |
age_adult_ref |
30 years | Not printed; see Assumptions and deviations |
Checks against the paper
mod0 <- rxode2::zeroRe(mod)
#> ℹ parameter labels from comments will be replaced by 'label()'
#> Warning: No sigma parameters in the model
mo <- function(years) years * 365.25 / 30.4375
haycock <- function(wt, ht) 0.024265 * wt^0.5378 * ht^0.3964
solve_cov <- function(m, d) {
  d$id <- seq_len(nrow(d))
  d$time <- 0
  d$evid <- 0
  as.data.frame(rxode2::rxSolve(m, d, returnType = "data.frame"))
}
OAT1,3 ontogeny (Figure 1)
The Results state that the ontogeny fraction runs “from 0.1 at 1
month and 1 at 15 years”. Figure 1 plots the typical OAT1,3 secretion
clearance per gram kidney, CLint x ont, which levels off at
about 15.8 mL/h/g.
age_grid <- exp(seq(log(1 / 12), log(15), length.out = 200))
ont <- solve_cov(mod0, data.frame(
  PNA = mo(age_grid), GA = 40, WT = 20, BSA = 0.8
))
#> ℹ omega/sigma items treated as zero: 'etalfcorr_gfr', 'etalclint_oat13'
ont$age_yr <- age_grid

ont_1m <- ont$ont_oat13[1]
ont_15y <- ont$ont_oat13[nrow(ont)]
c(ont_1_month = ont_1m, ont_15_years = ont_15y)
#>  ont_1_month ont_15_years
#>    0.1043843    0.9806653
stopifnot(
  abs(ont_1m - 0.1) < 0.01,
  ont_15y > 0.98
)
ggplot(ont, aes(age_yr, clsec_per_kw_typ)) +
  geom_line(linewidth = 1.2, colour = "navy") +
  scale_x_log10() +
  scale_y_log10(limits = c(1, 50)) +
  labs(x = "Age (years)", y = "CLsec,OAT1,3 / KW (mL/h/g kidney)")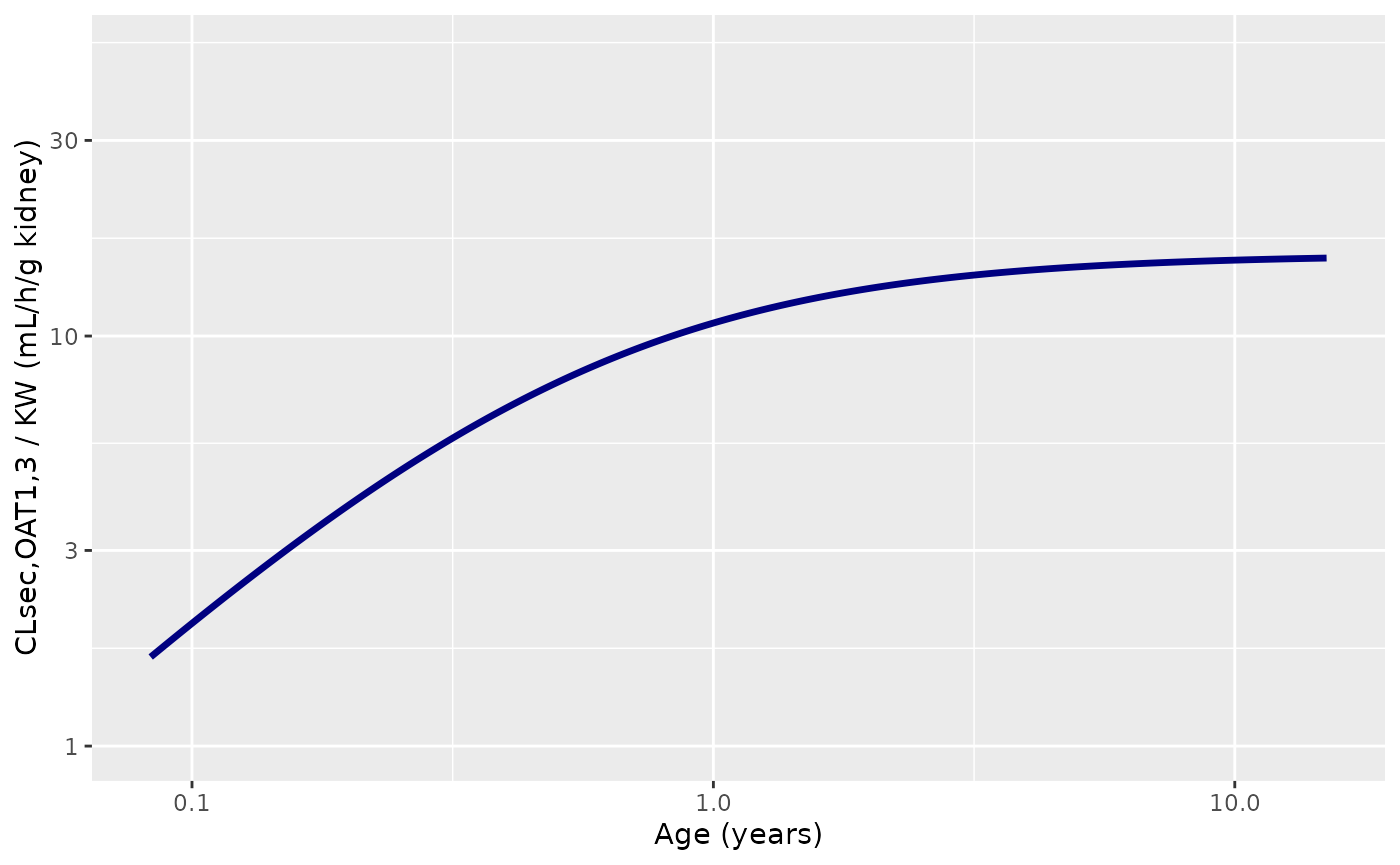
Replicates the typical curve of Figure 1 of Cristea 2021: OAT1,3-mediated secretion clearance per gram kidney against age, double-log scale.
Adult IVIVE anchors for piperacillin and cefazolin (Table S2)
The supplement chose each drug’s activity adjustment factor (AAF) so that the adult PBPK model returns the adult CLR from the literature: 13.6 L/h for piperacillin in a 53.6 kg, 33-year-old, and 4.5 L/h for cefazolin in a 109 kg, 47-year-old. Running the adult case through the model checks the whole chain at once: GFR, renal blood flow, kidney weight, fu, BP and the IVIVE product. BSA is not reported for these adults. It is computed here with the Haycock formula at an assumed height of 170 cm.
adults <- data.frame(
  drug = c("piperacillin", "cefazolin"),
  PNA = mo(c(33, 47)), GA = 40, WT = c(53.6, 109)
)
adults$BSA <- haycock(adults$WT, 170)
res_ad <- solve_cov(mod0, adults)
#> ℹ omega/sigma items treated as zero: 'etalfcorr_gfr', 'etalclint_oat13'
ivive <- data.frame(
  Drug = adults$drug,
  `BSA (m2)` = round(adults$BSA, 2),
  `Model CLR (L/h)` = round(c(res_ad$clr_pip[1], res_ad$clr_cef[2]), 2),
  `Table S2 CLR (L/h)` = c(13.6, 4.5),
  check.names = FALSE
)
ivive$`Difference (%)` <- round(100 * (ivive$`Model CLR (L/h)` / ivive$`Table S2 CLR (L/h)` - 1), 1)
knitr::kable(ivive)| Drug | BSA (m2) | Model CLR (L/h) | Table S2 CLR (L/h) | Difference (%) |
|---|---|---|---|---|
| piperacillin | 1.58 | 13.54 | 13.6 | -0.4 |
| cefazolin | 2.32 | 4.61 | 4.5 | 2.4 |
Amoxicillin: GF and ATS contributions (Figure 2)
Figure 2 splits each child’s amoxicillin CLR into GF and ATS. Median total CLR is 1.64 L/h in children under 1 year and 12 L/h in children 10 years and older. The median ATS share rises from 14% (under 1 year) to 18% (1-2 years), 21% (2-5 years), 24% (5-10 years) and 29% (over 10 years), with 22% overall (Results).
The paper’s individual demographics are not published, so the checks below use a typical child at each age-band midpoint, not a cohort median. Weight and height are approximate sex-averaged 50th percentiles (WHO to 5 years, CDC from 5 years). GA is 40 weeks, as the Table S1 legend assumes when GA is unknown.
growth <- data.frame(
  age = c(1 / 12, 0.25, 0.5, 1, 2, 3, 5, 8, 10, 12, 15),
  wt = c(4.3, 6.1, 7.6, 9.35, 12.0, 14.1, 18.2, 25.6, 32.5, 41.0, 54.5),
  ht = c(54.2, 60.9, 66.6, 75.0, 86.8, 95.5, 109.6, 127.5, 138.5, 150.5, 165.5)
)
typ_child <- function(age) {
  wt <- exp(approx(log(growth$age), log(growth$wt), log(age), rule = 2)$y)
  ht <- approx(log(growth$age), growth$ht, log(age), rule = 2)$y
  data.frame(PNA = mo(age), GA = 40, WT = wt, BSA = haycock(wt, ht))
}
bands <- data.frame(
  band = c("< 1 year", "1-2 years", "2-5 years", "5-10 years", "> 10 years"),
  age = c(0.5, 1.5, 3.5, 7.5, 12.5),
  ats_paper = c(14, 18, 21, 24, 29)
)
typ <- solve_cov(mod0, typ_child(bands$age))
#> ℹ omega/sigma items treated as zero: 'etalfcorr_gfr', 'etalclint_oat13'
bands$clr_amox <- typ$clr_amox
bands$ats_model <- 100 * typ$clr_amox_ats / typ$clr_amox
bands |>
  mutate(clr_amox = round(clr_amox, 2), ats_model = round(ats_model, 1)) |>
  rename(
    "Age band" = band, "Typical age (years)" = age,
    "Paper median ATS share (%)" = ats_paper,
    "Model amoxicillin CLR (L/h)" = clr_amox,
    "Model ATS share (%)" = ats_model
  ) |>
knitr::kable()| Age band | Typical age (years) | Paper median ATS share (%) | Model amoxicillin CLR (L/h) | Model ATS share (%) |
|---|---|---|---|---|
| < 1 year | 0.5 | 14 | 1.90 | 14.4 |
| 1-2 years | 1.5 | 18 | 3.48 | 16.1 |
| 2-5 years | 3.5 | 21 | 4.71 | 18.0 |
| 5-10 years | 7.5 | 24 | 6.52 | 19.9 |
| > 10 years | 12.5 | 29 | 9.52 | 21.6 |
stopifnot(
  # The ATS share rises with age, as in Figure 2.
  all(diff(bands$ats_model) > 0),
  # Each band within 10 percentage points of the paper's median.
  all(abs(bands$ats_model - bands$ats_paper) < 10),
  # Total CLR at the band ends: within 35% of the paper's medians.
  abs(bands$clr_amox[1] / 1.64 - 1) < 0.35,
  abs(bands$clr_amox[5] / 12 - 1) < 0.35
)
The typical ATS share matches the paper’s median in infants and falls progressively below it with age, by 7.4 percentage points in the oldest band. The paper’s figures are medians of individual (post hoc) values. Figure 1 shows that the individual secretion clearances in the oldest children lie mostly above the typical curve, which accounts for the higher median ATS share there.
A stochastic cohort shows the between-child spread that Figure 2 displays. There are 200 children, with the paper’s age mix (Figure 2 has roughly 9, 14, 14, 6 and 7 children per band, scaled by 4) and weight and height scattered around the 50th percentile.
rxode2::rxSetSeed(2021)
set.seed(2021)
n_band <- c(36, 56, 56, 24, 28)
lo <- c(1 / 12, 1, 2, 5, 10)
hi <- c(1, 2, 5, 10, 15)
age_c <- unlist(lapply(1:5, function(i) runif(n_band[i], lo[i], hi[i])))
coh <- typ_child(age_c)
coh$WT <- coh$WT * exp(rnorm(nrow(coh), 0, 0.12))
coh$BSA <- coh$BSA * exp(rnorm(nrow(coh), 0, 0.06))
sim <- solve_cov(mod, coh)
#> ℹ parameter labels from comments will be replaced by 'label()'
sim$age_yr <- age_c
sim$band <- cut(age_c, c(0, 1, 2, 5, 10, 15),
  labels = bands$band, right = FALSE
)

sim |>
  group_by(band) |>
  summarise(
    n = n(),
    clr_amox = round(median(clr_amox), 2),
    ats = round(100 * median(clr_amox_ats / clr_amox), 1)
  ) |>
  rename(
    "Age band" = band, "Children" = n,
    "Median amoxicillin CLR (L/h)" = clr_amox,
    "Median ATS share (%)" = ats
  ) |>
knitr::kable()| Age band | Children | Median amoxicillin CLR (L/h) | Median ATS share (%) |
|---|---|---|---|
| < 1 year | 36 | 2.30 | 13.2 |
| 1-2 years | 56 | 3.49 | 16.1 |
| 2-5 years | 56 | 4.66 | 14.1 |
| 5-10 years | 24 | 6.16 | 17.6 |
| > 10 years | 28 | 9.31 | 19.9 |
ats_all <- 100 * sim$clr_amox_ats / sim$clr_amox
stopifnot(abs(median(ats_all) - 22) < 8)

sim |>
  select(age_yr, clr_amox_gf, clr_amox_ats) |>
  pivot_longer(-age_yr, names_to = "pathway", values_to = "clr") |>
  mutate(pathway = ifelse(pathway == "clr_amox_gf", "GF", "ATS")) |>
  ggplot(aes(age_yr, clr, colour = pathway)) +
  geom_point(alpha = 0.6) +
  scale_x_log10() +
  labs(x = "Age (years)", y = "Amoxicillin renal CL (L/h)", colour = "Pathway")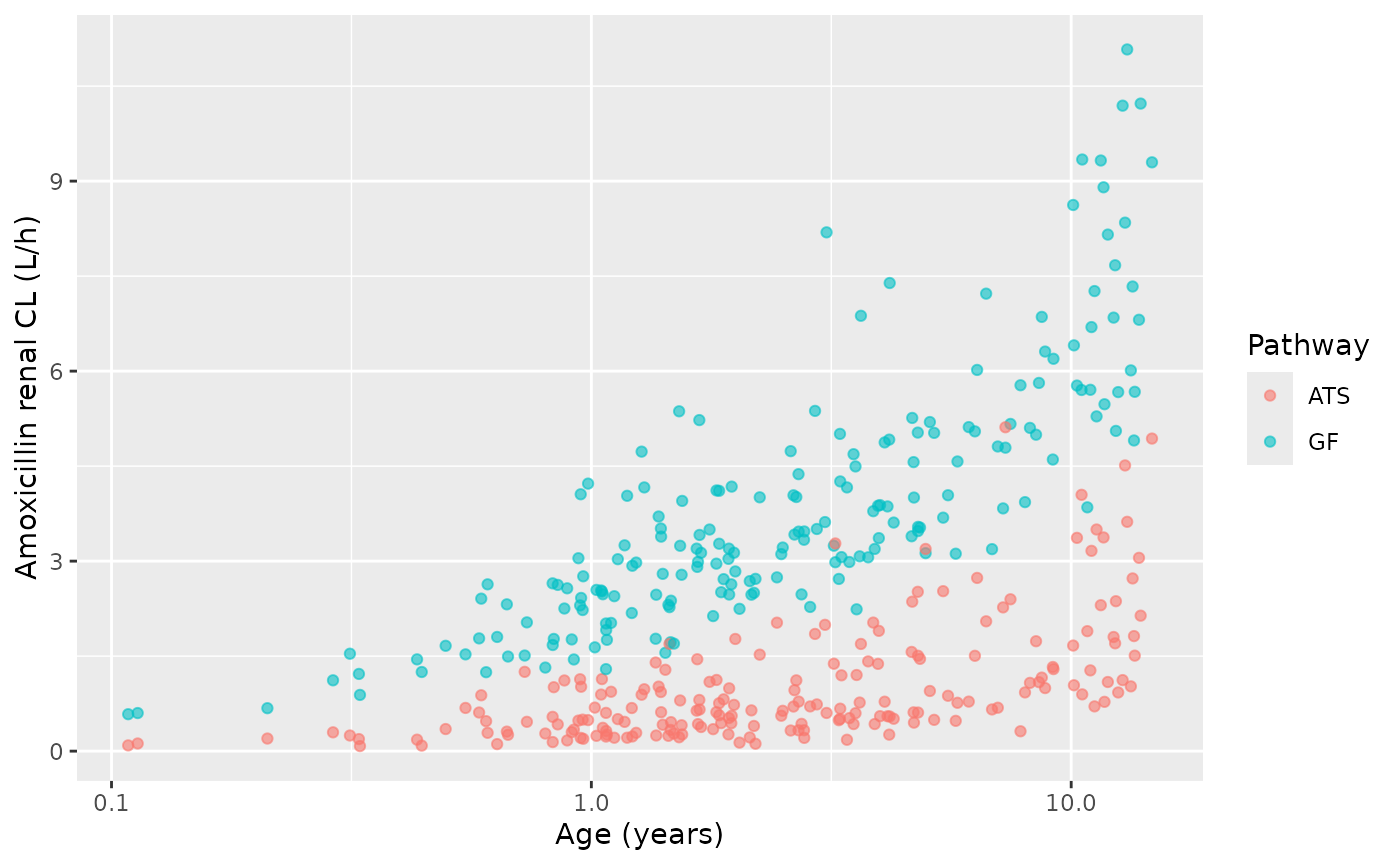
Amoxicillin renal clearance split into GF and ATS for a simulated cohort of 200 critically ill children; compare Figure 2 of Cristea 2021.
Piperacillin in children and cefazolin in neonates (Figure 3)
Figure 3 plots the typical PBPK CLR predicted for each child in the external piperacillin and cefazolin cohorts. The individual demographics are not published, so the checks below compare the typical child at a given age with the levels read off the blue (PBPK) points of Figure 3 by the maintainers. The levels are about 2.3 L/h at 1 year, 5.5 L/h at 5 years and 9.5 L/h at 12 years (piperacillin), and 0.07 to 0.125 L/h over the first month (cefazolin).
pip_ages <- c(1, 5, 12)
pip_fig3 <- c(2.3, 5.5, 9.5)
pip <- solve_cov(mod0, typ_child(pip_ages))
#> ℹ omega/sigma items treated as zero: 'etalfcorr_gfr', 'etalclint_oat13'
pip_ratio <- pip$clr_pip / pip_fig3
data.frame(
  `Age (years)` = pip_ages,
  `Model piperacillin CLR (L/h)` = round(pip$clr_pip, 2),
  `Figure 3a PBPK level (L/h)` = pip_fig3,
  `Model / Figure 3a` = round(pip_ratio, 2),
  check.names = FALSE
) |> knitr::kable()| Age (years) | Model piperacillin CLR (L/h) | Figure 3a PBPK level (L/h) | Model / Figure 3a |
|---|---|---|---|
| 1 | 3.47 | 2.3 | 1.51 |
| 5 | 6.94 | 5.5 | 1.26 |
| 12 | 12.36 | 9.5 | 1.30 |
# A misread AAF, IVIVE factor or unit moves these by several-fold.
stopifnot(all(pip_ratio > 0.7 & pip_ratio < 1.8))

neo_days <- 1:30
neo <- do.call(rbind, lapply(c(2.8, 3.5, 4.2), function(wt) {
  d <- data.frame(PNA = neo_days / 30.4375, GA = 39, WT = wt, BSA = haycock(wt, 50))
  out <- solve_cov(mod0, d)
  data.frame(pna_d = neo_days, wt = paste(wt, "kg"), clr_cef = out$clr_cef)
}))
#> ℹ omega/sigma items treated as zero: 'etalfcorr_gfr', 'etalclint_oat13'
#> ℹ omega/sigma items treated as zero: 'etalfcorr_gfr', 'etalclint_oat13'
#> ℹ omega/sigma items treated as zero: 'etalfcorr_gfr', 'etalclint_oat13'
cef_8d <- neo$clr_cef[neo$wt == "3.5 kg" & neo$pna_d == 8]
cef_8d
#> [1] 0.09657967
stopifnot(cef_8d > 0.07, cef_8d < 0.13)
For a typical child, the model’s piperacillin CLR is 1.26 to 1.51 times the Figure 3a PBPK levels. The adult anchor above is reproduced, and the amoxicillin and cefazolin checks agree with the paper. So the gap is most likely in the external piperacillin cohort, whose weights are not published. That cohort was critically ill, and the Figure 3a points at 12 years spread from about 7 to 11 L/h. The same gap appears inside the paper itself. The paper’s piperacillin OAT1,3 intrinsic clearance is about six times that of amoxicillin, yet its piperacillin predictions for children over 10 years lie below the paper’s own median amoxicillin CLR (12 L/h) in the same age range. A lighter cohort is consistent with that. In infants, the printed cardiac-output form also raises piperacillin CLR compared with the Simcyp form (see the sensitivity table below).
ggplot(neo, aes(pna_d, clr_cef, colour = wt)) +
  geom_line(linewidth = 1) +
  annotate("rect", xmin = 1, xmax = 30, ymin = 0.07, ymax = 0.125, alpha = 0.1) +
  labs(x = "Postnatal age (days)", y = "Cefazolin CLR (L/h)", colour = "Weight")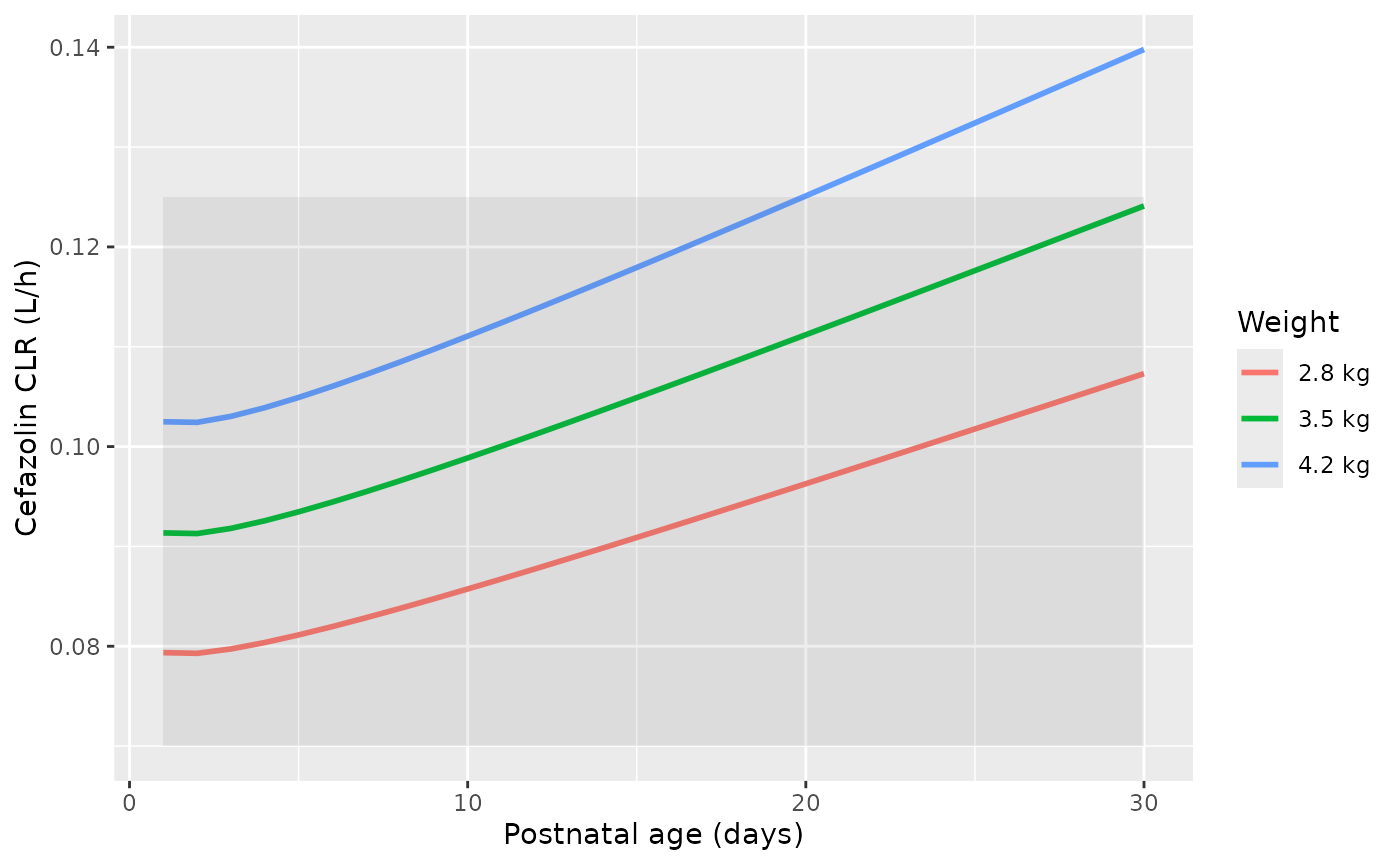
Typical cefazolin renal clearance over the first month of life for three birth weights; compare the blue points of Figure 3b of Cristea 2021.
Sensitivity to the unprinted and ambiguous inputs
The age functions of Table S1 leave three details open (see Assumptions and deviations). Each alternative is swapped into the model below, and CLR is compared with the packaged form for typical children from 1 month to 15 years and a 3.5 kg, 8-day-old neonate.
sens_cov <- rbind(
  typ_child(c(1 / 12, 0.5, 1, 3, 8, 15)),
  data.frame(PNA = 8 / 30.4375, GA = 39, WT = 3.5, BSA = haycock(3.5, 50))
)
base <- solve_cov(mod0, sens_cov)
#> ℹ omega/sigma items treated as zero: 'etalfcorr_gfr', 'etalclint_oat13'
alts <- list(
  "Cardiac output in the Simcyp form 184.974 x (exp - exp)" = mod0 |>
    rxode2::model(co <- BSA * (110 + 184.974 * (exp(-0.0378 * age_yr) - exp(-0.24477 * age_yr)))),
  "Adult albumin 37.7 g/L" = mod0 |> rxode2::model(hsa_adult <- 37.7),
  "kp = 0 (BP = 1 - hematocrit)" = mod0 |>
    rxode2::model(kp_amox <- 0) |>
    rxode2::model(kp_pip <- 0) |>
    rxode2::model(kp_cef <- 0)
)
#> ! remove population parameter `bpr_amox`
#> ! remove population parameter `bpr_pip`
#> ! remove population parameter `bpr_cef`
sens <- do.call(rbind, lapply(names(alts), function(nm) {
  a <- solve_cov(alts[[nm]], sens_cov)
  data.frame(
    Alternative = nm,
    clav = max(abs(a$clr_clav / base$clr_clav - 1)),
    amox = max(abs(a$clr_amox / base$clr_amox - 1)),
    pip = max(abs(a$clr_pip / base$clr_pip - 1)),
    cef = max(abs(a$clr_cef / base$clr_cef - 1))
  )
}))
#> ℹ omega/sigma items treated as zero: 'etalfcorr_gfr', 'etalclint_oat13'
#> ℹ omega/sigma items treated as zero: 'etalfcorr_gfr', 'etalclint_oat13'
#> ℹ omega/sigma items treated as zero: 'etalfcorr_gfr', 'etalclint_oat13'
sens |>
  mutate(across(clav:cef, \(x) round(100 * x, 1))) |>
  rename(
    "Clavulanic acid (max %)" = clav, "Amoxicillin (max %)" = amox,
    "Piperacillin (max %)" = pip, "Cefazolin (max %)" = cef
  ) |>
knitr::kable()| Alternative | Clavulanic acid (max %) | Amoxicillin (max %) | Piperacillin (max %) | Cefazolin (max %) |
|---|---|---|---|---|
| Cardiac output in the Simcyp form 184.974 x (exp - exp) | 0.0 | 1.8 | 14.3 | 2.9 |
| Adult albumin 37.7 g/L | 4.1 | 2.9 | 2.9 | 10.5 |
| kp = 0 (BP = 1 - hematocrit) | 0.0 | 0.1 | 1.5 | 0.1 |
PKNCA
Not applicable. The model returns renal clearances, not concentration-time profiles, so there is nothing to run NCA on. The checks above replace it: the adult IVIVE anchors, the ontogeny fractions quoted in the Results, and the Figure 2 and Figure 3 levels.
Assumptions and deviations
- CLint includes PTCPGK. Eq. 5 multiplies CLint by the proximal tubule cells per gram kidney (PTCPGK = 60 x 10^6 cells/g) and by kidney weight. The Results report the estimate as “15.8 ml/h/g kidney”, which is per gram of kidney. So the packaged CLsec for amoxicillin is 15.8 x ont x KW, with no second factor of 60. Two checks support this. First, Figure 1 plots CLsec/KW in mL/h/g kidney, and its typical curve levels off at about 15.8. Second, 15.8 mL/h/g divided by 60 is 4.39 uL/min per 10^6 cells, which is the amoxicillin CLint of “4.4” quoted in the Discussion. Piperacillin and cefazolin come from the IVIVE (Eq. S1) in uL/min per 10^6 cells, so for them PTCPGK is applied explicitly.
- Units of the cardiac output and renal fraction functions. The Table S1 header gives renal blood flow in mL/min. The cardiac-output function, however, is in L/h (per m^2 BSA), and the renal fraction of cardiac output is in percent. Taking CO in mL/min would put a 15-year-old’s renal blood flow at about 60 mL/min, below their GFR, and the (QR - GFR) term of Eq. 1 would go negative. The model therefore converts L/h to mL/min and divides the renal fraction by 100. Hematocrit is likewise in percent (53 at birth).
-
Printed cardiac output form. Table S1 prints
110 + 184 x exp(-0.0378 AGE) - exp(-0.24477 AGE), with no bracket around the two exponentials. The Simcyp form that the same research group printed elsewhere (Brussee 2018) is110 + 184.974 x (exp(-0.0378 AGE) - exp(-0.24477 AGE)). Both agree in adults, but in infants the printed form gives a cardiac output several times higher. The packaged model uses the form printed in this paper. Switching to the Simcyp form changes CLR by at most 14.3% for piperacillin, 2.9% for cefazolin and 1.8% for amoxicillin; clavulanic acid, cleared by GF alone, is unaffected. Piperacillin moves most because its secretion clearance is large enough for renal blood flow to limit it. -
Adult albumin for the fu scaling. The
McNamara-Alcorn fu scaling needs an adult albumin concentration, which
is not printed. Table S1 gives AGE in days for the albumin function. The
model evaluates the same function at an adult reference age of 30 years,
giving 44.2 g/L (
age_adult_ref). The earlier paper from the same group (Brussee 2018) instead fixed the adult value at 37.7 g/L with AGE in years. That alternative changes CLR by at most 10.5%, most for the highly bound cefazolin. - Blood-to-plasma ratio. Table S1 scales BP as 1 + hct x (fu x kp - 1), but kp is not printed. The model back-solves kp so that the adult fu and the adult hematocrit (the Table S1 function at 30 years, 41.0%) return the printed adult BP of 0.55. The implied kp is slightly negative, because 0.55 is a little below 1 - 0.41. The alternative kp = 0 (BP = 1 - hematocrit) changes CLR by at most 1.5% (sensitivity table), because BP only enters the fu x CLsec / BP term in the denominator of Eq. 1.
- Body surface area. The paper does not say how BSA was computed. The model takes BSA as a covariate. This vignette uses the Haycock formula.
- No residual error. The dependent variables were post hoc CLR values, and the paper does not report the residual error model of the popPBPK fit. None is encoded; the model is meant for typical-value and between-subject simulation of CLR.
- IIV scale. IIV is reported as CV%. It is converted with omega^2 = log(1 + CV^2).
- Piperacillin and cefazolin are typical predictions. As in the paper, these outputs use Eq. 1 without the critical-illness GF correction and without IIV.
- Postnatal age must be above zero. The albumin function takes the log of age in days. The youngest subjects in the paper were 1 day old (cefazolin neonates).
- Virtual cohorts. The growth table, the age mix of the stochastic cohort, and the Figure 3 levels were chosen or digitised by the maintainers. The paper’s individual demographics are not published.