Daidzein and S-equol gut-microbial PBPK (Wang 2022)
Source:vignettes/articles/Wang_2022_daidzein_equol.Rmd
Wang_2022_daidzein_equol.RmdModel and source
- Citation: Wang Q, Spenkelink B, Boonpawa R, Rietjens IMCM. Use of Physiologically Based Pharmacokinetic Modeling to Predict Human Gut Microbial Conversion of Daidzein to S-Equol. J Agric Food Chem. 2022;70(1):343-352. doi:10.1021/acs.jafc.1c03950. PMCID: PMC8759082. Microbial kinetic constants Table 2; S-equol conjugation kinetics Table 3; the complete Berkeley Madonna ODE listing with all physiological, partition and scaling parameters is Supporting Information 2 (PBPK model code).
- Description: PBPK (whole-body, flow-limited) for the dietary isoflavone daidzein and its gut-microbial metabolite S-equol in the adult human. Seven flow-limited tissue groups (blood, liver, fat, rapidly perfused, slowly perfused, small-intestine tissue) plus a small-intestine lumen and a large-intestine lumen; the large-intestine lumen is the microbiota compartment where daidzein is converted by capacity-limited (Michaelis-Menten) gut-microbial metabolism to dihydrodaidzein (DHD), S-equol (only in S-equol producers) and O-desmethylangolensin (O-DMA). Small-intestine and hepatic phase-II glucuronidation/sulfation of daidzein, and hepatic glucuronidation/sulfation of S-equol, are also capacity-limited. A coupled S-equol sub-model (large-intestine lumen, liver, fat, rapidly/slowly perfused, blood) receives the microbially formed S-equol via a first-order transfer from lumen to liver. All kinetic constants come from in vitro anaerobic human fecal incubations (microbial steps) and pooled human liver S9 incubations (S-equol conjugation), scaled to the whole body. The default parameter set is the S-equol PRODUCER; the nonproducer is the same structure with the S-equol sub-model inactive and different microbial DHD/O-DMA kinetics (see the vignette). Deterministic: the publication reports no IIV and no residual error. Daidzein enters as an oral dose into the small-intestine lumen.
- Article: https://doi.org/10.1021/acs.jafc.1c03950
- Supplement: Supporting Information 2 (PBPK model code) – the complete Berkeley Madonna ODE listing with all physiological, partition and scaling parameters, available free of charge at the DOI above.
This is a whole-body, flow-limited physiologically based pharmacokinetic (PBPK) model for the dietary isoflavone daidzein and its gut-microbial metabolite S-equol in the adult human. It is the human counterpart of the rat model of Wang et al. (2020, Mol Nutr Food Res 64:e1900912). The novel feature is a large-intestine lumen (microbiota) compartment in which capacity-limited gut-microbial metabolism converts daidzein to dihydrodaidzein (DHD), S-equol (only in S-equol producers) and O-desmethylangolensin (O-DMA). All kinetic constants were measured in vitro – microbial steps from pooled anaerobic human fecal incubations, S-equol conjugation from pooled human liver S9 – and scaled to the whole body, so the model is an in vitro-in silico “new approach methodology” (NAM) with no in vivo fitting.
Population
The kinetic constants were derived in vitro rather than from a
clinical population fit. Fecal samples from 15 volunteers were screened
(Table 1); 6 were S-equol producers and 9 nonproducers. Producer and
nonproducer feces were pooled separately, and daidzein (2.5-60 uM) was
incubated anaerobically to obtain the apparent Vmax and
Km for DHD, S-equol and O-DMA formation (Table 2). S-equol
glucuronidation and sulfation kinetics were measured in pooled human
liver S9 fractions from 25 donors of mixed gender (Table 3).
Physiological parameters are human reference values (Brown et al. 1997)
at a 70 kg reference body weight, and tissue/blood partition
coefficients were computed by the quantitative property-property
relationship (QPPR) of DeJongh et al. (1997). Model predictions were
made for oral daidzein doses of 0.09-3.34 mg/kg body weight.
The same information is available programmatically via the model’s
population metadata
(readModelDb("Wang_2022_daidzein_equol_pbpk")()$population).
Source trace
Every ini() value carries an in-file comment pointing to
its origin (paper Table or the Supporting Information 2 code). The table
below collects the principal entries; the full physiological, partition
and kinetic parameter set is in
inst/modeldb/endogenous/Wang_2022_daidzein_equol_pbpk.R.
| Equation / parameter | Value | Source location |
|---|---|---|
Tissue volume fractions (VSIc, VLc,
VRc, VSc, VFc,
VBc) |
0.0091 / 0.0257 / 0.0442 / 0.5428 / 0.2142 / 0.0790 | SI2, Physiological parameters (Brown 1997) |
Cardiac output QC, flow fractions |
347.9 L/h; 0.09 / 0.137 / 0.473 / 0.248 / 0.052 | SI2, Blood flow rates |
Daidzein partitions
(PIDAI,PLDAI,PRDAI,PSDAI,PFDAI) |
1.29 / 1.29 / 1.29 / 0.56 / 39.9 | SI2, Physicochemical parameters (DeJongh 1997) |
S-equol partitions
(PLEQU,PREQU,PSEQU,PFEQU) |
1.83 / 1.83 / 0.65 / 77.2 | SI2, Physicochemical parameters |
Absorption/transfer
(Ka,Kb,Ksl,Kll) |
0.46 / 4.56 / 1.16 / 4.56 /h | SI2, absorption/transfer rates |
Microbial DHD/S-equol/O-DMA Vmax (producers) |
0.024 / 0.009 / 0.001 umol/h/g feces | Table 2, producers column |
Microbial DHD/S-equol/O-DMA Km (producers) |
6.24 / 7.24 / 18.07 uM | Table 2, producers column |
S-equol conjugation Vmax (G1/G2/sulfate) |
4.62 / 0.61 / 9.24 nmol/min/mg S9 | Table 3 |
S-equol conjugation Km (G1/G2/sulfate) |
20.28 / 29.39 / 6.50 uM | Table 3 |
S9 protein yields (S9SI, VLS9) |
38.6 / 143 mg/g | SI2 (Cubitt 2011) |
d/dt(li_lumen) microbiota MM conversions |
n/a | SI2, Main model dynamics |
| S-equol sub-model ODEs | n/a | SI2, Sub-model dynamics: equol |
Virtual cohort
This is a deterministic PBPK model: the publication
reports no between-subject variability and no residual error, so there
is no random cohort to draw. Validation is a typical-value replication
of the published predictions. Daidzein enters as a single oral dose into
the small-intestine lumen; a dose of D mg/kg corresponds to
amt = D * 70 * 1000 / 254.23 umol (daidzein MW 254.23
g/mol).
BW <- 70 # kg, reference body weight (model default)
MW_daidzein <- 254.23 # g/mol
MW_equol <- 242.27 # g/mol (C15H14O3), used only for the urinary-excretion mg conversion

dose_umol <- function(mg_per_kg) mg_per_kg * BW * 1000 / MW_daidzein

# Single oral daidzein dose into the small-intestine lumen, observed 0-4 h
# (the window Wang 2022 reports Cmax and AUC(0-4h) over, Figure 5).
make_events <- function(mg_per_kg, tmax = 4, dt = 0.01) {
  rxode2::et(amt = dose_umol(mg_per_kg), cmt = "si_lumen") |>
    rxode2::et(seq(0, tmax, by = dt))
}
Simulation
The default packaged model is the S-equol producer.
The nonproducer is the same structure with microbial
S-equol formation switched off (VmaxLIEQUc = 0) and the
microbial DHD/O-DMA constants set to the nonproducer column of Table
2.
mod_prod <- rxode2::rxode2(readModelDb("Wang_2022_daidzein_equol_pbpk"))

mod_nonprod <- mod_prod |>
  rxode2::ini(
    VmaxLIEQUc = 0, # no microbial S-equol formation in nonproducers
    VmaxLIDHDc = 0.008, KmLIDHD = 2.55, # Table 2, nonproducers DHD
    VmaxLIODMAc = 0.0007, KmLIODMA = 5.12 # Table 2, nonproducers O-DMA
  )
#> ℹ change initial estimate of `VmaxLIEQUc` to `0`
#> ℹ change initial estimate of `VmaxLIDHDc` to `0.008`
#> ℹ change initial estimate of `KmLIDHD` to `2.55`
#> ℹ change initial estimate of `VmaxLIODMAc` to `7e-04`
#> ℹ change initial estimate of `KmLIODMA` to `5.12`

ev1 <- make_events(1) # 1 mg/kg, the Figure 5 dose
sim_prod <- rxode2::rxSolve(mod_prod, ev1, returnType = "data.frame")
sim_nonprod <- rxode2::rxSolve(mod_nonprod, ev1, returnType = "data.frame")
Replicate published figures
Figure 5 – plasma daidzein and S-equol at 1 mg/kg
# Replicates Figure 5 of Wang 2022: (A) S-equol and (B) daidzein plasma
# concentrations upon oral dosing of 1 mg/kg bw daidzein; solid = producers,
# dashed = nonproducers.
prof <- dplyr::bind_rows(
  data.frame(time = sim_prod$time, daidzein = sim_prod$Cc,
             equol = sim_prod$Cc_equol, group = "producer"),
  data.frame(time = sim_nonprod$time, daidzein = sim_nonprod$Cc,
             equol = sim_nonprod$Cc_equol, group = "nonproducer")
)

ggplot(prof, aes(time, daidzein, linetype = group)) +
  geom_line(color = "steelblue") +
  labs(x = "Time (h)", y = "Daidzein plasma concentration (uM)",
       title = "Figure 5B - daidzein",
       caption = "Replicates Figure 5B of Wang 2022.")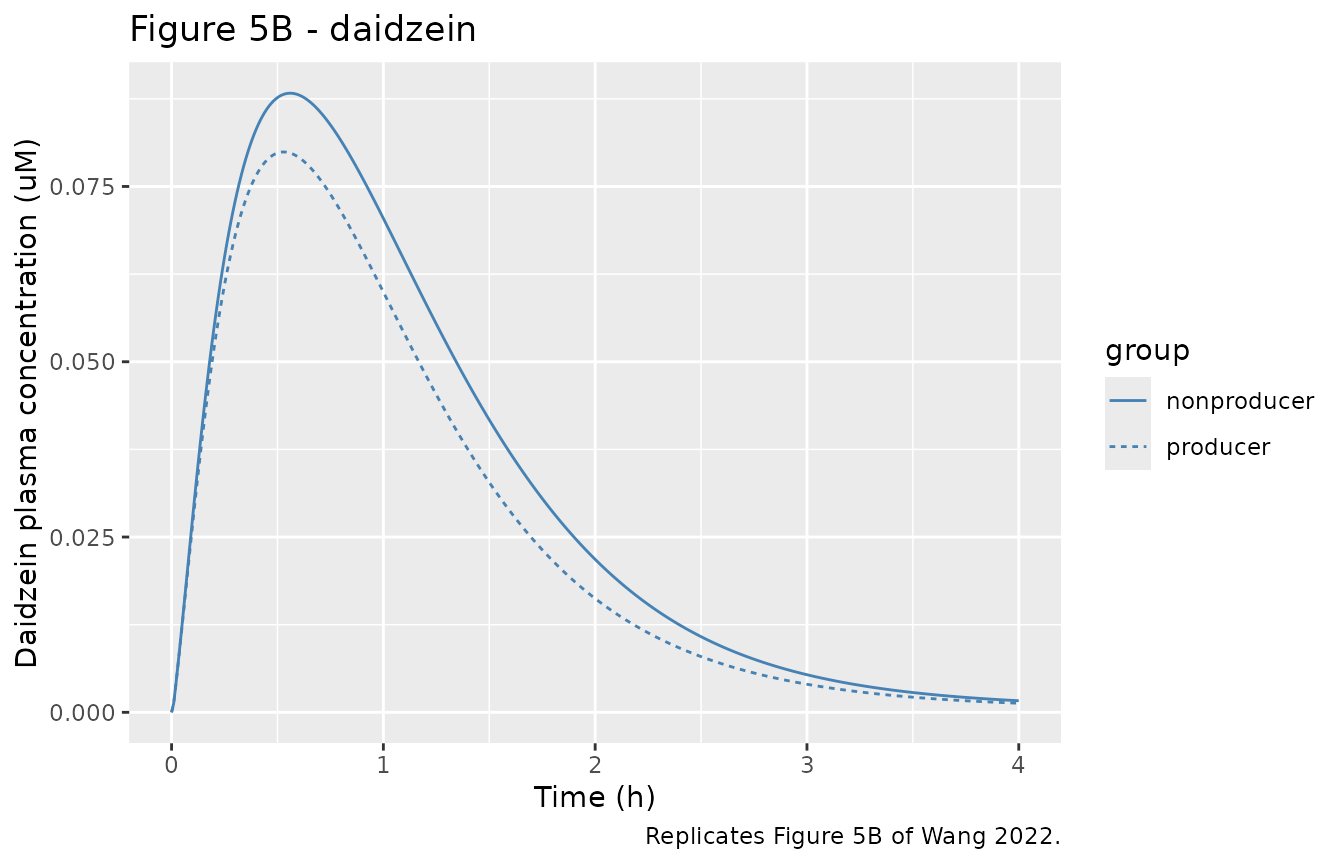
ggplot(dplyr::filter(prof, group == "producer"),
       aes(time, equol * 1000)) +
  geom_line(color = "firebrick") +
  labs(x = "Time (h)", y = "S-equol plasma concentration (nM)",
       title = "Figure 5A - S-equol (producers)",
       caption = "Replicates Figure 5A of Wang 2022. S-equol is ~0 in nonproducers.")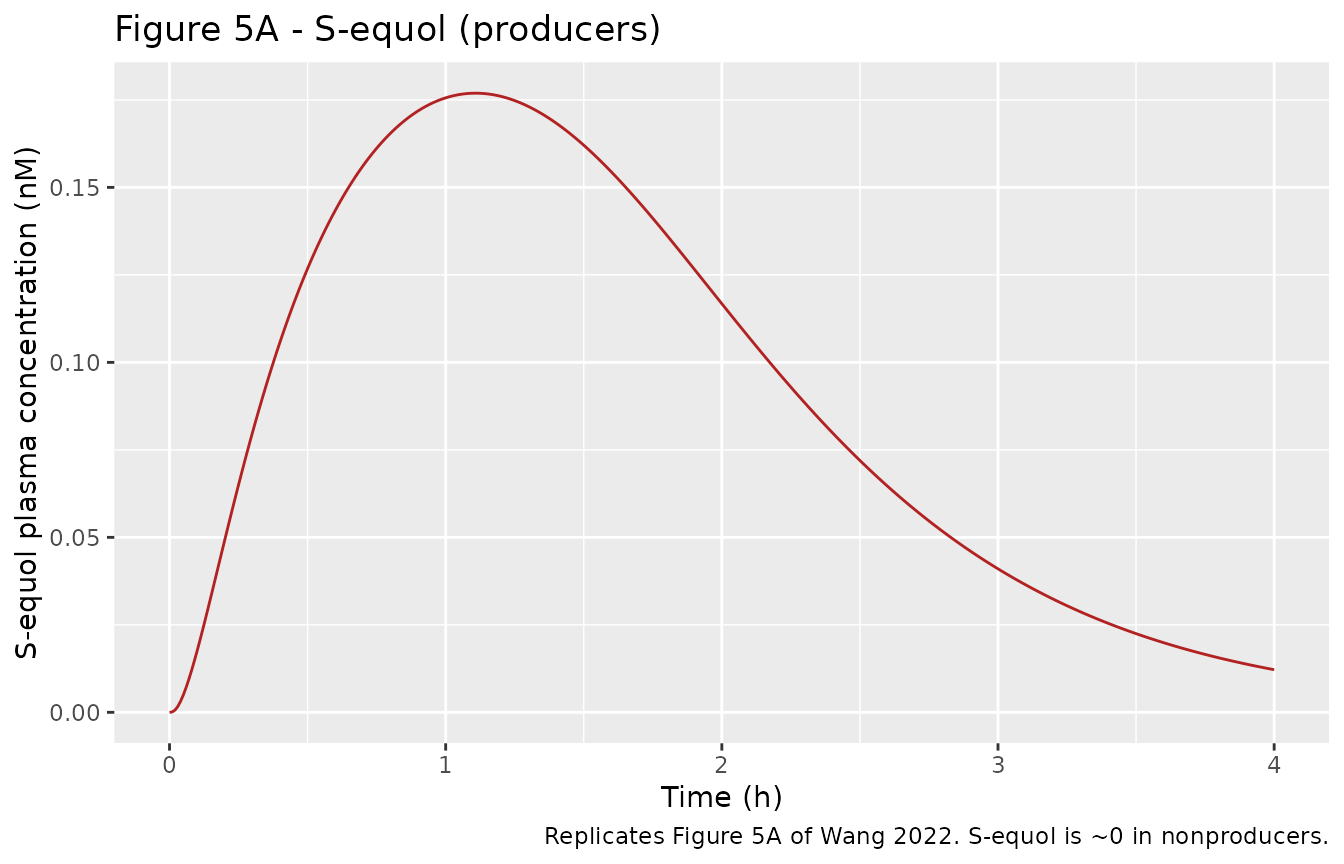
PKNCA validation
PKNCA computes Cmax and Tmax on the simulated plasma profiles. Note that the AUC comparison against the paper is handled separately below, because the AUC values printed in Wang 2022 are blood-amount integrals (see Assumptions and deviations), not the concentration-time integrals PKNCA returns.
pknca_one <- function(sim, conc_col, label) {
  d <- data.frame(id = 1L, time = sim$time, Cc = sim[[conc_col]], treatment = label)
  d <- d |> dplyr::filter(!is.na(Cc))
  d <- dplyr::bind_rows(d, transform(d[1, ], time = 0, Cc = 0)) |>
    dplyr::distinct(id, treatment, time, .keep_all = TRUE) |>
    dplyr::arrange(time)
  conc_obj <- PKNCA::PKNCAconc(d, Cc ~ time | treatment + id)
  dose_df <- data.frame(id = 1L, time = 0, amt = dose_umol(1), treatment = label)
  dose_obj <- PKNCA::PKNCAdose(dose_df, amt ~ time | treatment + id)
  intervals <- data.frame(start = 0, end = 4, cmax = TRUE, tmax = TRUE,
                          auclast = TRUE)
  res <- PKNCA::pk.nca(PKNCA::PKNCAdata(conc_obj, dose_obj, intervals = intervals))
  as.data.frame(res$result)
}

nca_dai_prod <- pknca_one(sim_prod, "Cc", "daidzein, producer")
nca_dai_nonprod <- pknca_one(sim_nonprod, "Cc", "daidzein, nonproducer")
nca_equ_prod <- pknca_one(sim_prod, "Cc_equol", "S-equol, producer")

pknca_summary <- dplyr::bind_rows(nca_dai_prod, nca_dai_nonprod, nca_equ_prod) |>
  dplyr::filter(PPTESTCD %in% c("cmax", "tmax")) |>
  tidyr::pivot_wider(id_cols = treatment, names_from = PPTESTCD, values_from = PPORRES)

pknca_summary |>
  dplyr::rename("Analyte / group" = treatment, "Cmax (uM)" = cmax, "Tmax (h)" = tmax) |>
knitr::kable(digits = 5, caption = "PKNCA Cmax / Tmax from the simulated profiles.")| Analyte / group | Cmax (uM) | Tmax (h) |
|---|---|---|
| daidzein, producer | 0.07992 | 0.53 |
| daidzein, nonproducer | 0.08830 | 0.56 |
| S-equol, producer | 0.00018 | 1.11 |
Comparison against published values
Wang 2022 reports, at 1 mg/kg in producers, daidzein Cmax 0.08 uM and
S-equol Cmax 0.18 nM, with the S-equol Cmax amounting to 0.22% of the
daidzein Cmax; in nonproducers the daidzein Cmax is 0.09 uM. The
reported AUC(0-4 h) values (0.60 for daidzein, 2.02 nmol*h for S-equol
in producers; 0.71 for daidzein in nonproducers) are the deposited
code’s blood-amount integrals (auc_dai,
auc_equol), which the packaged model carries as states.
cmax_dai_prod <- max(sim_prod$Cc)
cmax_equ_prod <- max(sim_prod$Cc_equol)
cmax_dai_nonprod <- max(sim_nonprod$Cc)

comparison <- tibble::tribble(
  ~Quantity, ~Simulated, ~Published,
  "Daidzein Cmax, producer (uM)", round(cmax_dai_prod, 4), 0.08,
  "S-equol Cmax, producer (nM)", round(cmax_equ_prod * 1000, 4), 0.18,
  "S-equol / daidzein Cmax ratio (%)", round(100 * cmax_equ_prod / cmax_dai_prod, 3), 0.22,
  "Daidzein Cmax, nonproducer (uM)", round(cmax_dai_nonprod, 4), 0.09,
  "Daidzein AUC(0-4h), producer (umol*h)", round(tail(sim_prod$auc_dai, 1), 3), 0.60,
  "S-equol AUC(0-4h), producer (nmol*h)", round(tail(sim_prod$auc_equol, 1) * 1000, 3), 2.02,
  "Daidzein AUC(0-4h), nonproducer (umol*h)", round(tail(sim_nonprod$auc_dai, 1), 3), 0.71
)
knitr::kable(comparison, caption = "Simulated vs. published (Wang 2022, Figure 5 text).")| Quantity | Simulated | Published |
|---|---|---|
| Daidzein Cmax, producer (uM) | 0.0799 | 0.08 |
| S-equol Cmax, producer (nM) | 0.1769 | 0.18 |
| S-equol / daidzein Cmax ratio (%) | 0.2210 | 0.22 |
| Daidzein Cmax, nonproducer (uM) | 0.0883 | 0.09 |
| Daidzein AUC(0-4h), producer (umol*h) | 0.5990 | 0.60 |
| S-equol AUC(0-4h), producer (nmol*h) | 2.0200 | 2.02 |
| Daidzein AUC(0-4h), nonproducer (umol*h) | 0.7050 | 0.71 |
# Structural gate: the typical-value predictions match the published point
# values closely. These are deterministic (no random cohort), so tight
# tolerances are appropriate.
stopifnot(
  abs(cmax_dai_prod - 0.08) < 0.01,
  abs(cmax_equ_prod * 1000 - 0.18) < 0.02,
  abs(100 * cmax_equ_prod / cmax_dai_prod - 0.22) < 0.02,
  abs(cmax_dai_nonprod - 0.09) < 0.01,
  abs(tail(sim_prod$auc_dai, 1) - 0.60) < 0.03,
  abs(tail(sim_prod$auc_equol, 1) * 1000 - 2.02) < 0.1,
  abs(tail(sim_nonprod$auc_dai, 1) - 0.71) < 0.05
)
Mass balance
The deposited code carries a mass-balance diagnostic. Summing every daidzein state (parent plus all cumulative metabolite amounts) must equal the administered dose at all times.
mb_cols <- c("si_lumen", "si_tissue", "a_si_dai7g", "a_si_dai4ig", "a_si_dais",
             "li_lumen", "a_dhd", "a_equol_formed", "a_odma", "liver",
             "a_liv_dai7g", "a_liv_dai4ig", "a_liv_dais", "fat", "rapid",
             "slow", "blood")
calc <- rowSums(sim_prod[, mb_cols])
rel_err <- max(abs(calc - dose_umol(1)) / dose_umol(1))
cat(sprintf("Max relative daidzein mass-balance error over 0-4 h: %.3g%%\n",
            100 * rel_err))
#> Max relative daidzein mass-balance error over 0-4 h: 1.24e-13%
stopifnot(rel_err < 1e-4)
Table 4 – cumulative 24 h S-equol urinary excretion
Wang 2022 Table 4 compares the model-predicted 24 h urinary excretion of S-equol (as its glucuronide and sulfate conjugates) with reported in vivo values, at four daidzein doses. The conjugates are assumed to be excreted in urine, so the model prediction is the summed cumulative liver conjugate amount, converted from umol to mg with the S-equol molecular weight.
equol_urine_mg <- function(mg_per_kg) {
  s <- rxode2::rxSolve(mod_prod, make_events(mg_per_kg, tmax = 24, dt = 0.05),
                       returnType = "data.frame")
  conj_umol <- tail(s$a_liv_equg1 + s$a_liv_equg2 + s$a_liv_equs, 1)
  conj_umol * MW_equol / 1000 # umol -> mg
}

table4 <- tibble::tribble(
  ~dose_mgkg, ~reported_mg, ~paper_model_mg,
  0.13, 0.50, 0.68,
  0.05, 0.33, 0.28,
  0.10, 0.80, 0.53,
  0.19, 1.43, 0.98
) |>
  dplyr::mutate(this_model_mg = round(vapply(dose_mgkg, equol_urine_mg, numeric(1)), 3),
                ratio_vs_reported = round(this_model_mg / reported_mg, 2))

table4 |>
  dplyr::rename("Dose (mg/kg)" = dose_mgkg, "Reported in vivo (mg)" = reported_mg,
                "Wang 2022 model (mg)" = paper_model_mg,
                "This model (mg)" = this_model_mg, "Ratio pred/obs" = ratio_vs_reported) |>
knitr::kable(caption = "Table 4 - 24 h urinary S-equol excretion (producers).")| Dose (mg/kg) | Reported in vivo (mg) | Wang 2022 model (mg) | This model (mg) | Ratio pred/obs |
|---|---|---|---|---|
| 0.13 | 0.50 | 0.68 | 0.708 | 1.42 |
| 0.05 | 0.33 | 0.28 | 0.293 | 0.89 |
| 0.10 | 0.80 | 0.53 | 0.560 | 0.70 |
| 0.19 | 1.43 | 0.98 | 0.977 | 0.68 |
Assumptions and deviations
-
AUC units in the paper. Wang 2022 reports AUC(0-4
h) as 0.60 “umolh/L” (daidzein) and 2.02 ”nmolh/L” (S-equol) at
1 mg/kg. These values are the deposited Berkeley Madonna code’s
AUCstates, defined there asAUC' = AB– the time integral of the blood amount (umolh), not of the concentration (which would be umolh/L). The packaged model carries the same amount integrals asauc_daiandauc_equoland reproduces the printed numbers exactly (0.599 and 2.020); the “/L” in the paper’s unit label is therefore spurious. The concentration-time integral (what PKNCA would call AUClast) is smaller by the blood-volume factor (~5.53 L) and is not the quantity the paper tabulates. - Producer vs. nonproducer. The packaged default is the S-equol producer, matching the deposited code. The nonproducer is reproduced here by zeroing microbial S-equol formation and switching the microbial DHD/O-DMA constants to the nonproducer column of Table 2; the maintainers did not ship a second file because the structure is identical.
- S-equol molecular weight. The umol->mg conversion for the Table 4 urinary comparison uses the S-equol molecular weight 242.27 g/mol (C15H14O3), a standard chemical constant not printed in the paper. It affects only the urinary-excretion display, not the model dynamics.
-
Non-perfused tissue. The deposited code defines a
non-perfused tissue fraction (
VNc = 0.071, hair/nails/bone) that appears in no differential equation; it is part of the “fractions sum to 1” bookkeeping only and is omitted here as structurally inert. - No IIV / residual error. Wang 2022 is a deterministic in vitro-in silico PBPK and reports neither, so the packaged model has no random effects.
- Literature check. No correction or erratum notice was found for this article as of 2026-09-30. ```