Malnutrition physiological scaling parameters for PBPK (Sjogren 2021)
Source:vignettes/articles/Sjogren_2021_malnutrition_physiology.Rmd
Sjogren_2021_malnutrition_physiology.RmdModel and source
- Citation: Sjogren E, Tarning J, Barnes KI, Jonsson EN. A Physiologically-Based Pharmacokinetic Framework for Prediction of Drug Exposure in Malnourished Children. Pharmaceutics. 2021;13(2):204. doi:10.3390/pharmaceutics13020204.
- Article (open access): https://doi.org/10.3390/pharmaceutics13020204
Sjogren 2021 is not a drug model. It builds a physiologically based bridge from a healthy to a malnourished population for whole-body physiologically based pharmacokinetic (PBPK) modelling. Its own contribution is a set of physiological scaling parameters (PSPs): multiplicative factors, one per system parameter, that turn the physiology of a non-malnourished individual into that of a malnourished one at three levels of malnutrition (mild, intermediate and severe; Table 2). The authors derived the PSPs from two adult studies (Table 1), then multiplied them onto virtual pediatric populations generated by PK-Sim, and evaluated the result against six drugs studied in malnourished children.
The PSP layer is published in full as numbers and is what this package extracts. Each output of the model is a PSP; multiply it onto the matching quantity of an age-appropriate non-malnourished physiology.
What is deliberately not extracted, and why
The six drug models (caffeine, cefoxitin, ciprofloxacin, lumefantrine, pyrimethamine and sulfadoxine) were built in PK-Sim 8.0 on its generic 15-organ whole-body model, and the paper describes that structure only in prose (Methods 2.2). Table 4 gives compound-card inputs – lipophilicity, fraction unbound, pKa, solubility, intestinal permeability and elimination constants – but tissue:plasma partitioning is given only as the name of a PK-Sim method (“PK-Sim Standard” or “Rodgers and Rowland”), several inputs are “as per PK-Sim library value”, the pediatric virtual populations come from PK-Sim’s internal population algorithm, and no project file was deposited (Data Availability Statement: “Data sharing not applicable”). None of the drug layer can therefore be reproduced outside that platform. For the same reason the virtual-population z-score comparisons of Figures 2-4 and the drug profiles of Figures 5-8 are not replicated here.
Population
The PSPs were computed from two adult studies summarised in Table 1:
- Barac-Nieto et al. (ref 18): 49 Colombian men graded into mild, intermediate and severe nutritional impairment (body weight / height 89.5 %, 82.7 % and 73.9 % of standard). Source of the serum albumin, hematocrit, fat mass and total blood volume changes.
- Bosy-Westphal et al. (ref 19): 39 Dutch men and women, underweight vs intermediate weight. Source of the brain, heart, liver, spleen and kidney masses, bone mineral content, lean soft-tissue trunk mass and skeletal muscle mass.
No suitable data set for malnourished children was found, so the paper assumes that the relative physiological change caused by malnutrition in adults also applies to children. The ICRP 30-year-old man (176 cm, 73 kg) is the non-malnourished reference. The paper checked the scaling against 131 severely malnourished and 266 non-malnourished Malian and Nigerien children aged 6-59 months (ref 23), and chose severe malnutrition for every PK evaluation because it moved a virtual 46-48-month-old population to a mean weight-for-height z-score of about -3.
The same information is available programmatically as
readModelDb("Sjogren_2021_malnutrition_physiology")()$population.
Source trace
| Model element | Source location | Value / form |
|---|---|---|
Every psp_<component>_<level> in
ini() (48 values) |
Table 2 (page 9) | One fixed value per component and level; the ‘Not Malnourished’ column is 1 throughout |
psp_<component> = 1 + sum(level indicator * (psp - 1)) |
Table 2 layout; Methods 2.3.1 (“scaling the system parameters of each virtual individual … to the developed set of PSPs”) | Mutually exclusive level indicators, 1 when not malnourished |
psp_gonads, psp_intestine,
psp_lung, psp_stomach share one factor |
Table 2 row ‘Gonads, intestines, lung, stomach’; Methods 2.3.2 (lean body mass as surrogate) | psp_leanorg |
psp_albumin, psp_aag share the
plasma-protein factor |
Table 2 row ‘Plasma proteins’; Methods 2.3.2 (“Equal effect of nutrition status on alpha-1-acid glycoprotein levels as for albumin was assumed”) | psp_plasmaprot |
| Organ PSP derivation | Equation 1 (page 4) |
PSP = (Xr,M / Xt,M) / (Xr,N / Xt,N); recovered from the
page image, the text converters drop it |
| Plasma-protein PSP derivation | Methods 2.3.2 and Table 1 | Barac-Nieto albumin over the 4.25 g/100 mL reference |
| Skin PSP derivation | Methods 2.3.2 | Ratio of Du Bois body surface area,
BSA = 0.007184 * BWT^0.425 * HT^0.725
|
| Mild / intermediate values where only severe was measured | Methods 2.3.2 (“Linear extrapolations based on adjusted BWT/HT ratios”) | Checked below |
| Consequences for a 30-year-old man | Table 3 (page 9) | Reproduced below |
Parameter table
| name | est | label |
|---|---|---|
| psp_bone_mild | 0.947 | PSP for bone volume, mild malnutrition (ratio) |
| psp_bone_mod | 0.913 | PSP for bone volume, intermediate malnutrition (ratio) |
| psp_bone_sev | 0.869 | PSP for bone volume, severe malnutrition (ratio) |
| psp_brain_mild | 0.918 | PSP for brain volume, mild malnutrition (ratio) |
| psp_brain_mod | 0.865 | PSP for brain volume, intermediate malnutrition (ratio) |
| psp_brain_sev | 0.797 | PSP for brain volume, severe malnutrition (ratio) |
| psp_fat_mild | 0.817 | PSP for fat (adipose) volume, mild malnutrition (ratio) |
| psp_fat_mod | 0.822 | PSP for fat (adipose) volume, intermediate malnutrition (ratio) |
| psp_fat_sev | 0.624 | PSP for fat (adipose) volume, severe malnutrition (ratio) |
| psp_leanorg_mild | 0.936 | PSP for gonads, intestines, lung and stomach volumes, mild malnutrition (ratio) |
| psp_leanorg_mod | 0.894 | PSP for gonads, intestines, lung and stomach volumes, intermediate malnutrition (ratio) |
| psp_leanorg_sev | 0.840 | PSP for gonads, intestines, lung and stomach volumes, severe malnutrition (ratio) |
| psp_heart_mild | 0.902 | PSP for heart volume, mild malnutrition (ratio) |
| psp_heart_mod | 0.839 | PSP for heart volume, intermediate malnutrition (ratio) |
| psp_heart_sev | 0.758 | PSP for heart volume, severe malnutrition (ratio) |
| psp_kidney_mild | 0.874 | PSP for kidney volume, mild malnutrition (ratio) |
| psp_kidney_mod | 0.792 | PSP for kidney volume, intermediate malnutrition (ratio) |
| psp_kidney_sev | 0.686 | PSP for kidney volume, severe malnutrition (ratio) |
| psp_liver_mild | 0.872 | PSP for liver volume, mild malnutrition (ratio) |
| psp_liver_mod | 0.789 | PSP for liver volume, intermediate malnutrition (ratio) |
| psp_liver_sev | 0.682 | PSP for liver volume, severe malnutrition (ratio) |
| psp_muscle_mild | 0.893 | PSP for muscle volume, mild malnutrition (ratio) |
| psp_muscle_mod | 0.771 | PSP for muscle volume, intermediate malnutrition (ratio) |
| psp_muscle_sev | 0.715 | PSP for muscle volume, severe malnutrition (ratio) |
| psp_pancreas_mild | 0.936 | PSP for pancreas volume, mild malnutrition (ratio) |
| psp_pancreas_mod | 0.894 | PSP for pancreas volume, intermediate malnutrition (ratio) |
| psp_pancreas_sev | 0.840 | PSP for pancreas volume, severe malnutrition (ratio) |
| psp_skin_mild | 0.954 | PSP for skin volume, mild malnutrition (ratio) |
| psp_skin_mod | 0.922 | PSP for skin volume, intermediate malnutrition (ratio) |
| psp_skin_sev | 0.879 | PSP for skin volume, severe malnutrition (ratio) |
| psp_spleen_mild | 0.844 | PSP for spleen volume, mild malnutrition (ratio) |
| psp_spleen_mod | 0.743 | PSP for spleen volume, intermediate malnutrition (ratio) |
| psp_spleen_sev | 0.612 | PSP for spleen volume, severe malnutrition (ratio) |
| psp_blood_art_mild | 1.030 | PSP for arterial blood volume, mild malnutrition (ratio) |
| psp_blood_art_mod | 0.992 | PSP for arterial blood volume, intermediate malnutrition (ratio) |
| psp_blood_art_sev | 0.833 | PSP for arterial blood volume, severe malnutrition (ratio) |
| psp_blood_ven_mild | 1.020 | PSP for venous blood volume, mild malnutrition (ratio) |
| psp_blood_ven_mod | 0.979 | PSP for venous blood volume, intermediate malnutrition (ratio) |
| psp_blood_ven_sev | 0.822 | PSP for venous blood volume, severe malnutrition (ratio) |
| psp_blood_portal_mild | 1.020 | PSP for portal-vein blood volume, mild malnutrition (ratio) |
| psp_blood_portal_mod | 0.982 | PSP for portal-vein blood volume, intermediate malnutrition (ratio) |
| psp_blood_portal_sev | 0.825 | PSP for portal-vein blood volume, severe malnutrition (ratio) |
| psp_plasmaprot_mild | 0.894 | PSP for plasma-protein (albumin, AAG) concentration, mild malnutrition (ratio) |
| psp_plasmaprot_mod | 0.706 | PSP for plasma-protein (albumin, AAG) concentration, intermediate malnutrition (ratio) |
| psp_plasmaprot_sev | 0.494 | PSP for plasma-protein (albumin, AAG) concentration, severe malnutrition (ratio) |
| psp_hct_mild | 0.945 | PSP for hematocrit, mild malnutrition (ratio) |
| psp_hct_mod | 0.791 | PSP for hematocrit, intermediate malnutrition (ratio) |
| psp_hct_sev | 0.681 | PSP for hematocrit, severe malnutrition (ratio) |
Simulation
The model has no states and no time dependence. One row per malnutrition level is enough to return every PSP.
mod <- readModelDb("Sjogren_2021_malnutrition_physiology")

levels_df <- data.frame(
  id = 1:4,
  level = c("Not malnourished", "Mild", "Intermediate", "Severe"),
  MAL_NOURISH_MILD = c(0, 1, 0, 0),
  MAL_NOURISH_MOD = c(0, 0, 1, 0),
  MAL_NOURISH_SEV = c(0, 0, 0, 1)
)
ev <- levels_df |>
  dplyr::mutate(time = 0, evid = 0, amt = 0) |>
  dplyr::select(id, time, evid, amt, MAL_NOURISH_MILD, MAL_NOURISH_MOD, MAL_NOURISH_SEV)

sim <- rxode2::rxSolve(mod, ev, returnType = "data.frame", keep = "id") |>
  dplyr::left_join(levels_df[, c("id", "level")], by = "id")
#> Warning: 'keep' contains id
#> which are output when needed, ignoring these items
stopifnot(nrow(sim) == 4)
Validation
1. Exact reproduction of Table 2
components <- c(
  "bone", "brain", "fat", "leanorg", "heart", "kidney", "liver", "muscle",
  "pancreas", "skin", "spleen", "blood_art", "blood_ven", "blood_portal",
  "plasmaprot", "hct"
)
# Sjogren 2021 Table 2, columns Not Malnourished / Mild / Intermediate / Severe.
table2 <- tibble::tribble(
  ~component,     ~nm, ~mild, ~mod,  ~sev,
  "bone",         1,   0.947, 0.913, 0.869,
  "brain",        1,   0.918, 0.865, 0.797,
  "fat",          1,   0.817, 0.822, 0.624,
  "leanorg",      1,   0.936, 0.894, 0.84,
  "heart",        1,   0.902, 0.839, 0.758,
  "kidney",       1,   0.874, 0.792, 0.686,
  "liver",        1,   0.872, 0.789, 0.682,
  "muscle",       1,   0.893, 0.771, 0.715,
  "pancreas",     1,   0.936, 0.894, 0.84,
  "skin",         1,   0.954, 0.922, 0.879,
  "spleen",       1,   0.844, 0.743, 0.612,
  "blood_art",    1,   1.03,  0.992, 0.833,
  "blood_ven",    1,   1.02,  0.979, 0.822,
  "blood_portal", 1,   1.02,  0.982, 0.825,
  "plasmaprot",   1,   0.894, 0.706, 0.494,
  "hct",          1,   0.945, 0.791, 0.681
) |>
  tidyr::pivot_longer(-component, names_to = "lvl", values_to = "published") |>
  dplyr::mutate(level = c(
    nm = "Not malnourished", mild = "Mild", mod = "Intermediate", sev = "Severe"
  )[lvl])

model_psp <- sim |>
  dplyr::select(level, dplyr::all_of(paste0("psp_", components))) |>
  tidyr::pivot_longer(-level, names_to = "component", values_to = "model") |>
  dplyr::mutate(component = sub("^psp_", "", component))

chk2 <- dplyr::inner_join(table2, model_psp, by = c("component", "level"))
# 16 components x 4 levels; a lost row would make the gate pass vacuously.
stopifnot(nrow(chk2) == 64)
# Deterministic algebra on the published cells: machine precision.
stopifnot(all(abs(chk2$model - chk2$published) < 1e-12))

# The shared factors are exactly the shared rows.
stopifnot(
  all(sim$psp_gonads == sim$psp_leanorg),
  all(sim$psp_intestine == sim$psp_leanorg),
  all(sim$psp_lung == sim$psp_leanorg),
  all(sim$psp_stomach == sim$psp_leanorg),
  all(sim$psp_albumin == sim$psp_plasmaprot),
  all(sim$psp_aag == sim$psp_plasmaprot)
)
chk2 |>
  dplyr::filter(level != "Not malnourished") |>
  dplyr::mutate(
    level = factor(level, levels = c("Mild", "Intermediate", "Severe")),
    component = factor(component, levels = rev(components))
  ) |>
  ggplot(aes(x = model, y = component, colour = level)) +
  geom_vline(xintercept = 1, linetype = "dashed", colour = "grey50") +
  geom_point(size = 2.5) +
  labs(x = "Physiological scaling parameter (malnourished / non-malnourished)", y = NULL, colour = "Malnutrition") +
  theme_bw()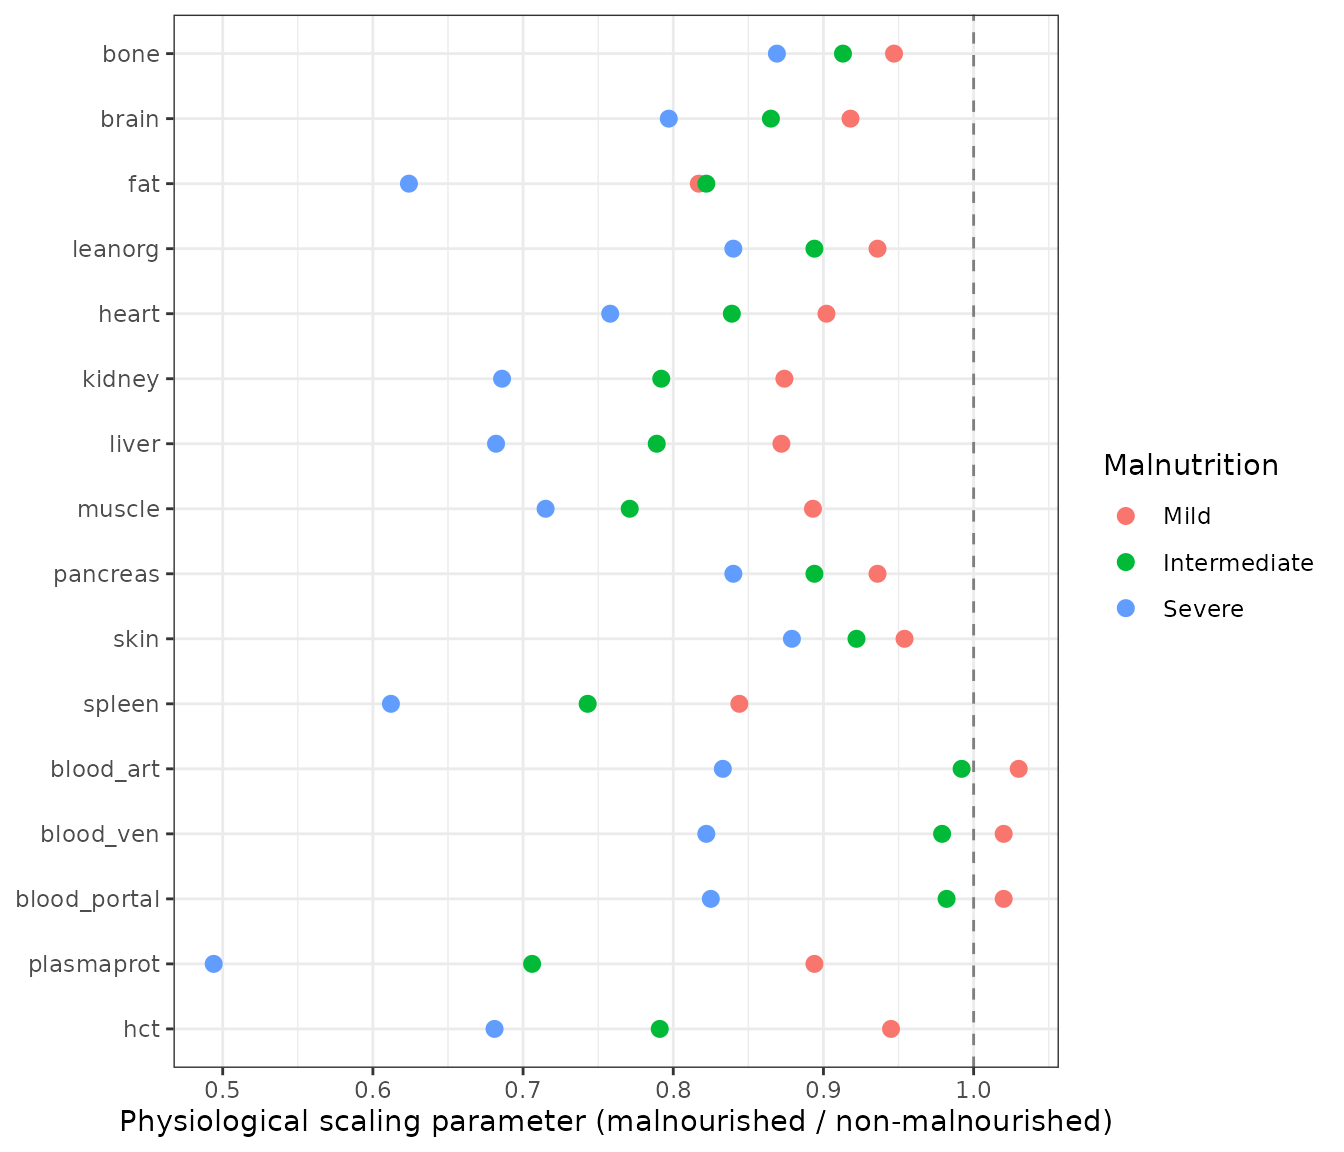
Replicates Table 2 of Sjogren 2021: physiological scaling parameters by component and malnutrition level (not malnourished = 1).
2. The PSPs agree with the derivations the paper describes
Three of the derivation rules in Methods 2.3.2 can be re-run from numbers the paper prints. They check the transcription of Table 2 against independent printed values (Tables 1 and 3), not against itself.
sev <- sim[sim$level == "Severe", ]
mild <- sim[sim$level == "Mild", ]
int <- sim[sim$level == "Intermediate", ]

# (a) Plasma proteins: Barac-Nieto serum albumin (Table 1: 3.8 / 3 / 2.1 g/100 mL)
#     over the 4.25 g/100 mL non-malnourished reference.
albumin_psp <- c(3.8, 3, 2.1) / 4.25
model_pp <- c(mild$psp_plasmaprot, int$psp_plasmaprot, sev$psp_plasmaprot)
stopifnot(all(abs(round(albumin_psp, 3) - model_pp) < 1e-12))

# (b) Skin: ratio of Du Bois BSA at constant height, i.e. (BWT_M / BWT_N)^0.425,
#     with the Table 3 body weights (73.0 -> 65.3 / 60.3 / 53.9 kg).
skin_psp <- (c(65.3, 60.3, 53.9) / 73)^0.425
model_skin <- c(mild$psp_skin, int$psp_skin, sev$psp_skin)
stopifnot(all(abs(round(skin_psp, 3) - model_skin) < 1e-12))

# (c) Linear extrapolation in the adjusted BWT/HT ratio for the organs measured
#     only at severe malnutrition: PSP = 1 - slope * (1 - r), with r the
#     Barac-Nieto percent of standard BWT/HT (Table 1: 89.5 / 82.7 / 73.9 %).
r <- c(mild = 0.895, int = 0.827, sev = 0.739)
lin_organs <- c("bone", "brain", "leanorg", "heart", "kidney", "liver", "pancreas", "spleen")
lin <- do.call(rbind, lapply(lin_organs, function(o) {
  p_sev <- sev[[paste0("psp_", o)]]
  slope <- (1 - p_sev) / (1 - r[["sev"]])
  data.frame(
    component = o,
    mild_pred = 1 - slope * (1 - r[["mild"]]),
    mild_pub = mild[[paste0("psp_", o)]],
    int_pred = 1 - slope * (1 - r[["int"]]),
    int_pub = int[[paste0("psp_", o)]]
  )
}))
stopifnot(nrow(lin) == length(lin_organs))
# Rounding of the 3-decimal published PSPs allows at most ~1 unit in the
# last place after propagation through the slope.
stopifnot(
  all(abs(lin$mild_pred - lin$mild_pub) <= 0.0015),
  all(abs(lin$int_pred - lin$int_pub) <= 0.0015)
)
lin |>
  dplyr::rename(
    "Component" = component,
    "Mild, extrapolated" = mild_pred, "Mild, Table 2" = mild_pub,
    "Intermediate, extrapolated" = int_pred, "Intermediate, Table 2" = int_pub
  ) |>
knitr::kable(digits = 3)| Component | Mild, extrapolated | Mild, Table 2 | Intermediate, extrapolated | Intermediate, Table 2 |
|---|---|---|---|---|
| bone | 0.947 | 0.947 | 0.913 | 0.913 |
| brain | 0.918 | 0.918 | 0.865 | 0.865 |
| leanorg | 0.936 | 0.936 | 0.894 | 0.894 |
| heart | 0.903 | 0.902 | 0.840 | 0.839 |
| kidney | 0.874 | 0.874 | 0.792 | 0.792 |
| liver | 0.872 | 0.872 | 0.789 | 0.789 |
| pancreas | 0.936 | 0.936 | 0.894 | 0.894 |
| spleen | 0.844 | 0.844 | 0.743 | 0.743 |
Muscle and fat are not on the line (muscle mild 0.893 vs 0.885 extrapolated, intermediate 0.771 vs 0.811): the paper adjusted those two PSPs so that the scaled organ weights add up to the target body weight (Methods 2.3.2). The hematocrit PSPs imply a constant non-malnourished reference hematocrit, which the paper does not print:
3. Reproducing Table 3 by chaining a registry physiology
Table 3 applies the PSPs to the ICRP 30-year-old man of PK-Sim (176
cm, 73 kg). The organ masses of that same individual are the 30-year
male knot of Schlender_2016_aging_physiology, the PK-Sim
adult physiology already in this package. Multiplying each Schlender
organ mass by its Sjogren PSP, and summing, should return the Table 3
body weights – which the paper states were the design target (mild,
intermediate and severe losses of 11 %, 17 % and 26 %).
phys <- readModelDb("Schlender_2016_aging_physiology")
man30 <- rxode2::rxSolve(
  phys,
  data.frame(id = 1, time = 30, evid = 0, amt = 0, SEXF = 0),
  returnType = "data.frame"
)
stopifnot(nrow(man30) == 1, abs(man30$bw - 73) < 1e-9, abs(man30$ht - 176) < 1e-9)

# Schlender organ -> Sjogren PSP. Schlender pools arterial, venous and
# portal blood into one mass; the venous PSP (the largest pool) is used.
# The constant GI mass is stomach + intestines.
organ_map <- c(
  mass_blood = "psp_blood_ven", mass_bone = "psp_bone", mass_brain = "psp_brain",
  mass_fat = "psp_fat", mass_gonads = "psp_gonads", mass_heart = "psp_heart",
  mass_kidney = "psp_kidney", mass_liver = "psp_liver", mass_lung = "psp_lung",
  mass_muscle = "psp_muscle", mass_pancreas = "psp_pancreas", mass_skin = "psp_skin",
  mass_spleen = "psp_spleen", mass_gi = "psp_intestine"
)
masses <- unlist(man30[names(organ_map)])
remainder_g <- 1000 * man30$bw - sum(masses)
remainder_g
#> [1] 155.5

table3 <- sim |>
  dplyr::rowwise() |>
  dplyr::mutate(
    bwt = (sum(masses * unlist(dplyr::pick(dplyr::all_of(unname(organ_map))))) + remainder_g) / 1000
  ) |>
  dplyr::ungroup() |>
  dplyr::mutate(
    ht = man30$ht,
    bmi = bwt / (ht / 100)^2,
    bwt_ht = bwt / (ht / 100),
    bsa = 0.007184 * bwt^0.425 * ht^0.725
  ) |>
  dplyr::select(level, bwt, ht, bmi, bwt_ht, bsa)

published3 <- data.frame(
  level = c("Not malnourished", "Mild", "Intermediate", "Severe"),
  bwt_pub = c(73.0, 65.3, 60.3, 53.9),
  bmi_pub = c(23.6, 21.1, 19.5, 17.4),
  bwt_ht_pub = c(41.4, 37.1, 34.3, 30.6),
  bsa_pub = c(1.9, 1.8, 1.7, 1.7)
)
chk3 <- dplyr::inner_join(table3, published3, by = "level")
stopifnot(nrow(chk3) == 4)

chk3 |>
  dplyr::mutate(bwt_pct_diff = 100 * (bwt - bwt_pub) / bwt_pub) |>
  dplyr::select(level, bwt, bwt_pub, bwt_pct_diff, bmi, bmi_pub, bwt_ht, bwt_ht_pub, bsa, bsa_pub) |>
  dplyr::rename(
    "Level" = level, "BWT (kg)" = bwt, "BWT, Table 3" = bwt_pub, "BWT % diff" = bwt_pct_diff,
    "BMI" = bmi, "BMI, Table 3" = bmi_pub, "BWT/HT (kg/m)" = bwt_ht,
    "BWT/HT, Table 3" = bwt_ht_pub, "BSA (m2)" = bsa, "BSA, Table 3" = bsa_pub
  ) |>
knitr::kable(digits = 2)| Level | BWT (kg) | BWT, Table 3 | BWT % diff | BMI | BMI, Table 3 | BWT/HT (kg/m) | BWT/HT, Table 3 | BSA (m2) | BSA, Table 3 |
|---|---|---|---|---|---|---|---|---|---|
| Not malnourished | 73.00 | 73.0 | 0.00 | 23.57 | 23.6 | 41.48 | 41.4 | 1.89 | 1.9 |
| Mild | 65.32 | 65.3 | 0.04 | 21.09 | 21.1 | 37.12 | 37.1 | 1.80 | 1.8 |
| Intermediate | 60.36 | 60.3 | 0.09 | 19.49 | 19.5 | 34.29 | 34.3 | 1.74 | 1.7 |
| Severe | 53.95 | 53.9 | 0.08 | 17.42 | 17.4 | 30.65 | 30.6 | 1.66 | 1.7 |
# A mis-transcribed muscle or fat PSP (together ~65 % of body weight) moves the
# total by kilograms; the chained reconstruction must land within 0.5 %.
mal3 <- chk3[chk3$level != "Not malnourished", ]
stopifnot(
  nrow(mal3) == 3,
  all(abs(chk3$bwt - chk3$bwt_pub) / chk3$bwt_pub < 0.005),
  all(abs(round(chk3$bmi, 1) - chk3$bmi_pub) <= 0.1),
  all(abs(round(mal3$bwt_ht, 1) - mal3$bwt_ht_pub) <= 0.1),
  all(round(chk3$bsa, 1) == chk3$bsa_pub)
)
# The printed non-malnourished BWT/HT (41.4) is the paper's own rounding
# slip: 73.0 kg / 1.76 m = 41.48, which rounds to 41.5, and the same row's
# BMI (23.6) confirms 73.0 kg. Gate the discrepancy so a later edit cannot
# silently hide or change it.
stopifnot(
  round(73.0 / 1.76, 1) == 41.5,
  chk3$bwt_ht_pub[chk3$level == "Not malnourished"] == 41.4
)
The non-malnourished row closes by construction (the unscaled remainder is defined from it). The three malnourished rows are genuine predictions: the Schlender organ masses come from a different paper, and only the PSPs come from Sjogren 2021.
Using the PSPs
Each PSP multiplies the corresponding non-malnourished quantity. For
a PBPK model with explicit organ volumes, scale each volume by its PSP;
scale albumin and alpha-1-acid glycoprotein concentrations by
psp_albumin / psp_aag and the hematocrit by
psp_hct. The paper keeps tissue composition (the volume
fractions of water, lipids and proteins used to compute partition
coefficients) out of the PSP set (Methods 2.3.2), and Table 2 has no
blood-flow rows.
# Severely malnourished organ masses of the 30-year-old reference man (g).
sev_masses <- masses * unlist(sim[sim$level == "Severe", unname(organ_map)])
data.frame(
  organ = sub("^mass_", "", names(masses)),
  not_malnourished_g = masses,
  severe_g = sev_masses
) |>
  dplyr::rename("Organ" = organ, "Not malnourished (g)" = not_malnourished_g, "Severe (g)" = severe_g) |>
knitr::kable(digits = 1, row.names = FALSE)| Organ | Not malnourished (g) | Severe (g) |
|---|---|---|
| blood | 2264.6 | 1861.5 |
| bone | 11817.8 | 10269.7 |
| brain | 1508.8 | 1202.5 |
| fat | 14868.0 | 9277.6 |
| gonads | 40.3 | 33.9 |
| heart | 417.2 | 316.2 |
| kidney | 437.7 | 300.3 |
| liver | 2357.8 | 1608.0 |
| lung | 1294.3 | 1087.2 |
| muscle | 32338.6 | 23122.1 |
| pancreas | 190.3 | 159.9 |
| skin | 3760.9 | 3305.8 |
| spleen | 243.4 | 149.0 |
| gi | 1304.8 | 1096.0 |
Assumptions and deviations
- Only the physiology layer is extracted. The six drug models are PK-Sim models whose partition coefficients, pediatric populations and several inputs are platform-internal, with no project file deposited; see “What is deliberately not extracted” above.
-
Malnutrition level is encoded as three mutually exclusive
indicators (
MAL_NOURISH_MILD,MAL_NOURISH_MOD,MAL_NOURISH_SEV; all 0 = not malnourished). The paper’s “intermediate” level is carried on the_MODmember of the severity-suffix family. Setting more than one indicator to 1 is not meaningful and is not trapped by the model. - Fat PSP is not monotone in severity as printed (mild 0.817, intermediate 0.822). The paper adjusted fat and muscle to make the scaled organ weights add up to the target body weight, so the printed values are kept.
- The severe organ PSPs cannot be re-derived here. Equation 1 corrects the Bosy-Westphal organ ratios for the height difference between study groups with ICRP height-typical organ values, which the paper does not print. The mild and intermediate values of those organs are checked, as linear extrapolations of the severe value (section 2).
- The reference hematocrit is not printed; the three hematocrit PSPs imply one reference of about 47 % (section 2).
-
Table 3 reconstruction. The organ masses come from
Schlender_2016_aging_physiology(the PK-Sim ICRP 30-year-old man). That model pools arterial, venous and portal blood, which is scaled here with the venous PSP; the arterial (0.833) or portal (0.825) value changes the severe body weight by at most 0.03 kg. The 0.16 kg by which the Schlender organ masses fall short of 73 kg is left unscaled. The intermediate body weight reconstructs to 60.4 kg against a printed 60.3 kg (0.1 %). - Table 3 erratum (non-malnourished BWT/HT). The paper prints 41.4 kg/m for the non-malnourished man, but its own 73.0 kg and 176 cm give 41.48 kg/m (41.5), and the BMI of 23.6 on the same row confirms 73.0 kg. The three malnourished BWT/HT values reproduce; the 41.4 is treated as a rounding slip in the paper.
- Adult data, applied to children. The PSPs are derived from adults; their application to pediatric populations is the paper’s own assumption (Methods 2.3.2), not something this model adds.
- No variability. The paper applies the PSPs as fixed factors to every virtual individual; this model returns them as typical values.