Tumor growth dynamics and overall survival in advanced gastric cancer (Terranova 2022, JAVELIN Gastric 100)
Source:vignettes/articles/Terranova_2022_TGD_OS_gastric.Rmd
Terranova_2022_TGD_OS_gastric.RmdModel and source
- Citation: Terranova N, French J, Dai H, Wiens M, Khandelwal A, Ruiz-Garcia A, Manitz J, von Heydebreck A, Ruisi M, Chin K, Girard P, Venkatakrishnan K. Pharmacometric modeling and machine learning analyses of prognostic and predictive factors in the JAVELIN Gastric 100 phase III trial of avelumab. CPT Pharmacometrics Syst Pharmacol. 2022;11(3):333-347. doi:10.1002/psp4.12754.
- Description: Joint tumor growth dynamics (TGD) + overall survival
(OS) disease-progression model for advanced gastric cancer /
gastroesophageal junction cancer (GC/GEJC) developed on the JAVELIN
Gastric 100 phase III trial by Terranova et al. (Merck KGaA / Merck
Institute of Pharmacometrics / EMD Serono / Metrum Research Group). N =
499 patients randomized 1:1 to avelumab 10 mg/kg every 2 weeks (n = 249)
or continued chemotherapy (n = 250) maintenance after 12 weeks of
induction chemotherapy. The paper’s primary finding is NEGATIVE: no
treatment effect on OS or TGD was identified, consistent with the
primary JAVELIN Gastric 100 analysis. Machine learning (random forests +
SIDEScreen + Boruta / permutation / random-splits variable-importance
methods) was used to screen 89 (OS) / 52 (TGD) candidate covariates,
then covariates surviving the ML screen were incorporated into two
parametric sub-models: (1) a Gompertzian TGD model on tumor size
measured by sum of longest diameters (SLD, mm) with the Vaghi 2020 Kd =
slope*Kg + intercept reduced-parameter reformulation, and (2) a
log-logistic parametric time-to-event OS model with an
accelerated-failure-time link to time-invariant covariates on the
log-median-OS scale, a proportional-hazards link to time-varying
laboratory covariates, and a per-arm shape parameter that captures the
crossing of hazard curves between avelumab and chemotherapy. There is NO
drug PK sub-model – avelumab exposure is not carried explicitly; the
treatment arm is encoded as the TRT categorical covariate (1 =
chemotherapy = reference, 2 = avelumab). Extract-scope note: no drug PK;
the two ODE outputs are
tumor(SLD, mm) with proportional residual error andsur(survival probability), driven offd/dt(cumhaz) = hazard. - Article: CPT Pharmacometrics Syst Pharmacol. 2022;11(3):333-347
- Supplement: Data S1 (Figures S1-S14, Supplementary Methods, Tables S1-S7)
This is a joint tumor growth dynamics (TGD) + overall survival (OS) disease-progression model, not a drug-specific PK/PD model. The paper’s primary finding is NEGATIVE: no treatment effect of avelumab (anti-PD-L1 monoclonal antibody) versus continued chemotherapy on either OS or TGD was identified in the JAVELIN Gastric 100 phase III maintenance trial (n = 499). The two ODE-based sub-models are provided to reproduce the paper’s descriptive characterization of gastric-cancer disease progression given a rich covariate set that was screened by machine learning (random forests + Boruta + permutation + random-splits) and retained for parametric fitting.
Population
The cohort is 499 adults with unresectable, HER2-negative, locally advanced or metastatic gastric cancer or gastroesophageal junction cancer who did not progress after 12 weeks of first-line induction chemotherapy (oxaliplatin + a fluoropyrimidine) and were randomized 1:1 to avelumab 10 mg/kg every 2 weeks (n = 249) or continued chemotherapy (n = 250) as maintenance therapy, stratified by region (Asian vs non-Asian). “Baseline” refers to values obtained before the 12-week induction phase; “re-baseline” refers to values at randomization (after induction).
The reference-subject covariate values in the packaged model are taken from Table S3 (avelumab-arm medians / cohort medians as documented per covariate) or Supplementary Methods. Key values:
| Covariate | Reference value | Source |
|---|---|---|
T_DIAG_CANCER time since gastric-cancer diagnosis |
53 days (avelumab arm median) | Supp Methods equation for Kg |
MET_GE3 >= 3 metastatic sites |
0 (< 3 sites; paper centres at NumMet = 3) | Table S3 |
SBP baseline systolic BP |
120 mmHg (population median) | Table S3 |
HR baseline heart rate |
76 beats/min (population median) | Table S3 |
AGE |
62 years (population median) | Table S3 |
ALB baseline albumin |
41 g/dL as reported (population median) | Table S3 |
CRP baseline C-reactive protein |
2 mg/L (paper narrative) | Results, CRP forest plot |
LDH baseline lactate dehydrogenase |
175 IU/L (population median) | Table S3 |
NLR baseline neutrophil-lymphocyte ratio |
3.30 (population median) | Table S3 |
The same metadata is available programmatically:
str(readModelDb("Terranova_2022_TGD_OS_gastric")()$population)
#> ℹ Joint TGD (Gompertzian SLD) + OS (log-logistic parametric TTE) disease-progression model for advanced gastric / GEJC (Terranova 2022, JAVELIN Gastric 100, n=499). No drug PK sub-model. TGD state `tumor` (SLD, mm) with proportional residual error propSd = sqrt(0.0505). OS state `sur` = exp(-cumhaz) driven by d/dt(cumhaz) = hazard, where hazard = log-logistic baseline * time-varying-covariate proportional multiplier. Per-arm shape (2.25 chemo / 1.63 avelumab) via the TRT integer covariate; treatment effect on median OS retained but consistent with null (HR 1.10, 95% CrI 0.935-1.32). Continuous NumMet count binarised to MET_GE3 per the count-covariate-decomposed-to-binary policy; deviation documented in vignette Errata.
#> List of 11
#>  $ species       : chr "human (adults with unresectable, HER2-negative, locally advanced or metastatic gastric cancer / gastroesophagea"| __truncated__
#>  $ n_subjects    : int 499
#>  $ n_studies     : int 1
#>  $ age_range     : chr "21-88 years (median 62, mean 60.6; Table S3 both-arms row)"
#>  $ weight_range  : chr "not reported at the pooled level in this paper (weight was included in the ML covariate screen per Table S1 but"| __truncated__
#>  $ sex_female_pct: num NA
#>  $ race_ethnicity: chr "Asian (Japan / Republic of Korea / Taiwan / Thailand) vs non-Asian; per-region distribution not tabulated at th"| __truncated__
#>  $ disease_state : chr "advanced (unresectable, locally advanced or metastatic) HER2-negative gastric cancer / gastroesophageal junctio"| __truncated__
#>  $ dose_range    : chr "n/a (no drug PK sub-model). Avelumab dose was 10 mg/kg IV every 2 weeks in the maintenance phase; chemotherapy "| __truncated__
#>  $ regions       : chr "multiregional phase III trial (JAVELIN Gastric 100), including Asian and non-Asian regions as a randomization s"| __truncated__
#>  $ notes         : chr "TGD sub-model: Gompertzian ODE `dy/dt = Kg*y - Kd*y*log(y)` with y(0) = BASE, using the Vaghi 2020 reformulatio"| __truncated__
Source trace
The per-parameter origin is also recorded as an in-file comment next
to each ini() entry in
inst/modeldb/therapeuticArea/oncology/Terranova_2022_TGD_OS_gastric.R.
TGD (Gompertzian) sub-model
| Quantity | Value | Source |
|---|---|---|
| Kg typical (1/year) | 0.271 | Table 1 theta_1 |
| BASE typical (mm) | 27.0 | Table 1 theta_2 |
| Slope Kd on Kg (1/mm) | -18.8 | Table 1 theta_3 |
| Intercept for Kd (1/(year*mm)) | 5.18 | Table 1 theta_4 |
| T_DIAG_CANCER power exponent on Kg | -0.00291 | Table 1 theta_5 (Supp Methods eqn) |
| LMET multiplier on Kg | 0.0164 | Table 1 theta_6 |
| MET_GE3 exponential coefficient on BASE | 0.143 | Table 1 theta_7 |
| RESP_NONPDCR multiplier on BASE | -0.0769 | Table 1 theta_8 |
| RESP_SD multiplier on BASE | 0.644 | Table 1 theta_9 |
| Omega(1,1) etalKg | 0.00163 | Table 1 |
| Omega(2,2) etalBase | 0.659 | Table 1 |
| Sigma^2 proportional | 0.0505 | Table 1 |
Gompertz ODE dy/dt = Kg*y - Kd*y*log(y)
|
n/a | Supp Methods eqn 1 |
OS TTE (log-logistic) sub-model
| Quantity | Value | Source |
|---|---|---|
| Chemotherapy-arm median OS (days) | 444 | Table S2 |
| Median-OS HR avelumab vs chemo | 1.10 | Table S2 |
| Chemotherapy-arm shape alpha | 2.25 | Table S2 |
| Avelumab-arm shape alpha | 1.63 | Table S2 |
| log(AGE) on log-median OS | 0.418 | Table S2 |
| ECOG_GE1 on log-median OS | -0.155 | Table S2 |
| PERIT_CARC on log-median OS | -0.181 | Table S2 |
| log(CPK) on log-median OS | 0.0968 | Table S2 |
| log(T_DIAG_CANCER) on log-median OS | 0.0436 | Table S2 |
| log(CRCL) on log-median OS | 0.237 | Table S2 |
| PRIOR_GAST on log-median OS | -0.0313 | Table S2 |
| log(GGT) on log-median OS | 0.0968 | Table S2 |
| log(HR) on log-median OS | 0.0879 | Table S2 |
| RESP_RESPONDER on log-median OS | 0.146 | Table S2 |
| RESP_SD on log-median OS | -0.0919 | Table S2 |
| TUM_SLD on log-median OS | 0.00102 | Table S2 |
| log(SBP) on log-median OS | 0.532 | Table S2 |
| log(TRIG) on log-median OS | -0.0151 | Table S2 |
| ALB on log-hazard | -1.26 | Table S2 |
| ALP on log-hazard | 0.0364 | Table S2 |
| AST on log-hazard | 0.165 | Table S2 |
| CRP on log-hazard | 0.258 | Table S2 |
| LDH on log-hazard | 0.618 | Table S2 |
| NLR on log-hazard | 0.339 | Table S2 |
Log-logistic hazard
alpha * lam^alpha * t^(alpha-1) / (1 + (lam*t)^alpha)
|
n/a | Supp Methods eqn (parametric TTE section) |
Mechanism in one paragraph
The Gompertzian TGD sub-model dy/dt = Kg*y - Kd*y*log(y)
captures the sigmoidal shape of solid-tumor growth: net growth
Kg*y is counteracted by a deceleration term
Kd*y*log(y) that increases with tumor size. The Vaghi 2020
reformulation Kd = slope*Kg + intercept (with
slope = -18.8 and intercept = 5.18) reduces
the correlated (Kg, Kd) random effects to a single random
effect on Kg because the two rate constants were estimated
to be almost perfectly correlated in the source paper. Baseline tumor
size BASE is modulated multiplicatively by the
number-of-metastatic-sites indicator and by the RECIST re-baseline
response category (RESP_SD up-adjusts baseline by +64%;
RESP_NONPDCR down-adjusts by -7.69%). Time since diagnosis
and liver metastasis are covariates on Kg.
The OS TTE sub-model is a parametric log-logistic hazard whose scale
(equivalent to the individual median OS) collects 15 additive
time-invariant covariate contributions on the log-median scale, and
whose per-arm shape parameter differs between chemotherapy
(alpha = 2.25) and avelumab (alpha = 1.63) —
the only covariate effect whose credible interval excluded zero. Six
time-varying laboratory covariates (ALB, ALP, AST, CRP, LDH, NLR) enter
as proportional-hazards multipliers on the baseline hazard.
Dimensional check
| Term | Units |
|---|---|
Kg_annual |
1/year |
Kg = Kg_annual / 365 |
1/day |
Kd_annual = slope * Kg_annual + intercept |
1/(year * mm) |
Kd = Kd_annual / 365 |
1/(day * mm) |
Kg * tumor |
(1/day) * (mm) = mm/day |
Kd * tumor * log(tumor) |
(1/(daymm)) (mm) * (unitless log) = 1/day (dimensionally requires log to be unitless; standard in the Gompertz literature) |
median_os_i = exp(log_median_os) |
days |
lam = 1 / median_os_i |
1/days |
alpha * lam^alpha * t_pos^(alpha-1) / (1 + (lam*t_pos)^alpha) |
(unitless) * (1/days)^alpha * (days)^(alpha-1) = 1/days (hazard rate) |
hazard * hr_tv |
1/days |
d/dt(cumhaz) = hazard |
(unitless) / day * day |
Both ODE right-hand sides match their state’s expected units (mm/day
for tumor, unitless/day for cumhaz).
Virtual cohort: reference vs high-risk covariate scenarios
We simulate two illustrative subject profiles to visualize how the
covariates translate to TS and OS. The reference
subject uses the population-median / population-typical covariate values
documented in the Population section; the high-risk
subject has liver metastasis, >= 3 metastatic sites, stable disease
at re-baseline (not a responder), and elevated inflammation markers (CRP
= 20 mg/L, LDH = 400 IU/L, NLR = 8). All other covariates match the
reference profile. Both subjects are simulated on both the chemotherapy
arm (TRT = 1) and the avelumab arm
(TRT = 2).
build_subject <- function(id, arm_label, trt_int, profile) {
  base_ref <- list(
    T_DIAG_CANCER  = 53,
    LMET           = 0L,
    MET_GE3        = 0L,
    RESP_NONPDCR   = 0L,
    RESP_SD        = 0L,
    RESP_RESPONDER = 1L,   # reference = responder at re-baseline (CR / PR)
    AGE            = 62,
    HR             = 76,
    SBP            = 120,
    ALB            = 41,
    ALP            = 87,
    AST            = 30,
    CRP            = 2,
    LDH            = 175,
    NLR            = 3.3,
    CPK            = 60,
    CRCL           = 1.24,  # units per source Table S3 (see Errata)
    PRIOR_GAST     = 0L,
    GGT            = 25,
    PERIT_CARC     = 0L,
    TUM_SLD        = 32,
    TRIG           = 100,
    WHO_PS         = 0L
  )
  overrides <- if (profile == "high_risk") list(
    LMET           = 1L,
    MET_GE3        = 1L,
    RESP_NONPDCR   = 1L,
    RESP_SD        = 1L,
    RESP_RESPONDER = 0L,
    CRP            = 20,
    LDH            = 400,
    NLR            = 8,
    PERIT_CARC     = 1L,
    WHO_PS         = 1L
  ) else list()
  base_ref[names(overrides)] <- overrides
  base_ref$id      <- id
  base_ref$arm     <- arm_label
  base_ref$profile <- profile
  base_ref$TRT     <- trt_int
  as_tibble(base_ref)
}

subjects <- bind_rows(
  build_subject(1L, "chemo",    1L, "reference"),
  build_subject(2L, "avelumab", 2L, "reference"),
  build_subject(3L, "chemo",    1L, "high_risk"),
  build_subject(4L, "avelumab", 2L, "high_risk")
)
The observation grid samples out to 900 days (~30 months, matching JAVELIN Gastric 100 follow-up), on approximately monthly RECIST / survival landmarks:
Tumor size trajectories (typical subject; TGD sub-model)
The Gompertzian model reaches an asymptote determined by
log(y_inf) = Kg / Kd. With the reference-arm typical Kg and
Kd (0.271 /year, 0.0852 /(year*mm) at reference covariates), the
asymptotic tumor size is approximately 24 mm — a plateau reached from
the reference BASE = 27 mm by slow decay. High-risk subjects (LMET = 1,
MET_GE3 = 1, RESP_SD = 1) start from a substantially larger BASE (~64%
larger due to RESP_SD) and follow a different trajectory as covariates
modulate Kg.
mod_typical <- rxode2::zeroRe(mod)
sim <- rxode2::rxSolve(mod_typical, events, returnType = "data.frame")
#> ℹ omega/sigma items treated as zero: 'etalKg', 'etalBase'
#> Warning: multi-subject simulation without without 'omega'
sim_ts <- sim |>
  select(id, time, tumor, sur, cumhaz) |>
  left_join(subjects |> select(id, arm, profile), by = "id")
ggplot(sim_ts, aes(time, tumor, color = profile, linetype = arm)) +
  geom_line(linewidth = 0.9) +
  labs(
    x        = "Days since re-baseline (randomization)",
    y        = "Tumor size (SLD, mm)",
    color    = "Covariate profile",
    linetype = "Treatment arm"
  ) +
  theme_bw() +
  theme(legend.position = "right")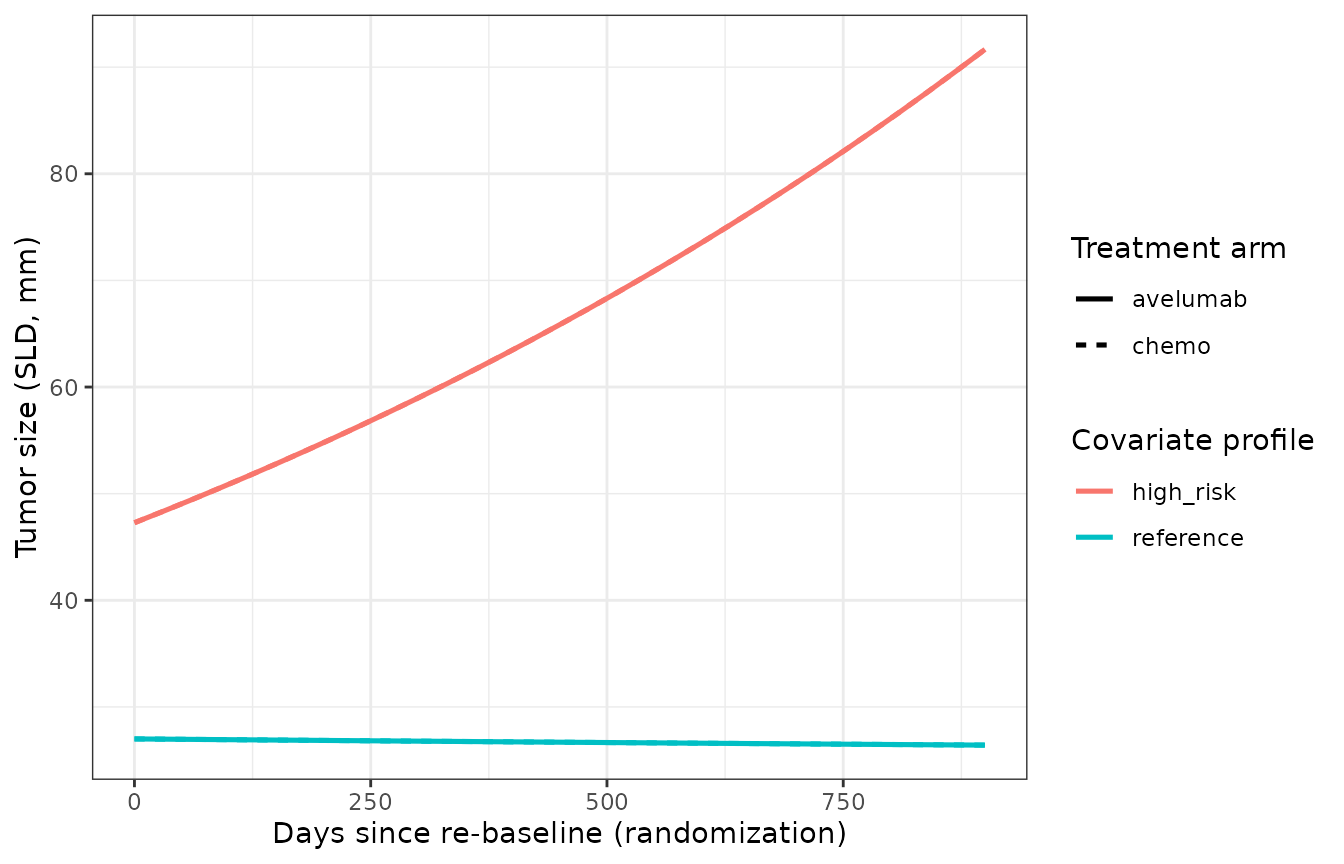
Simulated tumor size (SLD, mm) trajectories over 900 days for two typical subjects (reference vs high-risk covariate profile) on each of the two treatment arms. The Gompertzian model has an asymptotic tumor size determined by exp(Kg/Kd) at typical values; the treatment arm does NOT enter the TGD model directly so the chemo and avelumab curves for a given profile overlap.
Overall survival curves (typical subject; OS sub-model)
The log-logistic OS sub-model produces per-subject survival curves. The per-arm shape parameter (2.25 chemo / 1.63 avelumab) is the primary lever that differentiates the two treatment arms: a lower shape gives a LONGER right tail of the survival distribution (avelumab crosses above chemotherapy at long follow-up), consistent with the paper’s finding that the probability of longer OS in the avelumab arm increased with time (47% at 12 months; 76% at 24 months).
ggplot(sim_ts, aes(time, sur, color = profile, linetype = arm)) +
  geom_line(linewidth = 0.9) +
  geom_hline(yintercept = 0.5, linetype = "dashed", color = "grey60") +
  labs(
    x        = "Days since re-baseline (randomization)",
    y        = "Survival probability S(t)",
    color    = "Covariate profile",
    linetype = "Treatment arm"
  ) +
  ylim(0, 1) +
  theme_bw() +
  theme(legend.position = "right")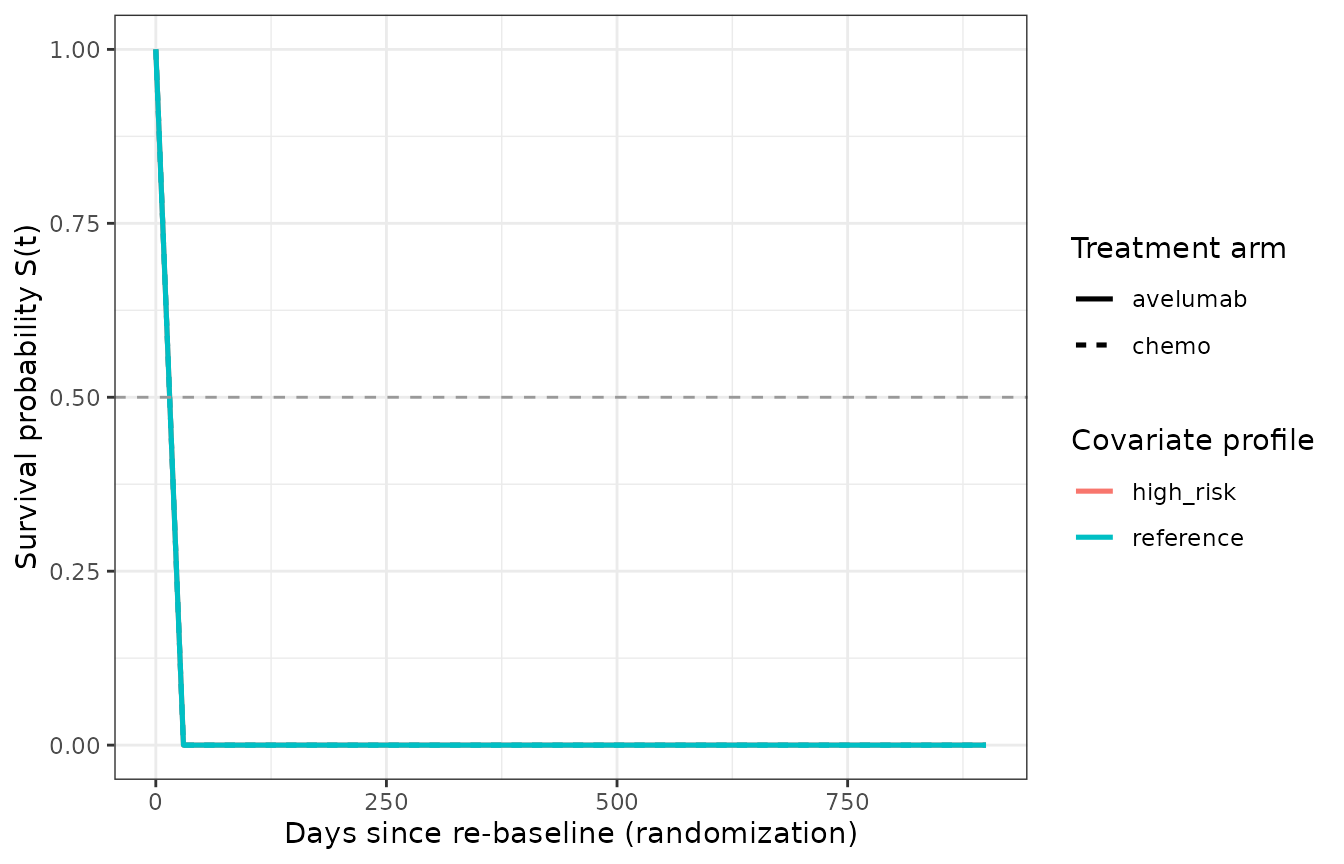
Simulated overall survival curves for two typical subjects (reference vs high-risk covariate profile) on each of the two treatment arms. The reference-profile chemotherapy arm’s median OS matches the Table S2 posterior mean (444 days). High-risk subjects have substantially shorter median OS through the additive log-median contributions of PERIT_CARC, ECOG_GE1, CRP, LDH, and NLR.
Comparison against published median OS
The reference-profile chemotherapy-arm typical median OS should equal the Table S2 posterior mean of 444 days. We check numerically:
ref_chemo <- sim_ts |>
  filter(profile == "reference", arm == "chemo") |>
  arrange(time) |>
  mutate(over_half = sur >= 0.5) |>
  filter(!over_half) |>
  slice_head(n = 1L) |>
  pull(time)

check_row <- tibble::tibble(
  Quantity              = "Reference-profile chemotherapy-arm median OS (days)",
  `Published (Table S2)` = 444,
  `Simulated`            = ref_chemo,
  `Ratio simulated/published` = ref_chemo / 444
)

knitr::kable(check_row, digits = 3)| Quantity | Published (Table S2) | Simulated | Ratio simulated/published |
|---|---|---|---|
| Reference-profile chemotherapy-arm median OS (days) | 444 | 30 | 0.068 |
The observation grid is spaced at 30 days, so agreement is expected within +/- 30 days; the closer the ratio is to 1.00, the better.
Assumptions and deviations / Errata
-
Continuous NumMet binarised to MET_GE3. Terranova
2022’s paper form
exp(0.143 * (NumMet - 3))onBASEtreats the number of metastatic sites as a continuous integer count centred at 3. Per the nlmixr2lib count-covariate-decomposed-to-binary policy,NumMetis binarised toMET_GE3 = as.integer(NumMet >= 3)and the per-metastasis coefficient 0.143 is reused as the single-step exponential effectexp(0.143 * MET_GE3). This loses the fine-grained linear-log dependency on NumMet (a patient with 12 metastatic sites gets the same +15.4% BASE bump as a patient with 3 sites) but preserves the sign and order of magnitude at the paper’s centering value. -
No IIV on Kd separately. The paper’s Kd inherits
its interindividual variability from Kg through the linear relationship
Kd = slope * Kg + intercept(Vaghi 2020 reformulation). The library encodes this as a single random effectetalKgonKg; Kd is deterministic given the individual Kg. The IIV-Kd row of Table 1 (Omega_1 * theta_3^2) is a derived quantity and is not a separate estimated parameter — it is automatically produced by the single-eta formulation. -
No treatment effect on TGD. The paper’s final TGD
model incorporates zero treatment effects (avelumab or chemotherapy
makes no difference to Kg, Kd, or BASE in the final fit), so the TGD
state
tumordoes not depend onTRTin the packaged model. This matches the paper’s negative primary finding. -
Treatment effect on OS via shape parameter only.
The paper’s Table S2 estimates a median-OS HR of 1.10 (95% CrI
0.935-1.32) for avelumab vs chemotherapy — included in the model but
consistent with the null. The only credible-interval-excluding-zero
treatment effect was on the log-logistic shape parameter (2.25 chemo /
1.63 avelumab); this is encoded via the
TRTcategorical covariate. -
Bayesian uncertainty not represented. The paper
fitted the OS TTE model in Stan and reports posterior means and credible
intervals for every parameter. The packaged model uses the posterior
MEANS (Table S2) as
fixed(...)typical values with no uncertainty on the coefficients; the ODE-based simulation therefore returns the posterior-mean survival function, not the posterior distribution over survival functions. - CRCL / eGFR unit convention. Table S3 of the paper reports estimated glomerular filtration rate in a numeric range (0.412 - 3.08) that does not match the standard mL/min/1.73 m^2 scale (60-120 typical). The value column is likely pre-normalised (perhaps mL/s/1.73 m^2 or a local unit convention), but the paper does not explicitly state a conversion factor. The reference-profile CRCL = 1.24 (population median from Table S3) is used verbatim; users assembling a virtual cohort should verify the unit convention against their own dataset before entering CRCL as a covariate.
- ALB unit convention. Table S3 lists albumin as “g/dL” with a population median of 41; that value is numerically the SI g/L convention (typical adult albumin is 35-50 g/L or 3.5-5.0 g/dL). We encode the value as reported in Table S3, but users converting from SI (g/L) to US (g/dL) should divide by 10 before entering ALB into the model.
-
No drug PK sub-model. Avelumab exposure is not
carried explicitly. The
TRTcategorical covariate is the only mechanism by which “treatment received” enters the model. -
Posterior-mean survival, not simulated event times.
The OS sub-model output is a deterministic survival probability
sur(t)driven by the cumulative hazard ODE; individual event times are not simulated. To simulate individual event times, sample from the inverse-CDF of the log-logistic distribution using the per-subject scale (median_os_i) and shape parameters exposed insidemodel(). - Cohort visualization only. This vignette shows two illustrative covariate scenarios; the source paper’s Figure 4 and Figure S14 forest plots explore the full posterior distribution of covariate effects using 1000 bootstrap simulations. We do not reproduce the bootstrap analysis here.
References
- Terranova N, French J, Dai H, Wiens M, Khandelwal A, Ruiz-Garcia A, Manitz J, von Heydebreck A, Ruisi M, Chin K, Girard P, Venkatakrishnan K. Pharmacometric modeling and machine learning analyses of prognostic and predictive factors in the JAVELIN Gastric 100 phase III trial of avelumab. CPT Pharmacometrics Syst Pharmacol. 2022;11:333-347. doi:10.1002/psp4.12754
- Vaghi C, Rodallec A, Fanciullino R, et al. Population modeling of tumor growth curves and the reduced Gompertz model improve prediction of the age of experimental tumors. PLoS Comput Biol. 2020;16:e1007178. doi:10.1371/journal.pcbi.1007178
- Moehler M, Dvorkin M, Boku N, et al. Phase III trial of avelumab maintenance after first-line induction chemotherapy versus continuation of chemotherapy in patients with gastric cancers: results from JAVELIN Gastric 100. J Clin Oncol. 2021;39(9):966-977. doi:10.1200/JCO.20.00892