EASI-75 placebo response in atopic dermatitis trials: a longitudinal MBMA (Serrano 2026)
Source:vignettes/articles/Serrano_2026_atopicDermatitis_placebo_mbma.Rmd
Serrano_2026_atopicDermatitis_placebo_mbma.RmdModel and source
Serrano JC, Maringwa J, Straetemans R, Willems W, Liva SG, Verhoeven J, Ford JL, Huang K-HG, Hubbard JJ, French JL, Devineni D, Vermeulen A, Valiathan C. A Model-Based Meta-Analysis Framework Quantifying Drivers of Placebo Response in Atopic Dermatitis Trials. CPT Pharmacometrics Syst Pharmacol. 2026;15:e70150. doi:10.1002/psp4.70150 (PMC12896390, open access).
This is an unusual model for the library in that there is no drug. The authors performed a PRISMA-conformant systematic review of atopic dermatitis (AD) trials published 2000-2024, extracted the placebo arms of 40 randomised Phase 2 and Phase 3 trials (41 arms, 4827 randomised patients), and fitted a longitudinal model to the EASI-75 responder rate – the proportion of patients achieving at least a 75% reduction from their own baseline in the Eczema Area and Severity Index. The purpose is trial design: if you can predict the control arm of an AD trial from its design and its enrolled population, you can size the study properly and stop mistaking a high placebo response for a failed drug.
The number of responders in placebo arm i at week
t is binomial, and the logit of the response probability is
an exponential approach to a plateau (Serrano 2026 Methods 2.4):
with trial-specific plateau and trial-specific onset rate .
Forward selection (LRT p < 0.005) followed by backward elimination (LRT p < 0.001) retained exactly two covariates, both on the plateau and neither on the onset rate, giving the final model of Results 3.2, which the paper prints both symbolically and fully numerically:
mod <- rxode2::rxode2(readModelDb("Serrano_2026_atopicDermatitis_placebo_mbma"))
typ <- rxode2::zeroRe(mod)   # between-trial random effects set to zero
The single output prob_easi75 is a study-arm
proportion in [0, 1], not a drug concentration and not an
individual patient’s response. Every random effect in this model is
between-trial.
Population
pop <- mod$meta$population
tibble::tibble(Field = names(pop), Value = vapply(pop, as.character, character(1))) |>
knitr::kable(caption = "population metadata of the model file (Serrano 2026 Tables 1 and 2).")| Field | Value |
|---|---|
| species | human |
| n_subjects | 4827 |
| n_studies | 40 |
| n_arms | 41 |
| age_range | study-arm means 27.9-44.1 years, median across arms 36.6 (Table 2). Trials primarily enrolled adults. |
| weight_range | study-arm means 65.6-81.1 kg, median across arms 75.0 (Table 2) |
| sex_female_pct | 44.9 |
| race_ethnicity | Not reported at arm level; the source lists geographic region among the factors it could NOT evaluate for lack of data (Discussion limitations). |
| disease_state | Moderate-to-severe atopic dermatitis. Trials were required to enrol patients meeting at least two of: EASI >= 16, affected body surface area >= 10%, Investigator Global Assessment >= 3. Study-arm mean baseline EASI ranged 11.1-34.5 (median 29.6) and mean affected BSA 14.5-62.0% (median 48.6%); arms with mean baseline EASI < 16 qualified via the BSA and IGA thresholds. |
| dose_range | n/a (placebo arms only) |
| timepoints | EASI-75 responder counts at the timepoints each trial reported over its double-blind period; the source’s primary read-outs are Week 12 and Week 16. Observed placebo EASI-75 rates ranged 4.6-36.8% at Week 12 and 6.1-39.4% at Week 16 (Results 3.1). |
| regions | International; 40 randomised trials published 2014-2024 (search window 2000-2024), 18 Phase 2 and 22 Phase 3. Table 1 lists every trial with its NCT number and data source. |
| notes | MBMA at the STUDY-ARM level: each modelled observation is one placebo arm’s EASI-75 responder count at one timepoint, so the random effects are BETWEEN-TRIAL, not between-subject, and this model must not be used to simulate individual patients. sex_female_pct is derived as 100 - 55.1, the complement of the Table 2 median ‘Percent of males (%)’ of 55.1 (range 35.7-82.2), and is therefore a median across arms rather than a pooled patient proportion. One trial contributed TWO placebo arms with different dosing frequencies, which is why 40 trials give 41 arms. Covariate values missing from a publication were filled by random-forest imputation (Methods 2.2), with Table S4 confirming arm-mean trends were preserved; the supplement was NOT available when this model was built, so the per-covariate imputation fractions are unknown (see vignette Errata). Six further screened covariates were rejected and are recorded here in prose because the register has no canonical for them and this file mints none for a rejected covariate: mean affected body surface area (strongly collinear with baseline EASI, r = 0.96, and therefore not separately identifiable), mean disease duration, prior therapy, trial start year, study phase (Phase 2 vs Phase 3), and the proportion of male patients. Of these, affected BSA DID show a significant univariate inverse correlation with the Week 12 placebo rate (r = -0.39, p < 0.05) but lost to baseline EASI in the stepwise selection. Fitted in R 4.2.1 with nlme 3.1-157 by maximum likelihood, not in NONMEM. |
The pooled placebo arms (Serrano 2026 Table 2) had a median arm size of 78 patients (range 27-321), median age 36.6 years (27.9-44.1), median weight 75.0 kg (65.6-81.1), median 55.1% male (35.7-82.2), and median disease duration 24.4 years (12.0-38.0). Baseline severity confirms a moderate-to-severe population: median arm-mean EASI 29.6 (range 11.1-34.5) and median affected body surface area 48.6% (14.5-62.0). Fourteen of the 41 arms permitted concomitant topical corticosteroids and 27 did not.
Observed placebo EASI-75 rates ranged 4.6-36.8% at Week 12 (median 15.9%) and 6.1-39.4% at Week 16 (median 14.6%) – an eightfold spread across trials that are nominally enrolling the same disease. Explaining that spread is the point of the paper.
Source trace
Every value in ini() and every term in
model(), with the place in the source it came from.
| Quantity | Model file | Source location | Value |
|---|---|---|---|
| Structural model (binomial + logit exponential-approach) | model() lp_easi75 | Methods 2.4, display equation (set as vector graphics in the PDF; recovered with pdftotext) | logit(P) = Ebase + Em_i(1 - exp(-k_it)) |
| Continuous-covariate form (mean-centred) | model() emax_i | Methods 2.4, display equation f(X,theta) = theta_X*(X - Xbar) | theta_X * (X - mean X) |
| Categorical-covariate form (m-1 indicators) | model() emax_i | Methods 2.4 prose | binary indicator vs reference category |
| Final covariate model, fully numeric | model() emax_i, lp_easi75 | Results 3.2, display equation | -4.97 + (3.21 + 0.774I_TCS - 0.0486(EASI - 29)) * (1 - exp(-0.291 t)) |
| Baseline response E_base | ini() e0 | Table 4, row ‘Baseline response (E base)’ | -4.97 (%RSE 5.0; 95% CI -5.47, -4.45) |
| Maximum placebo effect E_max | ini() emax | Table 4, row ‘Maximum placebo effect (E max)’ | 3.21 (%RSE 7.6; 95% CI 2.71, 3.73) |
| Onset rate constant k | ini() lkp_easi75 | Table 4, row ‘Rate constant (k)’; units week^-1 per Methods 2.4 | 0.291 /week (%RSE 11.0; 95% CI 0.227, 0.353) |
| TCS therapy effect theta_TCS | ini() e_conmed_steroid_topical_emax | Table 4, row ‘TCS therapy effect (theta TCS)’ | 0.774 (%RSE 13.7; 95% CI 0.567, 0.983) |
| Baseline EASI effect theta_EASI | ini() e_score_easi_emax | Table 4, row ‘EASI baseline effect (theta EASI)’ | -0.0486 (%RSE 25.3; 95% CI -0.0721, -0.0260) |
| Centring constant for baseline EASI | model(), literal 29 | Results 3.2 numeric equation ‘(EASI_i - 29)’; restated in Results 3.3 as ‘a baseline EASI score of 29 (mean EASI value across trials)’ | 29 (the MEAN, not the Table 2 median of 29.6) |
| Between-trial variance on E_max | ini() eta_study_emax | Table 4, row ‘Variance of random effect on E max (omega^2 eta)’ | 0.0396 (SD 0.199, additive on the logit plateau) |
| Between-trial variance on k | ini() eta_study_lkp_easi75 | Table 4, row ‘Variance of random effect on k (omega^2 gamma)’ | 0.138 (SD 0.371 on log k, since Methods 2.4 puts gamma inside exp()) |
| Binomial residual variance | NOT in ini(); see Errata | Methods 2.4: var(Y/N | eta, gamma) = P*(1-P)/N | arm-size dependent, applied downstream |
| AR(1) within-trial residual correlation | NOT in ini(); see Errata | Table 4, row ‘Autoregressive coefficient (phi)’ | 0.759 |
| Placeholder residual SD | ini() addSd_prob_easi75 | NOT from the source | fixed(0.001) |
Two sanity checks that the numbers in the model file are the ones actually fitted, read straight off the loaded model:
th <- mod$theta
stopifnot(
  identical(unname(th[["e0"]]), -4.97),
  identical(unname(th[["emax"]]), 3.21),
  identical(unname(th[["e_conmed_steroid_topical_emax"]]), 0.774),
  identical(unname(th[["e_score_easi_emax"]]), -0.0486),
  # lkp_easi75 is stored logged; back-transform must be Table 4's 0.291.
  isTRUE(all.equal(exp(unname(th[["lkp_easi75"]])), 0.291))
)
round(exp(th[["lkp_easi75"]]), 4)
#> [1] 0.291
Errata and unrepresentable source features
Nothing in the source is wrong. Two features of the published model are, however, not expressible in an nlmixr2 residual-error model and are therefore documented rather than encoded. Neither affects a typical-value prediction; both affect only the spread and the serial correlation of simulated arm proportions about the trajectory, which is why every published number checked below is reproduced exactly.
-
The binomial residual. The source has no estimated
residual variance. The observation is a responder count, and
the residual is the binomial sampling variance of the arm proportion,
var(Y_ij / N_ij) = P_ij * (1 - P_ij) / N_ij, which “ensures that observations are weighted by their sample size” (Methods 2.4). Because it depends on the arm sizeN_ij, which is data and not a parameter, it cannot live inini(). The two-line recipe for adding it downstream is given in its own section below. This is the same convention used byChen_2025_methotrexate_acr20_mbma(itsW = 1/sqrt(N)arm weight) andBoucher_2018_naproxen_mbma. -
The AR(1) within-trial residual correlation, Table
4
phi = 0.759. The same arm is observed repeatedly over its double-blind period, and the source models that serial correlation with a first-order autoregressive error structure. nlmixr2’s residual-error models are independent across records. A user simulating repeated observations from one arm and wanting realistic serial correlation must impose it after the solve.
Two further gaps, both from the supplement not being available when this model was built:
-
Per-trial covariate values are in Table S1, which
is distributed in
Data S1/Data S2. Those files were not available, so the virtual trial-arm cohort below is constructed from the Table 2 marginal summaries (mean, median, range) rather than from the actual 41 arms. See Assumptions. - Missing covariate values were filled by random-forest imputation (Methods 2.2), with Table S4 confirming arm-mean trends were preserved. The per-covariate imputation fractions are in that supplement and are therefore unknown here.
PKNCA not applicable
This model has no drug, no dose events, no concentration output and
no absorption-distribution-elimination profile to integrate. Cmax / Tmax
/ AUC / half-life are not meaningful validation targets, so the PKNCA
section that a population-PK vignette carries is replaced by the four
validations below – the strategy used for the other responder-rate MBMA
models in the library (Chen_2025_methotrexate_acr20_mbma,
Boucher_2018_naproxen_mbma).
Validation 1: closed-form structural identities
The exponential-approach-to-plateau form implies three exact identities. Both sides of each use the same fixed parameters, so the only difference is numerical error and a tight bound is correct here (unlike the cohort assertions in Validation 3, which must be robust).
solve_arm <- function(m, times, easi, tcs) {
  ev <- data.frame(id = 1L, time = times, evid = 0L, amt = 0,
                   SCORE_EASI = easi, CONMED_STEROID_TOPICAL = tcs)
  rxode2::rxSolve(m, events = ev, returnType = "data.frame")
}

expit <- function(x) 1 / (1 + exp(-x))
k     <- exp(mod$theta[["lkp_easi75"]])
e0    <- mod$theta[["e0"]]

# Reference arm: no concomitant therapy, arm-mean baseline EASI exactly 29.
# Both covariates vanish there, so the plateau increment is emax itself.
emax_ref <- mod$theta[["emax"]]
y <- solve_arm(typ, c(0, log(2) / k, 1e4), easi = 29, tcs = 0)$prob_easi75
#> ℹ omega/sigma items treated as zero: 'eta_study_emax', 'eta_study_lkp_easi75'

gates <- tibble::tibble(
  Identity = c("t = 0: P = expit(E_base)",
               "t = ln(2)/k: P = expit(E_base + E_max/2)",
               "t -> Inf: P = expit(E_base + E_max)"),
  Model    = y,
  Expected = c(expit(e0), expit(e0 + emax_ref / 2), expit(e0 + emax_ref))
)
knitr::kable(gates, digits = 6,
caption = "Closed-form identities of the logit exponential-approach model, reference arm (no TCS, baseline EASI 29).")| Identity | Model | Expected |
|---|---|---|
| t = 0: P = expit(E_base) | 0.006895 | 0.006895 |
| t = ln(2)/k: P = expit(E_base + E_max/2) | 0.033407 | 0.033407 |
| t -> Inf: P = expit(E_base + E_max) | 0.146790 | 0.146790 |
A fourth structural identity is worth asserting separately because it
is the one a mis-transcribed e0 would break most visibly.
EASI-75 is a 75% reduction from each patient’s own baseline, so
by construction nobody can be a responder at
randomisation – the model must put essentially zero probability
at t = 0, and it must do so for every arm regardless of
covariates, because neither covariate multiplies
E_base.
grid0 <- expand.grid(SCORE_EASI = c(11.1, 19, 24, 29, 34.5),
                     CONMED_STEROID_TOPICAL = c(0, 1))
p0 <- vapply(seq_len(nrow(grid0)), function(i) {
  solve_arm(typ, 0, grid0$SCORE_EASI[i], grid0$CONMED_STEROID_TOPICAL[i])$prob_easi75
}, numeric(1))
#> ℹ omega/sigma items treated as zero: 'eta_study_emax', 'eta_study_lkp_easi75'
#> ℹ omega/sigma items treated as zero: 'eta_study_emax', 'eta_study_lkp_easi75'
#> ℹ omega/sigma items treated as zero: 'eta_study_emax', 'eta_study_lkp_easi75'
#> ℹ omega/sigma items treated as zero: 'eta_study_emax', 'eta_study_lkp_easi75'
#> ℹ omega/sigma items treated as zero: 'eta_study_emax', 'eta_study_lkp_easi75'
#> ℹ omega/sigma items treated as zero: 'eta_study_emax', 'eta_study_lkp_easi75'
#> ℹ omega/sigma items treated as zero: 'eta_study_emax', 'eta_study_lkp_easi75'
#> ℹ omega/sigma items treated as zero: 'eta_study_emax', 'eta_study_lkp_easi75'
#> ℹ omega/sigma items treated as zero: 'eta_study_emax', 'eta_study_lkp_easi75'
#> ℹ omega/sigma items treated as zero: 'eta_study_emax', 'eta_study_lkp_easi75'
stopifnot(
  # Identical across every covariate combination, and below 1%.
  all(abs(p0 - expit(e0)) < 1e-10),
  all(p0 < 0.01)
)
sprintf("P(EASI-75) at t = 0 is %.3f%% for all %d covariate combinations",
        100 * p0[1], length(p0))
#> [1] "P(EASI-75) at t = 0 is 0.690% for all 10 covariate combinations"
Validation 2: regression test against the published numbers
Serrano 2026 states six quantities in its Results that are not parameter estimates and were therefore not used to build the model file. Each is an independent check of the whole encoding – parameter values, the centring constant, the covariate signs, and the time form together.
P <- function(easi, tcs, t) solve_arm(typ, t, easi, tcs)$prob_easi75

published <- tibble::tribble(
  ~Quantity, ~`Source location`, ~Published, ~Model,
  "Week 16 EASI-75 rate, no concomitant therapy, baseline EASI 29 (%)",
  "Results 3.3",                       14.3,  100 * P(29, 0, 16),
  "Week 16 EASI-75 rate, TCS permitted, baseline EASI 29 (%)",
  "Results 3.3",                       26.4,  100 * P(29, 1, 16),
  "Week 12 response ratio, TCS vs no concomitant therapy",
  "Results 3.3 / Figure 1C",           1.84,  P(29, 1, 12) / P(29, 0, 12),
  "Week 16 response ratio, TCS vs no concomitant therapy",
  "Results 3.3 / Figure 1C",           1.85,  P(29, 1, 16) / P(29, 0, 16),
  "Rate ratio per +1 baseline EASI point, Week 12",
  "Results 3.4 / Table S8",            0.961, P(30, 0, 12) / P(29, 0, 12),
  "Rate ratio, baseline EASI 34 vs 24, Week 12",
  "Results 3.6 / Figure 3B",           0.665, P(34, 0, 12) / P(24, 0, 12)
) |>
  dplyr::mutate(`Difference (%)` = 100 * (Model - Published) / Published)
#> ℹ omega/sigma items treated as zero: 'eta_study_emax', 'eta_study_lkp_easi75'
#> ℹ omega/sigma items treated as zero: 'eta_study_emax', 'eta_study_lkp_easi75'
#> ℹ omega/sigma items treated as zero: 'eta_study_emax', 'eta_study_lkp_easi75'
#> ℹ omega/sigma items treated as zero: 'eta_study_emax', 'eta_study_lkp_easi75'
#> ℹ omega/sigma items treated as zero: 'eta_study_emax', 'eta_study_lkp_easi75'
#> ℹ omega/sigma items treated as zero: 'eta_study_emax', 'eta_study_lkp_easi75'
#> ℹ omega/sigma items treated as zero: 'eta_study_emax', 'eta_study_lkp_easi75'
#> ℹ omega/sigma items treated as zero: 'eta_study_emax', 'eta_study_lkp_easi75'
#> ℹ omega/sigma items treated as zero: 'eta_study_emax', 'eta_study_lkp_easi75'
#> ℹ omega/sigma items treated as zero: 'eta_study_emax', 'eta_study_lkp_easi75'

knitr::kable(published, digits = c(0, 0, 3, 4, 2),
caption = "Six published quantities, none of which is a parameter estimate, reproduced by the encoded model.")| Quantity | Source location | Published | Model | Difference (%) |
|---|---|---|---|---|
| Week 16 EASI-75 rate, no concomitant therapy, baseline EASI 29 (%) | Results 3.3 | 14.300 | 14.3010 | 0.01 |
| Week 16 EASI-75 rate, TCS permitted, baseline EASI 29 (%) | Results 3.3 | 26.400 | 26.4275 | 0.10 |
| Week 12 response ratio, TCS vs no concomitant therapy | Results 3.3 / Figure 1C | 1.840 | 1.8403 | 0.01 |
| Week 16 response ratio, TCS vs no concomitant therapy | Results 3.3 / Figure 1C | 1.850 | 1.8479 | -0.11 |
| Rate ratio per +1 baseline EASI point, Week 12 | Results 3.4 / Table S8 | 0.961 | 0.9599 | -0.11 |
| Rate ratio, baseline EASI 34 vs 24, Week 12 | Results 3.6 / Figure 3B | 0.665 | 0.6655 | 0.07 |
stopifnot(
  # Every published value recovered to better than 0.5% relative. These are
  # deterministic typical-value computations with no random draw anywhere, so
  # a tight bound is correct.
  all(abs(published$`Difference (%)`) < 0.5)
)
The two 95% confidence intervals the paper prints alongside those point estimates are reproduced by resampling the parameter estimates, which the source did 1000 times from the multivariate normal of the maximum-likelihood estimates and its variance-covariance matrix (Methods 2.5). The variance-covariance matrix is not published, so only the marginal standard errors implied by the tabulated %RSE are available; the interval below is therefore approximate and is shown as a plausibility check rather than a gate.
rxode2::rxSetSeed(20260912)
set.seed(20260912)
nrep <- 1000
est  <- c(e0 = -4.97, emax = 3.21, k = 0.291, tcs = 0.774, easi = -0.0486)
rse  <- c(e0 = 5.0,   emax = 7.6,  k = 11.0,  tcs = 13.7,  easi = 25.3) / 100
draws <- vapply(names(est), function(p) rnorm(nrep, est[[p]], abs(est[[p]]) * rse[[p]]),
                numeric(nrep))

rate <- function(easi, tcs, t) {
  em <- draws[, "emax"] + draws[, "tcs"] * tcs + draws[, "easi"] * (easi - 29)
  1 / (1 + exp(-(draws[, "e0"] + em * (1 - exp(-draws[, "k"] * t)))))
}
tibble::tibble(
  Scenario  = c("Week 16, no concomitant therapy", "Week 16, TCS permitted"),
  Published = c("14.3% (12.7-16.0)", "26.4% (23.4-29.3)"),
  `Resampled here` = vapply(list(rate(29, 0, 16), rate(29, 1, 16)), function(r)
    sprintf("%.1f%% (%.1f-%.1f)", 100 * median(r),
            100 * quantile(r, 0.025), 100 * quantile(r, 0.975)), character(1))
) |>
knitr::kable(caption = "Approximate uncertainty intervals: marginal %RSE only, correlations unpublished. Plausibility check, not a gate.")| Scenario | Published | Resampled here |
|---|---|---|
| Week 16, no concomitant therapy | 14.3% (12.7-16.0) | 14.0% (7.6-24.3) |
| Week 16, TCS permitted | 26.4% (23.4-29.3) | 25.8% (14.9-42.2) |
Validation 3: a virtual cohort of trial arms against the observed spread
The between-trial random effects (omega^2 eta = 0.0396
on the plateau, omega^2 gamma = 0.138 on log k) are what
make this model useful for trial design: they say how far a new
trial’s placebo arm can land from the typical trajectory. Here 200
virtual placebo arms are drawn and compared against the observed
distribution the source reports in Results 3.1.
The per-trial baseline EASI values live in supplementary Table S1, which was not available when this model was built, so the arm-mean baseline EASI is drawn from a scaled Beta distribution chosen to match the three marginal statistics Table 2 does report – mean 29, median 29.6, range 11.1-34.5 – and TCS permission is assigned at the observed 14-in-41 frequency. Table S3 reports that arm demographics and baseline severity are broadly comparable across concomitant-therapy groups, which is what licenses assigning the two independently.
rxode2::rxSetSeed(20260912)
set.seed(20260912)

n_arms <- 200   # per the library's 200-per-arm cohort cap
lo <- 11.1; hi <- 34.5

arms <- tibble::tibble(
  id = seq_len(n_arms),
  SCORE_EASI = lo + (hi - lo) * rbeta(n_arms, 6, 1.84),
  CONMED_STEROID_TOPICAL = as.numeric(seq_len(n_arms) <= round(n_arms * 14 / 41))
)
# Confirm the drawn cohort matches the Table 2 marginals it was built from.
sprintf("virtual arms: mean baseline EASI %.1f, median %.1f, range %.1f-%.1f",
        mean(arms$SCORE_EASI), median(arms$SCORE_EASI),
        min(arms$SCORE_EASI), max(arms$SCORE_EASI))
#> [1] "virtual arms: mean baseline EASI 29.2, median 29.5, range 19.3-34.4"

ev <- arms |>
  tidyr::expand_grid(time = c(12, 16)) |>
  dplyr::mutate(evid = 0L, amt = 0) |>
  dplyr::arrange(id, time) |>
  as.data.frame()

cohort <- rxode2::rxSolve(mod, events = ev, returnType = "data.frame") |>
  dplyr::mutate(rate_pct = 100 * prob_easi75)

obs <- tibble::tribble(
  ~time, ~`Observed median`, ~`Observed min`, ~`Observed max`,
  12,    15.9,               4.6,             36.8,
  16,    14.6,               6.1,             39.4
)

cohort |>
  dplyr::group_by(time) |>
  dplyr::summarise(`Simulated median` = median(rate_pct),
                   `Simulated q10`    = quantile(rate_pct, 0.10),
                   `Simulated q90`    = quantile(rate_pct, 0.90),
                   .groups = "drop") |>
  dplyr::left_join(obs, by = "time") |>
  dplyr::rename("Week" = time) |>
  knitr::kable(digits = 1,
caption = "200 virtual placebo arms versus the observed across-trial distribution (Serrano 2026 Results 3.1).")| Week | Simulated median | Simulated q10 | Simulated q90 | Observed median | Observed min | Observed max |
|---|---|---|---|---|---|---|
| 12 | 15.1 | 10.0 | 25.4 | 15.9 | 4.6 | 36.8 |
| 16 | 16.4 | 10.9 | 27.2 | 14.6 | 6.1 | 39.4 |
wk12 <- cohort$rate_pct[cohort$time == 12]
wk16 <- cohort$rate_pct[cohort$time == 16]

stopifnot(
  # Structural: a probability must stay a probability for every draw.
  all(cohort$prob_easi75 > 0), all(cohort$prob_easi75 < 1),
  # Structural: the response is monotone increasing in time for every arm,
  # because emax_i > 0 for the whole drawn cohort.
  all(wk16 > wk12),
  # Centre: the simulated Week-12 median must land on the observed median of
  # 15.9%. A mis-transcribed parameter, a wrong centring constant or a
  # sign-flipped covariate moves this by many percentage points.
  abs(median(wk12) - 15.9) < 4,
  # Envelope: robust quantiles, not extremes. The maximum of a random cohort
  # is not reproducible across rxode2 builds; the 90th percentile is.
  quantile(wk12, 0.90) < 35,
  quantile(wk12, 0.10) > 5
)
sprintf("Week 12 simulated median %.1f%% vs observed 15.9%%; q10-q90 %.1f-%.1f%%",
        median(wk12), quantile(wk12, 0.10), quantile(wk12, 0.90))
#> [1] "Week 12 simulated median 15.1% vs observed 15.9%; q10-q90 10.0-25.4%"
The simulated Week-16 median (about 16%) sits slightly above the observed Week-16 median of 14.6%, and the observed Week-16 median is itself below the observed Week-12 median of 15.9%. The model cannot reproduce that inversion, and should not: it is monotone increasing in time by construction. The explanation is in the data rather than the model – not every arm reports at both visits, so the two observed medians are computed over different subsets of trials. This is a deviation row, not a failed gate; the Week-12 median, where the most arms report, is the one asserted above.
Replication: Figure 1B, the time course by concomitant-therapy group
Serrano 2026 Figure 1B plots model-based projections for the two concomitant-therapy groups at the mean baseline EASI across trials.
tgrid <- seq(0, 20, by = 0.25)
fig1 <- dplyr::bind_rows(
  tibble::tibble(time = tgrid, group = "No concomitant therapy",
                 rate = 100 * P(29, 0, tgrid)),
  tibble::tibble(time = tgrid, group = "TCS permitted",
                 rate = 100 * P(29, 1, tgrid))
)
#> ℹ omega/sigma items treated as zero: 'eta_study_emax', 'eta_study_lkp_easi75'
#> ℹ omega/sigma items treated as zero: 'eta_study_emax', 'eta_study_lkp_easi75'

ggplot(fig1, aes(time, rate, colour = group)) +
  geom_line(linewidth = 1) +
  geom_vline(xintercept = c(12, 16), linetype = "dotted") +
  scale_colour_manual(values = c("No concomitant therapy" = "#2c7fb8",
                                 "TCS permitted" = "#d95f02")) +
  labs(x = "Time (weeks)", y = "EASI-75 placebo response (%)", colour = NULL,
       subtitle = "Dotted lines mark the Week 12 and Week 16 read-out visits") +
  theme_bw() + theme(legend.position = "top")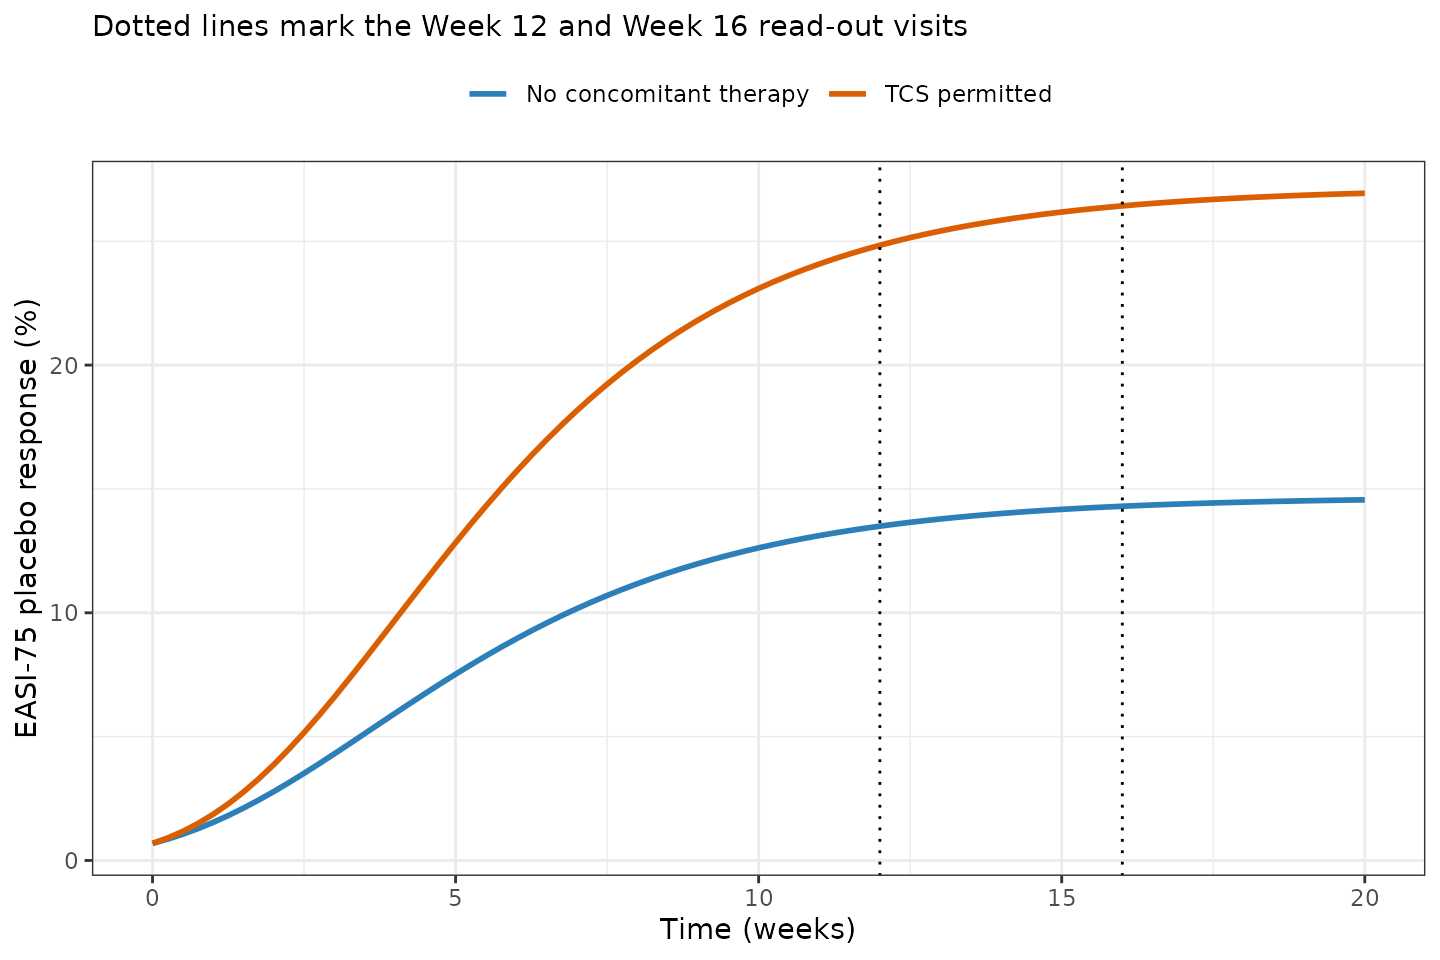
Replicates Figure 1B of Serrano 2026: EASI-75 placebo response over time by concomitant-therapy group, at the across-trial mean baseline EASI of 29.
Replication: Figure 1C, the TCS response ratio over time
Figure 1C plots the ratio of the two curves above. The paper’s headline “1.8-fold increase” is this ratio at the read-out visits.
tg <- seq(1, 20, by = 0.25)
ratio <- tibble::tibble(time = tg, ratio = P(29, 1, tg) / P(29, 0, tg))
#> ℹ omega/sigma items treated as zero: 'eta_study_emax', 'eta_study_lkp_easi75'
#> ℹ omega/sigma items treated as zero: 'eta_study_emax', 'eta_study_lkp_easi75'

ggplot(ratio, aes(time, ratio)) +
  geom_line(linewidth = 1, colour = "#d95f02") +
  geom_point(data = dplyr::filter(ratio, time %in% c(12, 16)), size = 2.5) +
  geom_hline(yintercept = 1, linetype = "dashed", colour = "grey50") +
  labs(x = "Time (weeks)", y = "Response ratio (TCS / no concomitant therapy)",
       subtitle = "Points mark Weeks 12 and 16; the source reports 1.84 and 1.85") +
  theme_bw()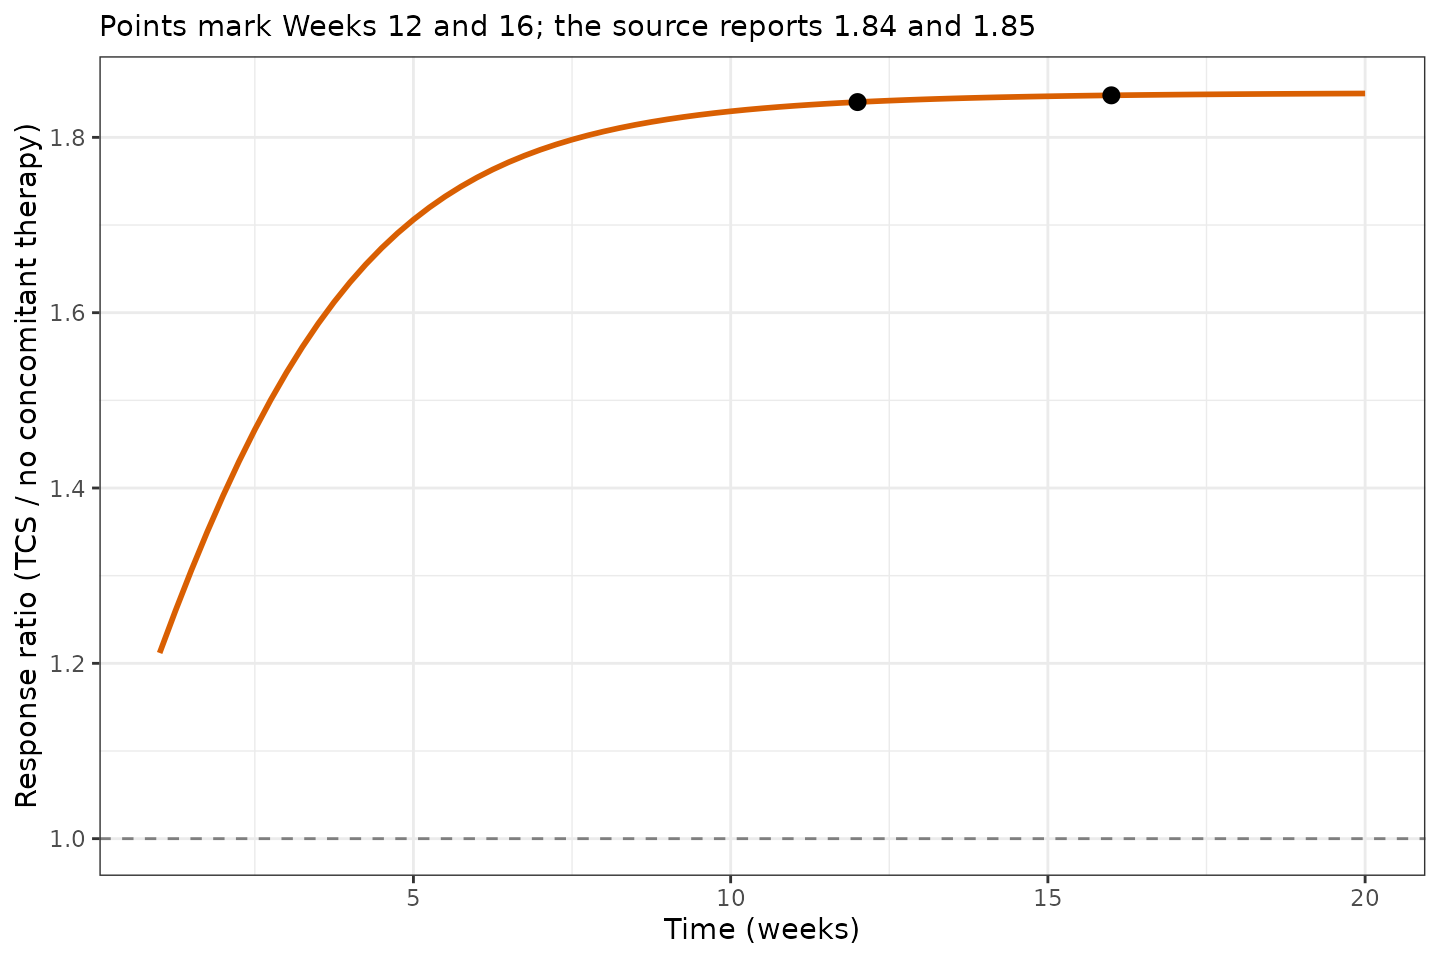
Replicates Figure 1C of Serrano 2026: longitudinal response ratio of EASI-75 placebo rates, TCS permitted versus no concomitant therapy.
Note the shape: the ratio is not flat, it rises steeply over
the first weeks and then flattens. That is a consequence of the
covariate acting on the plateau rather than on the onset rate – both
groups start from the same E_base and separate only as the
plateau term switches on.
Replication: Figure 2B, baseline-severity tertiles
Figure 2B shows projections at the middle value of each observed baseline-EASI tertile: low 19, mid 29, high 34.
fig2 <- dplyr::bind_rows(lapply(c(19, 29, 34), function(e)
  tibble::tibble(time = tgrid, easi = factor(e), rate = 100 * P(e, 0, tgrid))))
#> ℹ omega/sigma items treated as zero: 'eta_study_emax', 'eta_study_lkp_easi75'
#> ℹ omega/sigma items treated as zero: 'eta_study_emax', 'eta_study_lkp_easi75'
#> ℹ omega/sigma items treated as zero: 'eta_study_emax', 'eta_study_lkp_easi75'

ggplot(fig2, aes(time, rate, colour = easi)) +
  geom_line(linewidth = 1) +
  geom_vline(xintercept = c(12, 16), linetype = "dotted") +
  scale_colour_brewer(palette = "Dark2") +
  labs(x = "Time (weeks)", y = "EASI-75 placebo response (%)",
       colour = "Mean baseline EASI",
       subtitle = "Tertile mid-values, no concomitant therapy") +
  theme_bw() + theme(legend.position = "top")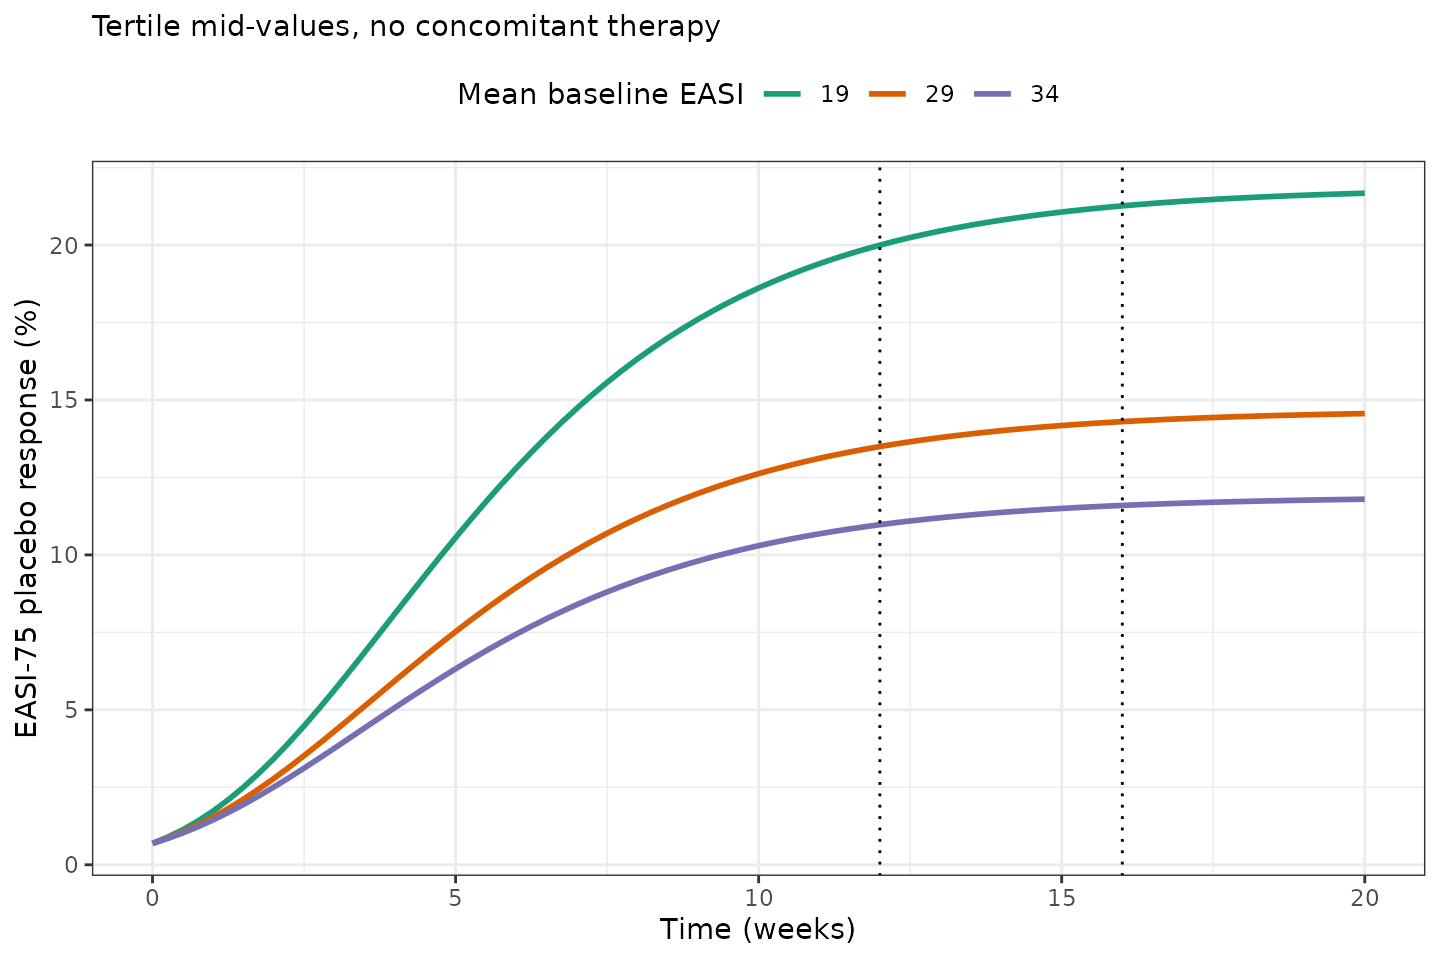
Replicates Figure 2B of Serrano 2026: EASI-75 placebo response over time at the low / mid / high baseline-EASI tertile mid-values, no concomitant therapy.
Replication: Figure 2C and 2D, Week 12 and Week 16 versus baseline EASI
egrid <- seq(11, 35, by = 0.25)
fig3 <- tidyr::expand_grid(easi = egrid, week = c(12, 16), tcs = c(0, 1)) |>
  dplyr::rowwise() |>
  dplyr::mutate(rate = 100 * P(easi, tcs, week)) |>
  dplyr::ungroup() |>
  dplyr::mutate(
    Week  = factor(paste("Week", week), levels = c("Week 12", "Week 16")),
    Panel = factor(ifelse(tcs == 1, "TCS permitted", "No concomitant therapy"),
                   levels = c("No concomitant therapy", "TCS permitted"))
  )
#> ℹ omega/sigma items treated as zero: 'eta_study_emax', 'eta_study_lkp_easi75'
#> ℹ omega/sigma items treated as zero: 'eta_study_emax', 'eta_study_lkp_easi75'
#> ℹ omega/sigma items treated as zero: 'eta_study_emax', 'eta_study_lkp_easi75'
#> ℹ omega/sigma items treated as zero: 'eta_study_emax', 'eta_study_lkp_easi75'
#> ℹ omega/sigma items treated as zero: 'eta_study_emax', 'eta_study_lkp_easi75'
#> ℹ omega/sigma items treated as zero: 'eta_study_emax', 'eta_study_lkp_easi75'
#> ℹ omega/sigma items treated as zero: 'eta_study_emax', 'eta_study_lkp_easi75'
#> ℹ omega/sigma items treated as zero: 'eta_study_emax', 'eta_study_lkp_easi75'
#> ℹ omega/sigma items treated as zero: 'eta_study_emax', 'eta_study_lkp_easi75'
#> ℹ omega/sigma items treated as zero: 'eta_study_emax', 'eta_study_lkp_easi75'
#> ℹ omega/sigma items treated as zero: 'eta_study_emax', 'eta_study_lkp_easi75'
#> ℹ omega/sigma items treated as zero: 'eta_study_emax', 'eta_study_lkp_easi75'
#> ℹ omega/sigma items treated as zero: 'eta_study_emax', 'eta_study_lkp_easi75'
#> ℹ omega/sigma items treated as zero: 'eta_study_emax', 'eta_study_lkp_easi75'
#> ℹ omega/sigma items treated as zero: 'eta_study_emax', 'eta_study_lkp_easi75'
#> ℹ omega/sigma items treated as zero: 'eta_study_emax', 'eta_study_lkp_easi75'
#> ℹ omega/sigma items treated as zero: 'eta_study_emax', 'eta_study_lkp_easi75'
#> ℹ omega/sigma items treated as zero: 'eta_study_emax', 'eta_study_lkp_easi75'
#> ℹ omega/sigma items treated as zero: 'eta_study_emax', 'eta_study_lkp_easi75'
#> ℹ omega/sigma items treated as zero: 'eta_study_emax', 'eta_study_lkp_easi75'
#> ℹ omega/sigma items treated as zero: 'eta_study_emax', 'eta_study_lkp_easi75'
#> ℹ omega/sigma items treated as zero: 'eta_study_emax', 'eta_study_lkp_easi75'
#> ℹ omega/sigma items treated as zero: 'eta_study_emax', 'eta_study_lkp_easi75'
#> ℹ omega/sigma items treated as zero: 'eta_study_emax', 'eta_study_lkp_easi75'
#> ℹ omega/sigma items treated as zero: 'eta_study_emax', 'eta_study_lkp_easi75'
#> ℹ omega/sigma items treated as zero: 'eta_study_emax', 'eta_study_lkp_easi75'
#> ℹ omega/sigma items treated as zero: 'eta_study_emax', 'eta_study_lkp_easi75'
#> ℹ omega/sigma items treated as zero: 'eta_study_emax', 'eta_study_lkp_easi75'
#> ℹ omega/sigma items treated as zero: 'eta_study_emax', 'eta_study_lkp_easi75'
#> ℹ omega/sigma items treated as zero: 'eta_study_emax', 'eta_study_lkp_easi75'
#> ℹ omega/sigma items treated as zero: 'eta_study_emax', 'eta_study_lkp_easi75'
#> ℹ omega/sigma items treated as zero: 'eta_study_emax', 'eta_study_lkp_easi75'
#> ℹ omega/sigma items treated as zero: 'eta_study_emax', 'eta_study_lkp_easi75'
#> ℹ omega/sigma items treated as zero: 'eta_study_emax', 'eta_study_lkp_easi75'
#> ℹ omega/sigma items treated as zero: 'eta_study_emax', 'eta_study_lkp_easi75'
#> ℹ omega/sigma items treated as zero: 'eta_study_emax', 'eta_study_lkp_easi75'
#> ℹ omega/sigma items treated as zero: 'eta_study_emax', 'eta_study_lkp_easi75'
#> ℹ omega/sigma items treated as zero: 'eta_study_emax', 'eta_study_lkp_easi75'
#> ℹ omega/sigma items treated as zero: 'eta_study_emax', 'eta_study_lkp_easi75'
#> ℹ omega/sigma items treated as zero: 'eta_study_emax', 'eta_study_lkp_easi75'
#> ℹ omega/sigma items treated as zero: 'eta_study_emax', 'eta_study_lkp_easi75'
#> ℹ omega/sigma items treated as zero: 'eta_study_emax', 'eta_study_lkp_easi75'
#> ℹ omega/sigma items treated as zero: 'eta_study_emax', 'eta_study_lkp_easi75'
#> ℹ omega/sigma items treated as zero: 'eta_study_emax', 'eta_study_lkp_easi75'
#> ℹ omega/sigma items treated as zero: 'eta_study_emax', 'eta_study_lkp_easi75'
#> ℹ omega/sigma items treated as zero: 'eta_study_emax', 'eta_study_lkp_easi75'
#> ℹ omega/sigma items treated as zero: 'eta_study_emax', 'eta_study_lkp_easi75'
#> ℹ omega/sigma items treated as zero: 'eta_study_emax', 'eta_study_lkp_easi75'
#> ℹ omega/sigma items treated as zero: 'eta_study_emax', 'eta_study_lkp_easi75'
#> ℹ omega/sigma items treated as zero: 'eta_study_emax', 'eta_study_lkp_easi75'
#> ℹ omega/sigma items treated as zero: 'eta_study_emax', 'eta_study_lkp_easi75'
#> ℹ omega/sigma items treated as zero: 'eta_study_emax', 'eta_study_lkp_easi75'
#> ℹ omega/sigma items treated as zero: 'eta_study_emax', 'eta_study_lkp_easi75'
#> ℹ omega/sigma items treated as zero: 'eta_study_emax', 'eta_study_lkp_easi75'
#> ℹ omega/sigma items treated as zero: 'eta_study_emax', 'eta_study_lkp_easi75'
#> ℹ omega/sigma items treated as zero: 'eta_study_emax', 'eta_study_lkp_easi75'
#> ℹ omega/sigma items treated as zero: 'eta_study_emax', 'eta_study_lkp_easi75'
#> ℹ omega/sigma items treated as zero: 'eta_study_emax', 'eta_study_lkp_easi75'
#> ℹ omega/sigma items treated as zero: 'eta_study_emax', 'eta_study_lkp_easi75'
#> ℹ omega/sigma items treated as zero: 'eta_study_emax', 'eta_study_lkp_easi75'
#> ℹ omega/sigma items treated as zero: 'eta_study_emax', 'eta_study_lkp_easi75'
#> ℹ omega/sigma items treated as zero: 'eta_study_emax', 'eta_study_lkp_easi75'
#> ℹ omega/sigma items treated as zero: 'eta_study_emax', 'eta_study_lkp_easi75'
#> ℹ omega/sigma items treated as zero: 'eta_study_emax', 'eta_study_lkp_easi75'
#> ℹ omega/sigma items treated as zero: 'eta_study_emax', 'eta_study_lkp_easi75'
#> ℹ omega/sigma items treated as zero: 'eta_study_emax', 'eta_study_lkp_easi75'
#> ℹ omega/sigma items treated as zero: 'eta_study_emax', 'eta_study_lkp_easi75'
#> ℹ omega/sigma items treated as zero: 'eta_study_emax', 'eta_study_lkp_easi75'
#> ℹ omega/sigma items treated as zero: 'eta_study_emax', 'eta_study_lkp_easi75'
#> ℹ omega/sigma items treated as zero: 'eta_study_emax', 'eta_study_lkp_easi75'
#> ℹ omega/sigma items treated as zero: 'eta_study_emax', 'eta_study_lkp_easi75'
#> ℹ omega/sigma items treated as zero: 'eta_study_emax', 'eta_study_lkp_easi75'
#> ℹ omega/sigma items treated as zero: 'eta_study_emax', 'eta_study_lkp_easi75'
#> ℹ omega/sigma items treated as zero: 'eta_study_emax', 'eta_study_lkp_easi75'
#> ℹ omega/sigma items treated as zero: 'eta_study_emax', 'eta_study_lkp_easi75'
#> ℹ omega/sigma items treated as zero: 'eta_study_emax', 'eta_study_lkp_easi75'
#> ℹ omega/sigma items treated as zero: 'eta_study_emax', 'eta_study_lkp_easi75'
#> ℹ omega/sigma items treated as zero: 'eta_study_emax', 'eta_study_lkp_easi75'
#> ℹ omega/sigma items treated as zero: 'eta_study_emax', 'eta_study_lkp_easi75'
#> ℹ omega/sigma items treated as zero: 'eta_study_emax', 'eta_study_lkp_easi75'
#> ℹ omega/sigma items treated as zero: 'eta_study_emax', 'eta_study_lkp_easi75'
#> ℹ omega/sigma items treated as zero: 'eta_study_emax', 'eta_study_lkp_easi75'
#> ℹ omega/sigma items treated as zero: 'eta_study_emax', 'eta_study_lkp_easi75'
#> ℹ omega/sigma items treated as zero: 'eta_study_emax', 'eta_study_lkp_easi75'
#> ℹ omega/sigma items treated as zero: 'eta_study_emax', 'eta_study_lkp_easi75'
#> ℹ omega/sigma items treated as zero: 'eta_study_emax', 'eta_study_lkp_easi75'
#> ℹ omega/sigma items treated as zero: 'eta_study_emax', 'eta_study_lkp_easi75'
#> ℹ omega/sigma items treated as zero: 'eta_study_emax', 'eta_study_lkp_easi75'
#> ℹ omega/sigma items treated as zero: 'eta_study_emax', 'eta_study_lkp_easi75'
#> ℹ omega/sigma items treated as zero: 'eta_study_emax', 'eta_study_lkp_easi75'
#> ℹ omega/sigma items treated as zero: 'eta_study_emax', 'eta_study_lkp_easi75'
#> ℹ omega/sigma items treated as zero: 'eta_study_emax', 'eta_study_lkp_easi75'
#> ℹ omega/sigma items treated as zero: 'eta_study_emax', 'eta_study_lkp_easi75'
#> ℹ omega/sigma items treated as zero: 'eta_study_emax', 'eta_study_lkp_easi75'
#> ℹ omega/sigma items treated as zero: 'eta_study_emax', 'eta_study_lkp_easi75'
#> ℹ omega/sigma items treated as zero: 'eta_study_emax', 'eta_study_lkp_easi75'
#> ℹ omega/sigma items treated as zero: 'eta_study_emax', 'eta_study_lkp_easi75'
#> ℹ omega/sigma items treated as zero: 'eta_study_emax', 'eta_study_lkp_easi75'
#> ℹ omega/sigma items treated as zero: 'eta_study_emax', 'eta_study_lkp_easi75'
#> ℹ omega/sigma items treated as zero: 'eta_study_emax', 'eta_study_lkp_easi75'
#> ℹ omega/sigma items treated as zero: 'eta_study_emax', 'eta_study_lkp_easi75'
#> ℹ omega/sigma items treated as zero: 'eta_study_emax', 'eta_study_lkp_easi75'
#> ℹ omega/sigma items treated as zero: 'eta_study_emax', 'eta_study_lkp_easi75'
#> ℹ omega/sigma items treated as zero: 'eta_study_emax', 'eta_study_lkp_easi75'
#> ℹ omega/sigma items treated as zero: 'eta_study_emax', 'eta_study_lkp_easi75'
#> ℹ omega/sigma items treated as zero: 'eta_study_emax', 'eta_study_lkp_easi75'
#> ℹ omega/sigma items treated as zero: 'eta_study_emax', 'eta_study_lkp_easi75'
#> ℹ omega/sigma items treated as zero: 'eta_study_emax', 'eta_study_lkp_easi75'
#> ℹ omega/sigma items treated as zero: 'eta_study_emax', 'eta_study_lkp_easi75'
#> ℹ omega/sigma items treated as zero: 'eta_study_emax', 'eta_study_lkp_easi75'
#> ℹ omega/sigma items treated as zero: 'eta_study_emax', 'eta_study_lkp_easi75'
#> ℹ omega/sigma items treated as zero: 'eta_study_emax', 'eta_study_lkp_easi75'
#> ℹ omega/sigma items treated as zero: 'eta_study_emax', 'eta_study_lkp_easi75'
#> ℹ omega/sigma items treated as zero: 'eta_study_emax', 'eta_study_lkp_easi75'
#> ℹ omega/sigma items treated as zero: 'eta_study_emax', 'eta_study_lkp_easi75'
#> ℹ omega/sigma items treated as zero: 'eta_study_emax', 'eta_study_lkp_easi75'
#> ℹ omega/sigma items treated as zero: 'eta_study_emax', 'eta_study_lkp_easi75'
#> ℹ omega/sigma items treated as zero: 'eta_study_emax', 'eta_study_lkp_easi75'
#> ℹ omega/sigma items treated as zero: 'eta_study_emax', 'eta_study_lkp_easi75'
#> ℹ omega/sigma items treated as zero: 'eta_study_emax', 'eta_study_lkp_easi75'
#> ℹ omega/sigma items treated as zero: 'eta_study_emax', 'eta_study_lkp_easi75'
#> ℹ omega/sigma items treated as zero: 'eta_study_emax', 'eta_study_lkp_easi75'
#> ℹ omega/sigma items treated as zero: 'eta_study_emax', 'eta_study_lkp_easi75'
#> ℹ omega/sigma items treated as zero: 'eta_study_emax', 'eta_study_lkp_easi75'
#> ℹ omega/sigma items treated as zero: 'eta_study_emax', 'eta_study_lkp_easi75'
#> ℹ omega/sigma items treated as zero: 'eta_study_emax', 'eta_study_lkp_easi75'
#> ℹ omega/sigma items treated as zero: 'eta_study_emax', 'eta_study_lkp_easi75'
#> ℹ omega/sigma items treated as zero: 'eta_study_emax', 'eta_study_lkp_easi75'
#> ℹ omega/sigma items treated as zero: 'eta_study_emax', 'eta_study_lkp_easi75'
#> ℹ omega/sigma items treated as zero: 'eta_study_emax', 'eta_study_lkp_easi75'
#> ℹ omega/sigma items treated as zero: 'eta_study_emax', 'eta_study_lkp_easi75'
#> ℹ omega/sigma items treated as zero: 'eta_study_emax', 'eta_study_lkp_easi75'
#> ℹ omega/sigma items treated as zero: 'eta_study_emax', 'eta_study_lkp_easi75'
#> ℹ omega/sigma items treated as zero: 'eta_study_emax', 'eta_study_lkp_easi75'
#> ℹ omega/sigma items treated as zero: 'eta_study_emax', 'eta_study_lkp_easi75'
#> ℹ omega/sigma items treated as zero: 'eta_study_emax', 'eta_study_lkp_easi75'
#> ℹ omega/sigma items treated as zero: 'eta_study_emax', 'eta_study_lkp_easi75'
#> ℹ omega/sigma items treated as zero: 'eta_study_emax', 'eta_study_lkp_easi75'
#> ℹ omega/sigma items treated as zero: 'eta_study_emax', 'eta_study_lkp_easi75'
#> ℹ omega/sigma items treated as zero: 'eta_study_emax', 'eta_study_lkp_easi75'
#> ℹ omega/sigma items treated as zero: 'eta_study_emax', 'eta_study_lkp_easi75'
#> ℹ omega/sigma items treated as zero: 'eta_study_emax', 'eta_study_lkp_easi75'
#> ℹ omega/sigma items treated as zero: 'eta_study_emax', 'eta_study_lkp_easi75'
#> ℹ omega/sigma items treated as zero: 'eta_study_emax', 'eta_study_lkp_easi75'
#> ℹ omega/sigma items treated as zero: 'eta_study_emax', 'eta_study_lkp_easi75'
#> ℹ omega/sigma items treated as zero: 'eta_study_emax', 'eta_study_lkp_easi75'
#> ℹ omega/sigma items treated as zero: 'eta_study_emax', 'eta_study_lkp_easi75'
#> ℹ omega/sigma items treated as zero: 'eta_study_emax', 'eta_study_lkp_easi75'
#> ℹ omega/sigma items treated as zero: 'eta_study_emax', 'eta_study_lkp_easi75'
#> ℹ omega/sigma items treated as zero: 'eta_study_emax', 'eta_study_lkp_easi75'
#> ℹ omega/sigma items treated as zero: 'eta_study_emax', 'eta_study_lkp_easi75'
#> ℹ omega/sigma items treated as zero: 'eta_study_emax', 'eta_study_lkp_easi75'
#> ℹ omega/sigma items treated as zero: 'eta_study_emax', 'eta_study_lkp_easi75'
#> ℹ omega/sigma items treated as zero: 'eta_study_emax', 'eta_study_lkp_easi75'
#> ℹ omega/sigma items treated as zero: 'eta_study_emax', 'eta_study_lkp_easi75'
#> ℹ omega/sigma items treated as zero: 'eta_study_emax', 'eta_study_lkp_easi75'
#> ℹ omega/sigma items treated as zero: 'eta_study_emax', 'eta_study_lkp_easi75'
#> ℹ omega/sigma items treated as zero: 'eta_study_emax', 'eta_study_lkp_easi75'
#> ℹ omega/sigma items treated as zero: 'eta_study_emax', 'eta_study_lkp_easi75'
#> ℹ omega/sigma items treated as zero: 'eta_study_emax', 'eta_study_lkp_easi75'
#> ℹ omega/sigma items treated as zero: 'eta_study_emax', 'eta_study_lkp_easi75'
#> ℹ omega/sigma items treated as zero: 'eta_study_emax', 'eta_study_lkp_easi75'
#> ℹ omega/sigma items treated as zero: 'eta_study_emax', 'eta_study_lkp_easi75'
#> ℹ omega/sigma items treated as zero: 'eta_study_emax', 'eta_study_lkp_easi75'
#> ℹ omega/sigma items treated as zero: 'eta_study_emax', 'eta_study_lkp_easi75'
#> ℹ omega/sigma items treated as zero: 'eta_study_emax', 'eta_study_lkp_easi75'
#> ℹ omega/sigma items treated as zero: 'eta_study_emax', 'eta_study_lkp_easi75'
#> ℹ omega/sigma items treated as zero: 'eta_study_emax', 'eta_study_lkp_easi75'
#> ℹ omega/sigma items treated as zero: 'eta_study_emax', 'eta_study_lkp_easi75'
#> ℹ omega/sigma items treated as zero: 'eta_study_emax', 'eta_study_lkp_easi75'
#> ℹ omega/sigma items treated as zero: 'eta_study_emax', 'eta_study_lkp_easi75'
#> ℹ omega/sigma items treated as zero: 'eta_study_emax', 'eta_study_lkp_easi75'
#> ℹ omega/sigma items treated as zero: 'eta_study_emax', 'eta_study_lkp_easi75'
#> ℹ omega/sigma items treated as zero: 'eta_study_emax', 'eta_study_lkp_easi75'
#> ℹ omega/sigma items treated as zero: 'eta_study_emax', 'eta_study_lkp_easi75'
#> ℹ omega/sigma items treated as zero: 'eta_study_emax', 'eta_study_lkp_easi75'
#> ℹ omega/sigma items treated as zero: 'eta_study_emax', 'eta_study_lkp_easi75'
#> ℹ omega/sigma items treated as zero: 'eta_study_emax', 'eta_study_lkp_easi75'
#> ℹ omega/sigma items treated as zero: 'eta_study_emax', 'eta_study_lkp_easi75'
#> ℹ omega/sigma items treated as zero: 'eta_study_emax', 'eta_study_lkp_easi75'
#> ℹ omega/sigma items treated as zero: 'eta_study_emax', 'eta_study_lkp_easi75'
#> ℹ omega/sigma items treated as zero: 'eta_study_emax', 'eta_study_lkp_easi75'
#> ℹ omega/sigma items treated as zero: 'eta_study_emax', 'eta_study_lkp_easi75'
#> ℹ omega/sigma items treated as zero: 'eta_study_emax', 'eta_study_lkp_easi75'
#> ℹ omega/sigma items treated as zero: 'eta_study_emax', 'eta_study_lkp_easi75'
#> ℹ omega/sigma items treated as zero: 'eta_study_emax', 'eta_study_lkp_easi75'
#> ℹ omega/sigma items treated as zero: 'eta_study_emax', 'eta_study_lkp_easi75'
#> ℹ omega/sigma items treated as zero: 'eta_study_emax', 'eta_study_lkp_easi75'
#> ℹ omega/sigma items treated as zero: 'eta_study_emax', 'eta_study_lkp_easi75'
#> ℹ omega/sigma items treated as zero: 'eta_study_emax', 'eta_study_lkp_easi75'
#> ℹ omega/sigma items treated as zero: 'eta_study_emax', 'eta_study_lkp_easi75'
#> ℹ omega/sigma items treated as zero: 'eta_study_emax', 'eta_study_lkp_easi75'
#> ℹ omega/sigma items treated as zero: 'eta_study_emax', 'eta_study_lkp_easi75'
#> ℹ omega/sigma items treated as zero: 'eta_study_emax', 'eta_study_lkp_easi75'
#> ℹ omega/sigma items treated as zero: 'eta_study_emax', 'eta_study_lkp_easi75'
#> ℹ omega/sigma items treated as zero: 'eta_study_emax', 'eta_study_lkp_easi75'
#> ℹ omega/sigma items treated as zero: 'eta_study_emax', 'eta_study_lkp_easi75'
#> ℹ omega/sigma items treated as zero: 'eta_study_emax', 'eta_study_lkp_easi75'
#> ℹ omega/sigma items treated as zero: 'eta_study_emax', 'eta_study_lkp_easi75'
#> ℹ omega/sigma items treated as zero: 'eta_study_emax', 'eta_study_lkp_easi75'
#> ℹ omega/sigma items treated as zero: 'eta_study_emax', 'eta_study_lkp_easi75'
#> ℹ omega/sigma items treated as zero: 'eta_study_emax', 'eta_study_lkp_easi75'
#> ℹ omega/sigma items treated as zero: 'eta_study_emax', 'eta_study_lkp_easi75'
#> ℹ omega/sigma items treated as zero: 'eta_study_emax', 'eta_study_lkp_easi75'
#> ℹ omega/sigma items treated as zero: 'eta_study_emax', 'eta_study_lkp_easi75'
#> ℹ omega/sigma items treated as zero: 'eta_study_emax', 'eta_study_lkp_easi75'
#> ℹ omega/sigma items treated as zero: 'eta_study_emax', 'eta_study_lkp_easi75'
#> ℹ omega/sigma items treated as zero: 'eta_study_emax', 'eta_study_lkp_easi75'
#> ℹ omega/sigma items treated as zero: 'eta_study_emax', 'eta_study_lkp_easi75'
#> ℹ omega/sigma items treated as zero: 'eta_study_emax', 'eta_study_lkp_easi75'
#> ℹ omega/sigma items treated as zero: 'eta_study_emax', 'eta_study_lkp_easi75'
#> ℹ omega/sigma items treated as zero: 'eta_study_emax', 'eta_study_lkp_easi75'
#> ℹ omega/sigma items treated as zero: 'eta_study_emax', 'eta_study_lkp_easi75'
#> ℹ omega/sigma items treated as zero: 'eta_study_emax', 'eta_study_lkp_easi75'
#> ℹ omega/sigma items treated as zero: 'eta_study_emax', 'eta_study_lkp_easi75'
#> ℹ omega/sigma items treated as zero: 'eta_study_emax', 'eta_study_lkp_easi75'
#> ℹ omega/sigma items treated as zero: 'eta_study_emax', 'eta_study_lkp_easi75'
#> ℹ omega/sigma items treated as zero: 'eta_study_emax', 'eta_study_lkp_easi75'
#> ℹ omega/sigma items treated as zero: 'eta_study_emax', 'eta_study_lkp_easi75'
#> ℹ omega/sigma items treated as zero: 'eta_study_emax', 'eta_study_lkp_easi75'
#> ℹ omega/sigma items treated as zero: 'eta_study_emax', 'eta_study_lkp_easi75'
#> ℹ omega/sigma items treated as zero: 'eta_study_emax', 'eta_study_lkp_easi75'
#> ℹ omega/sigma items treated as zero: 'eta_study_emax', 'eta_study_lkp_easi75'
#> ℹ omega/sigma items treated as zero: 'eta_study_emax', 'eta_study_lkp_easi75'
#> ℹ omega/sigma items treated as zero: 'eta_study_emax', 'eta_study_lkp_easi75'
#> ℹ omega/sigma items treated as zero: 'eta_study_emax', 'eta_study_lkp_easi75'
#> ℹ omega/sigma items treated as zero: 'eta_study_emax', 'eta_study_lkp_easi75'
#> ℹ omega/sigma items treated as zero: 'eta_study_emax', 'eta_study_lkp_easi75'
#> ℹ omega/sigma items treated as zero: 'eta_study_emax', 'eta_study_lkp_easi75'
#> ℹ omega/sigma items treated as zero: 'eta_study_emax', 'eta_study_lkp_easi75'
#> ℹ omega/sigma items treated as zero: 'eta_study_emax', 'eta_study_lkp_easi75'
#> ℹ omega/sigma items treated as zero: 'eta_study_emax', 'eta_study_lkp_easi75'
#> ℹ omega/sigma items treated as zero: 'eta_study_emax', 'eta_study_lkp_easi75'
#> ℹ omega/sigma items treated as zero: 'eta_study_emax', 'eta_study_lkp_easi75'
#> ℹ omega/sigma items treated as zero: 'eta_study_emax', 'eta_study_lkp_easi75'
#> ℹ omega/sigma items treated as zero: 'eta_study_emax', 'eta_study_lkp_easi75'
#> ℹ omega/sigma items treated as zero: 'eta_study_emax', 'eta_study_lkp_easi75'
#> ℹ omega/sigma items treated as zero: 'eta_study_emax', 'eta_study_lkp_easi75'
#> ℹ omega/sigma items treated as zero: 'eta_study_emax', 'eta_study_lkp_easi75'
#> ℹ omega/sigma items treated as zero: 'eta_study_emax', 'eta_study_lkp_easi75'
#> ℹ omega/sigma items treated as zero: 'eta_study_emax', 'eta_study_lkp_easi75'
#> ℹ omega/sigma items treated as zero: 'eta_study_emax', 'eta_study_lkp_easi75'
#> ℹ omega/sigma items treated as zero: 'eta_study_emax', 'eta_study_lkp_easi75'
#> ℹ omega/sigma items treated as zero: 'eta_study_emax', 'eta_study_lkp_easi75'
#> ℹ omega/sigma items treated as zero: 'eta_study_emax', 'eta_study_lkp_easi75'
#> ℹ omega/sigma items treated as zero: 'eta_study_emax', 'eta_study_lkp_easi75'
#> ℹ omega/sigma items treated as zero: 'eta_study_emax', 'eta_study_lkp_easi75'
#> ℹ omega/sigma items treated as zero: 'eta_study_emax', 'eta_study_lkp_easi75'
#> ℹ omega/sigma items treated as zero: 'eta_study_emax', 'eta_study_lkp_easi75'
#> ℹ omega/sigma items treated as zero: 'eta_study_emax', 'eta_study_lkp_easi75'
#> ℹ omega/sigma items treated as zero: 'eta_study_emax', 'eta_study_lkp_easi75'
#> ℹ omega/sigma items treated as zero: 'eta_study_emax', 'eta_study_lkp_easi75'
#> ℹ omega/sigma items treated as zero: 'eta_study_emax', 'eta_study_lkp_easi75'
#> ℹ omega/sigma items treated as zero: 'eta_study_emax', 'eta_study_lkp_easi75'
#> ℹ omega/sigma items treated as zero: 'eta_study_emax', 'eta_study_lkp_easi75'
#> ℹ omega/sigma items treated as zero: 'eta_study_emax', 'eta_study_lkp_easi75'
#> ℹ omega/sigma items treated as zero: 'eta_study_emax', 'eta_study_lkp_easi75'
#> ℹ omega/sigma items treated as zero: 'eta_study_emax', 'eta_study_lkp_easi75'
#> ℹ omega/sigma items treated as zero: 'eta_study_emax', 'eta_study_lkp_easi75'
#> ℹ omega/sigma items treated as zero: 'eta_study_emax', 'eta_study_lkp_easi75'
#> ℹ omega/sigma items treated as zero: 'eta_study_emax', 'eta_study_lkp_easi75'
#> ℹ omega/sigma items treated as zero: 'eta_study_emax', 'eta_study_lkp_easi75'
#> ℹ omega/sigma items treated as zero: 'eta_study_emax', 'eta_study_lkp_easi75'
#> ℹ omega/sigma items treated as zero: 'eta_study_emax', 'eta_study_lkp_easi75'
#> ℹ omega/sigma items treated as zero: 'eta_study_emax', 'eta_study_lkp_easi75'
#> ℹ omega/sigma items treated as zero: 'eta_study_emax', 'eta_study_lkp_easi75'
#> ℹ omega/sigma items treated as zero: 'eta_study_emax', 'eta_study_lkp_easi75'
#> ℹ omega/sigma items treated as zero: 'eta_study_emax', 'eta_study_lkp_easi75'
#> ℹ omega/sigma items treated as zero: 'eta_study_emax', 'eta_study_lkp_easi75'
#> ℹ omega/sigma items treated as zero: 'eta_study_emax', 'eta_study_lkp_easi75'
#> ℹ omega/sigma items treated as zero: 'eta_study_emax', 'eta_study_lkp_easi75'
#> ℹ omega/sigma items treated as zero: 'eta_study_emax', 'eta_study_lkp_easi75'
#> ℹ omega/sigma items treated as zero: 'eta_study_emax', 'eta_study_lkp_easi75'
#> ℹ omega/sigma items treated as zero: 'eta_study_emax', 'eta_study_lkp_easi75'
#> ℹ omega/sigma items treated as zero: 'eta_study_emax', 'eta_study_lkp_easi75'
#> ℹ omega/sigma items treated as zero: 'eta_study_emax', 'eta_study_lkp_easi75'
#> ℹ omega/sigma items treated as zero: 'eta_study_emax', 'eta_study_lkp_easi75'
#> ℹ omega/sigma items treated as zero: 'eta_study_emax', 'eta_study_lkp_easi75'
#> ℹ omega/sigma items treated as zero: 'eta_study_emax', 'eta_study_lkp_easi75'
#> ℹ omega/sigma items treated as zero: 'eta_study_emax', 'eta_study_lkp_easi75'
#> ℹ omega/sigma items treated as zero: 'eta_study_emax', 'eta_study_lkp_easi75'
#> ℹ omega/sigma items treated as zero: 'eta_study_emax', 'eta_study_lkp_easi75'
#> ℹ omega/sigma items treated as zero: 'eta_study_emax', 'eta_study_lkp_easi75'
#> ℹ omega/sigma items treated as zero: 'eta_study_emax', 'eta_study_lkp_easi75'
#> ℹ omega/sigma items treated as zero: 'eta_study_emax', 'eta_study_lkp_easi75'
#> ℹ omega/sigma items treated as zero: 'eta_study_emax', 'eta_study_lkp_easi75'
#> ℹ omega/sigma items treated as zero: 'eta_study_emax', 'eta_study_lkp_easi75'
#> ℹ omega/sigma items treated as zero: 'eta_study_emax', 'eta_study_lkp_easi75'
#> ℹ omega/sigma items treated as zero: 'eta_study_emax', 'eta_study_lkp_easi75'
#> ℹ omega/sigma items treated as zero: 'eta_study_emax', 'eta_study_lkp_easi75'
#> ℹ omega/sigma items treated as zero: 'eta_study_emax', 'eta_study_lkp_easi75'
#> ℹ omega/sigma items treated as zero: 'eta_study_emax', 'eta_study_lkp_easi75'
#> ℹ omega/sigma items treated as zero: 'eta_study_emax', 'eta_study_lkp_easi75'
#> ℹ omega/sigma items treated as zero: 'eta_study_emax', 'eta_study_lkp_easi75'
#> ℹ omega/sigma items treated as zero: 'eta_study_emax', 'eta_study_lkp_easi75'
#> ℹ omega/sigma items treated as zero: 'eta_study_emax', 'eta_study_lkp_easi75'
#> ℹ omega/sigma items treated as zero: 'eta_study_emax', 'eta_study_lkp_easi75'
#> ℹ omega/sigma items treated as zero: 'eta_study_emax', 'eta_study_lkp_easi75'
#> ℹ omega/sigma items treated as zero: 'eta_study_emax', 'eta_study_lkp_easi75'
#> ℹ omega/sigma items treated as zero: 'eta_study_emax', 'eta_study_lkp_easi75'
#> ℹ omega/sigma items treated as zero: 'eta_study_emax', 'eta_study_lkp_easi75'
#> ℹ omega/sigma items treated as zero: 'eta_study_emax', 'eta_study_lkp_easi75'
#> ℹ omega/sigma items treated as zero: 'eta_study_emax', 'eta_study_lkp_easi75'
#> ℹ omega/sigma items treated as zero: 'eta_study_emax', 'eta_study_lkp_easi75'
#> ℹ omega/sigma items treated as zero: 'eta_study_emax', 'eta_study_lkp_easi75'
#> ℹ omega/sigma items treated as zero: 'eta_study_emax', 'eta_study_lkp_easi75'
#> ℹ omega/sigma items treated as zero: 'eta_study_emax', 'eta_study_lkp_easi75'
#> ℹ omega/sigma items treated as zero: 'eta_study_emax', 'eta_study_lkp_easi75'
#> ℹ omega/sigma items treated as zero: 'eta_study_emax', 'eta_study_lkp_easi75'
#> ℹ omega/sigma items treated as zero: 'eta_study_emax', 'eta_study_lkp_easi75'
#> ℹ omega/sigma items treated as zero: 'eta_study_emax', 'eta_study_lkp_easi75'
#> ℹ omega/sigma items treated as zero: 'eta_study_emax', 'eta_study_lkp_easi75'
#> ℹ omega/sigma items treated as zero: 'eta_study_emax', 'eta_study_lkp_easi75'
#> ℹ omega/sigma items treated as zero: 'eta_study_emax', 'eta_study_lkp_easi75'
#> ℹ omega/sigma items treated as zero: 'eta_study_emax', 'eta_study_lkp_easi75'
#> ℹ omega/sigma items treated as zero: 'eta_study_emax', 'eta_study_lkp_easi75'
#> ℹ omega/sigma items treated as zero: 'eta_study_emax', 'eta_study_lkp_easi75'
#> ℹ omega/sigma items treated as zero: 'eta_study_emax', 'eta_study_lkp_easi75'
#> ℹ omega/sigma items treated as zero: 'eta_study_emax', 'eta_study_lkp_easi75'
#> ℹ omega/sigma items treated as zero: 'eta_study_emax', 'eta_study_lkp_easi75'
#> ℹ omega/sigma items treated as zero: 'eta_study_emax', 'eta_study_lkp_easi75'
#> ℹ omega/sigma items treated as zero: 'eta_study_emax', 'eta_study_lkp_easi75'
#> ℹ omega/sigma items treated as zero: 'eta_study_emax', 'eta_study_lkp_easi75'
#> ℹ omega/sigma items treated as zero: 'eta_study_emax', 'eta_study_lkp_easi75'
#> ℹ omega/sigma items treated as zero: 'eta_study_emax', 'eta_study_lkp_easi75'
#> ℹ omega/sigma items treated as zero: 'eta_study_emax', 'eta_study_lkp_easi75'
#> ℹ omega/sigma items treated as zero: 'eta_study_emax', 'eta_study_lkp_easi75'
#> ℹ omega/sigma items treated as zero: 'eta_study_emax', 'eta_study_lkp_easi75'
#> ℹ omega/sigma items treated as zero: 'eta_study_emax', 'eta_study_lkp_easi75'
#> ℹ omega/sigma items treated as zero: 'eta_study_emax', 'eta_study_lkp_easi75'
#> ℹ omega/sigma items treated as zero: 'eta_study_emax', 'eta_study_lkp_easi75'
#> ℹ omega/sigma items treated as zero: 'eta_study_emax', 'eta_study_lkp_easi75'
#> ℹ omega/sigma items treated as zero: 'eta_study_emax', 'eta_study_lkp_easi75'
#> ℹ omega/sigma items treated as zero: 'eta_study_emax', 'eta_study_lkp_easi75'
#> ℹ omega/sigma items treated as zero: 'eta_study_emax', 'eta_study_lkp_easi75'
#> ℹ omega/sigma items treated as zero: 'eta_study_emax', 'eta_study_lkp_easi75'
#> ℹ omega/sigma items treated as zero: 'eta_study_emax', 'eta_study_lkp_easi75'
#> ℹ omega/sigma items treated as zero: 'eta_study_emax', 'eta_study_lkp_easi75'
#> ℹ omega/sigma items treated as zero: 'eta_study_emax', 'eta_study_lkp_easi75'
#> ℹ omega/sigma items treated as zero: 'eta_study_emax', 'eta_study_lkp_easi75'
#> ℹ omega/sigma items treated as zero: 'eta_study_emax', 'eta_study_lkp_easi75'
#> ℹ omega/sigma items treated as zero: 'eta_study_emax', 'eta_study_lkp_easi75'
#> ℹ omega/sigma items treated as zero: 'eta_study_emax', 'eta_study_lkp_easi75'
#> ℹ omega/sigma items treated as zero: 'eta_study_emax', 'eta_study_lkp_easi75'
#> ℹ omega/sigma items treated as zero: 'eta_study_emax', 'eta_study_lkp_easi75'
#> ℹ omega/sigma items treated as zero: 'eta_study_emax', 'eta_study_lkp_easi75'
#> ℹ omega/sigma items treated as zero: 'eta_study_emax', 'eta_study_lkp_easi75'
#> ℹ omega/sigma items treated as zero: 'eta_study_emax', 'eta_study_lkp_easi75'
#> ℹ omega/sigma items treated as zero: 'eta_study_emax', 'eta_study_lkp_easi75'
#> ℹ omega/sigma items treated as zero: 'eta_study_emax', 'eta_study_lkp_easi75'
#> ℹ omega/sigma items treated as zero: 'eta_study_emax', 'eta_study_lkp_easi75'
#> ℹ omega/sigma items treated as zero: 'eta_study_emax', 'eta_study_lkp_easi75'
#> ℹ omega/sigma items treated as zero: 'eta_study_emax', 'eta_study_lkp_easi75'
#> ℹ omega/sigma items treated as zero: 'eta_study_emax', 'eta_study_lkp_easi75'
#> ℹ omega/sigma items treated as zero: 'eta_study_emax', 'eta_study_lkp_easi75'
#> ℹ omega/sigma items treated as zero: 'eta_study_emax', 'eta_study_lkp_easi75'
#> ℹ omega/sigma items treated as zero: 'eta_study_emax', 'eta_study_lkp_easi75'
#> ℹ omega/sigma items treated as zero: 'eta_study_emax', 'eta_study_lkp_easi75'
#> ℹ omega/sigma items treated as zero: 'eta_study_emax', 'eta_study_lkp_easi75'
#> ℹ omega/sigma items treated as zero: 'eta_study_emax', 'eta_study_lkp_easi75'
#> ℹ omega/sigma items treated as zero: 'eta_study_emax', 'eta_study_lkp_easi75'
#> ℹ omega/sigma items treated as zero: 'eta_study_emax', 'eta_study_lkp_easi75'
#> ℹ omega/sigma items treated as zero: 'eta_study_emax', 'eta_study_lkp_easi75'
#> ℹ omega/sigma items treated as zero: 'eta_study_emax', 'eta_study_lkp_easi75'
#> ℹ omega/sigma items treated as zero: 'eta_study_emax', 'eta_study_lkp_easi75'
#> ℹ omega/sigma items treated as zero: 'eta_study_emax', 'eta_study_lkp_easi75'
#> ℹ omega/sigma items treated as zero: 'eta_study_emax', 'eta_study_lkp_easi75'
#> ℹ omega/sigma items treated as zero: 'eta_study_emax', 'eta_study_lkp_easi75'
#> ℹ omega/sigma items treated as zero: 'eta_study_emax', 'eta_study_lkp_easi75'
#> ℹ omega/sigma items treated as zero: 'eta_study_emax', 'eta_study_lkp_easi75'
#> ℹ omega/sigma items treated as zero: 'eta_study_emax', 'eta_study_lkp_easi75'
#> ℹ omega/sigma items treated as zero: 'eta_study_emax', 'eta_study_lkp_easi75'
#> ℹ omega/sigma items treated as zero: 'eta_study_emax', 'eta_study_lkp_easi75'
#> ℹ omega/sigma items treated as zero: 'eta_study_emax', 'eta_study_lkp_easi75'
#> ℹ omega/sigma items treated as zero: 'eta_study_emax', 'eta_study_lkp_easi75'
#> ℹ omega/sigma items treated as zero: 'eta_study_emax', 'eta_study_lkp_easi75'
#> ℹ omega/sigma items treated as zero: 'eta_study_emax', 'eta_study_lkp_easi75'
#> ℹ omega/sigma items treated as zero: 'eta_study_emax', 'eta_study_lkp_easi75'
#> ℹ omega/sigma items treated as zero: 'eta_study_emax', 'eta_study_lkp_easi75'
#> ℹ omega/sigma items treated as zero: 'eta_study_emax', 'eta_study_lkp_easi75'
#> ℹ omega/sigma items treated as zero: 'eta_study_emax', 'eta_study_lkp_easi75'
#> ℹ omega/sigma items treated as zero: 'eta_study_emax', 'eta_study_lkp_easi75'
#> ℹ omega/sigma items treated as zero: 'eta_study_emax', 'eta_study_lkp_easi75'
#> ℹ omega/sigma items treated as zero: 'eta_study_emax', 'eta_study_lkp_easi75'
#> ℹ omega/sigma items treated as zero: 'eta_study_emax', 'eta_study_lkp_easi75'
#> ℹ omega/sigma items treated as zero: 'eta_study_emax', 'eta_study_lkp_easi75'
#> ℹ omega/sigma items treated as zero: 'eta_study_emax', 'eta_study_lkp_easi75'
#> ℹ omega/sigma items treated as zero: 'eta_study_emax', 'eta_study_lkp_easi75'

ggplot(fig3, aes(easi, rate, colour = Week)) +
  geom_line(linewidth = 1) +
  facet_wrap(~ Panel) +
  scale_colour_manual(values = c("Week 12" = "#2c7fb8", "Week 16" = "#d95f02")) +
  labs(x = "Mean baseline EASI score", y = "EASI-75 placebo response (%)",
       colour = NULL) +
  theme_bw() + theme(legend.position = "top")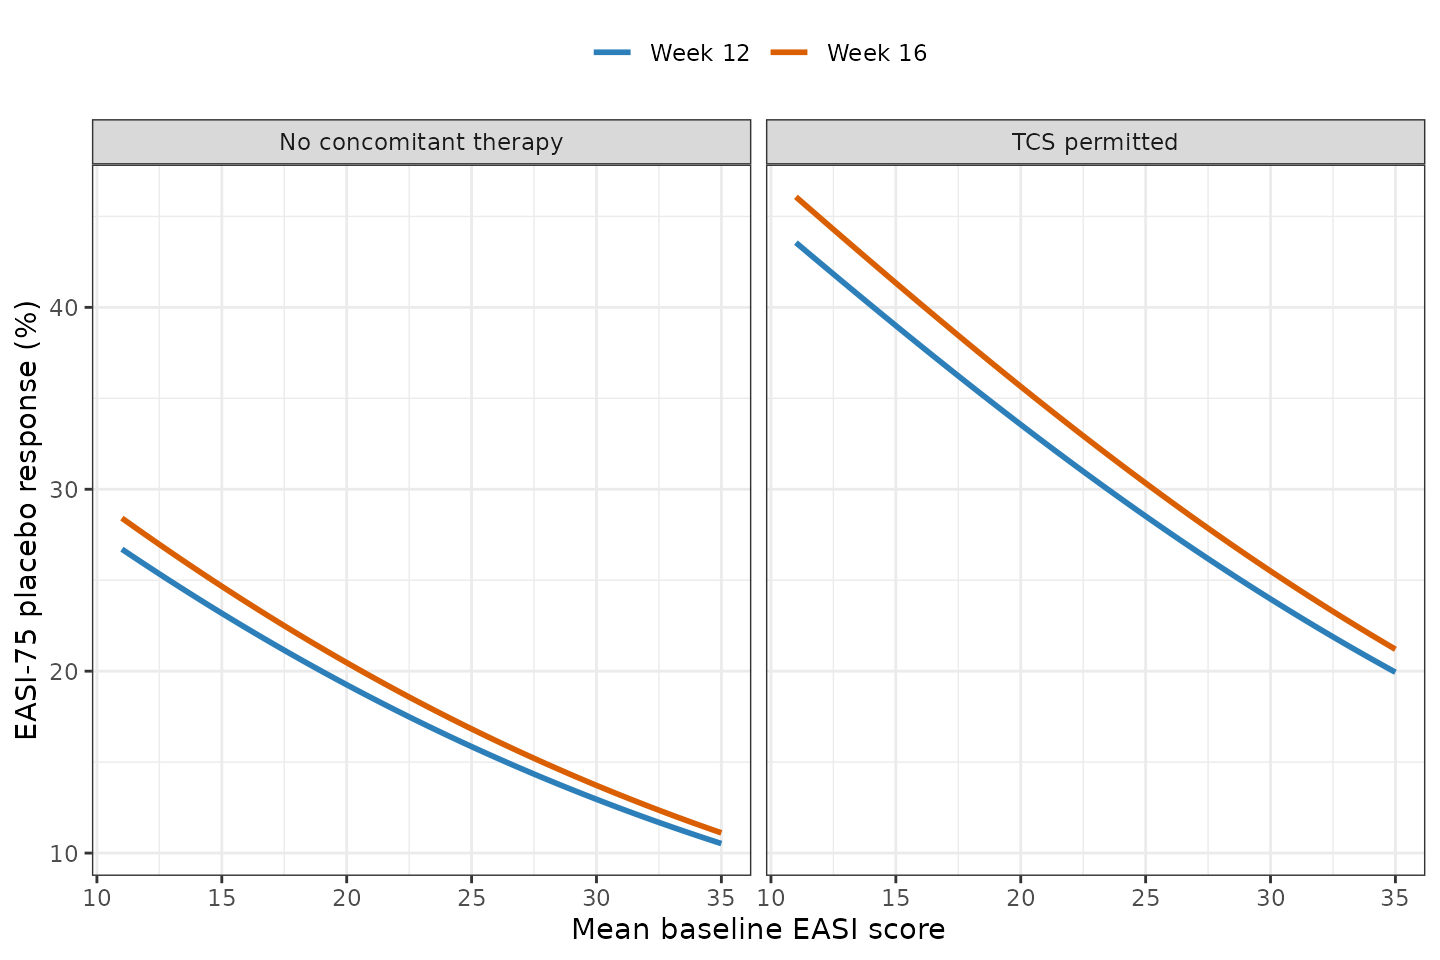
Replicates Figures 2C and 2D of Serrano 2026: model-estimated EASI-75 placebo rates at Weeks 12 and 16 against mean baseline EASI, without (left) and with (right) concomitant TCS therapy.
Both panels decline monotonically: sicker enrolled populations show lower placebo response. The source’s clinical reading of this is that trials enrolling milder AD populations run a higher risk of an inflated placebo arm masking a genuine drug effect.
Replication: Figure 3A, the trial-design grid
Figure 3A is a heatmap of model-estimated placebo rates over baseline EASI, read-out visit and concomitant-therapy status – the table a trial designer would actually consult. The individual cell values are not printed in the text, so this is a replication of the figure’s shape rather than a numeric gate.
grid3 <- tidyr::expand_grid(easi = c(16, 20, 24, 29, 34), week = c(12, 16),
                            tcs = c(0, 1)) |>
  dplyr::rowwise() |>
  dplyr::mutate(rate = 100 * P(easi, tcs, week)) |>
  dplyr::ungroup() |>
  dplyr::mutate(
    Panel = factor(ifelse(tcs == 1, "TCS permitted", "No concomitant therapy"),
                   levels = c("No concomitant therapy", "TCS permitted")),
    Week  = factor(paste("Week", week))
  )
#> ℹ omega/sigma items treated as zero: 'eta_study_emax', 'eta_study_lkp_easi75'
#> ℹ omega/sigma items treated as zero: 'eta_study_emax', 'eta_study_lkp_easi75'
#> ℹ omega/sigma items treated as zero: 'eta_study_emax', 'eta_study_lkp_easi75'
#> ℹ omega/sigma items treated as zero: 'eta_study_emax', 'eta_study_lkp_easi75'
#> ℹ omega/sigma items treated as zero: 'eta_study_emax', 'eta_study_lkp_easi75'
#> ℹ omega/sigma items treated as zero: 'eta_study_emax', 'eta_study_lkp_easi75'
#> ℹ omega/sigma items treated as zero: 'eta_study_emax', 'eta_study_lkp_easi75'
#> ℹ omega/sigma items treated as zero: 'eta_study_emax', 'eta_study_lkp_easi75'
#> ℹ omega/sigma items treated as zero: 'eta_study_emax', 'eta_study_lkp_easi75'
#> ℹ omega/sigma items treated as zero: 'eta_study_emax', 'eta_study_lkp_easi75'
#> ℹ omega/sigma items treated as zero: 'eta_study_emax', 'eta_study_lkp_easi75'
#> ℹ omega/sigma items treated as zero: 'eta_study_emax', 'eta_study_lkp_easi75'
#> ℹ omega/sigma items treated as zero: 'eta_study_emax', 'eta_study_lkp_easi75'
#> ℹ omega/sigma items treated as zero: 'eta_study_emax', 'eta_study_lkp_easi75'
#> ℹ omega/sigma items treated as zero: 'eta_study_emax', 'eta_study_lkp_easi75'
#> ℹ omega/sigma items treated as zero: 'eta_study_emax', 'eta_study_lkp_easi75'
#> ℹ omega/sigma items treated as zero: 'eta_study_emax', 'eta_study_lkp_easi75'
#> ℹ omega/sigma items treated as zero: 'eta_study_emax', 'eta_study_lkp_easi75'
#> ℹ omega/sigma items treated as zero: 'eta_study_emax', 'eta_study_lkp_easi75'
#> ℹ omega/sigma items treated as zero: 'eta_study_emax', 'eta_study_lkp_easi75'

ggplot(grid3, aes(factor(easi), Week, fill = rate)) +
  geom_tile(colour = "white") +
  geom_text(aes(label = sprintf("%.1f%%", rate)), size = 3) +
  facet_wrap(~ Panel) +
  scale_fill_gradient(low = "#2c3e50", high = "#f7f7b0", guide = "none") +
  labs(x = "Mean baseline EASI score", y = NULL) +
  theme_bw()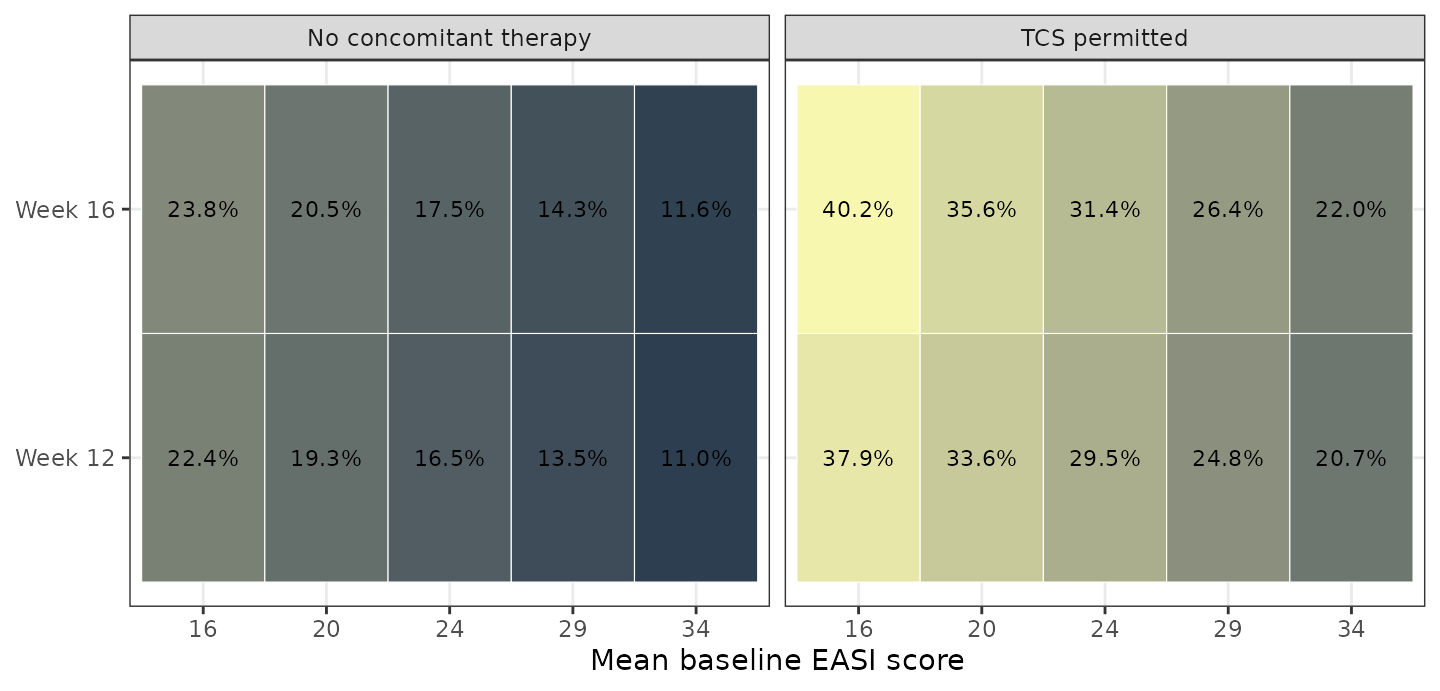
Replicates Figure 3A of Serrano 2026: model-estimated EASI-75 placebo response rates across trial-design conditions.
Reproducing the source’s binomial residual
The source’s residual is the binomial sampling variance of an arm
proportion, P*(1-P)/N, which depends on arm size and so
cannot be carried in ini(). It is two lines downstream of
the solve. Below, the 200 virtual arms are given the source’s median arm
size of 78 patients (Table 2) and their observed responder proportions
are drawn.
rxode2::rxSetSeed(20260912)
set.seed(20260912)

n_per_arm <- 78   # Serrano 2026 Table 2 median arm size (range 27-321)

obs_arms <- cohort |>
  dplyr::filter(time == 12) |>
  dplyr::mutate(
    n_arm     = n_per_arm,
    responders = rbinom(dplyr::n(), size = n_arm, prob = prob_easi75),
    observed_pct = 100 * responders / n_arm
  )

stopifnot(
  # The realised proportions must be unbiased for the model probabilities:
  # the mean discrepancy over 200 arms is a centre statistic, so a tight
  # bound on the CENTRE is correct even though any single arm is noisy.
  abs(mean(obs_arms$observed_pct - obs_arms$rate_pct)) < 1.5,
  # And the realised spread must match the binomial SD it was drawn from,
  # within Monte-Carlo error on 200 draws.
  {
    expected_sd <- sqrt(mean(obs_arms$prob_easi75 * (1 - obs_arms$prob_easi75) / n_per_arm))
    realised_sd <- sd((obs_arms$observed_pct - obs_arms$rate_pct) / 100)
    abs(realised_sd / expected_sd - 1) < 0.25
  }
)

sprintf("binomial residual SD at N = %d: expected %.2f pp, realised %.2f pp",
        n_per_arm,
        100 * sqrt(mean(obs_arms$prob_easi75 * (1 - obs_arms$prob_easi75) / n_per_arm)),
        sd(obs_arms$observed_pct - obs_arms$rate_pct))
#> [1] "binomial residual SD at N = 78: expected 4.16 pp, realised 4.78 pp"
obs_arms |>
  dplyr::select(SCORE_EASI, `Model probability` = rate_pct,
                `Observed proportion` = observed_pct) |>
  tidyr::pivot_longer(-SCORE_EASI, names_to = "which", values_to = "pct") |>
  ggplot(aes(SCORE_EASI, pct, colour = which, shape = which)) +
  geom_point(alpha = 0.6) +
  scale_colour_manual(values = c("Model probability" = "#2c7fb8",
                                 "Observed proportion" = "#d95f02")) +
  scale_shape_manual(values = c("Model probability" = 1, "Observed proportion" = 16)) +
  labs(x = "Mean baseline EASI score", y = "Week 12 EASI-75 rate (%)",
       colour = NULL, shape = NULL) +
  theme_bw() + theme(legend.position = "top")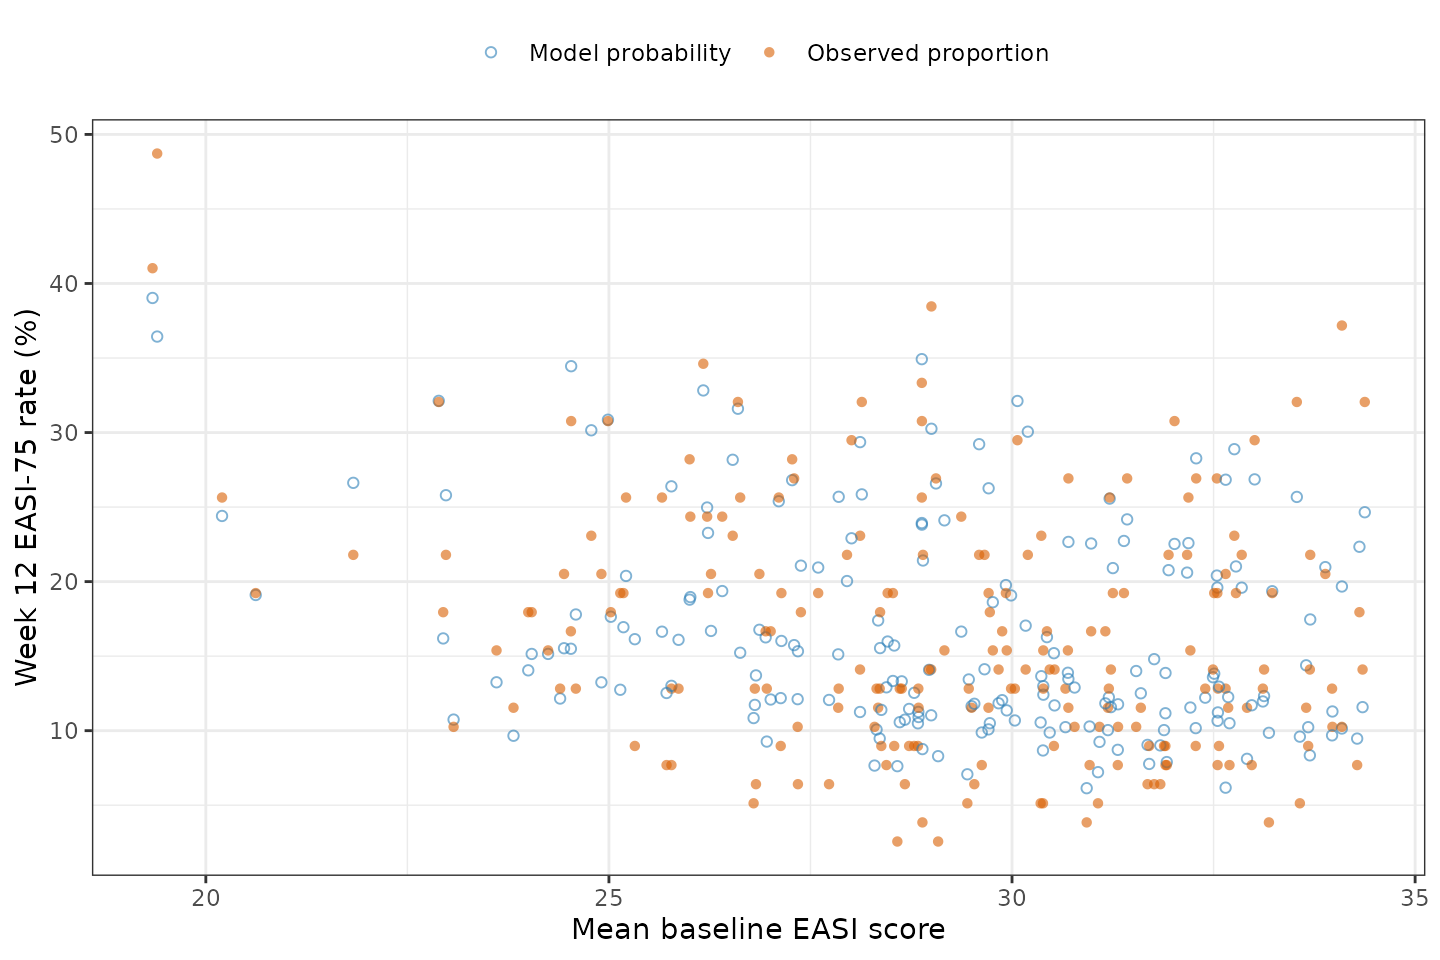
The two variance components of the source, separated: the trajectory-level between-trial variability of 200 virtual arms (open points) and the same arms after adding the binomial sampling noise of a 78-patient arm (filled points).
Clinical interpretation reproduced
The source draws three design conclusions. Each is reproduced here as a computation rather than a quotation.
tibble::tribble(
  ~Claim, ~`Source`, ~`Computed here`,
  "Placebo response has essentially plateaued by Week 12: Week 12 captures about 94% of the Week 16 projection.",
  "Results 3.5 / Figure S10a: 94.2% (95% CI 94.0-94.6)",
  sprintf("%.1f%% (no TCS) to %.1f%% (TCS), baseline EASI 29",
          100 * P(29, 0, 12) / P(29, 0, 16), 100 * P(29, 1, 12) / P(29, 1, 16)),
  "Permitting TCS raises the placebo EASI-75 rate about 1.8-fold.",
  "Abstract; Results 3.3",
  sprintf("%.2f-fold at Week 12, %.2f-fold at Week 16", P(29, 1, 12) / P(29, 0, 12), P(29, 1, 16) / P(29, 0, 16)),
  "Each 1-point higher mean baseline EASI lowers the placebo rate about 0.96-fold, similarly in both therapy groups.",
  "Abstract; Results 3.4",
  sprintf("%.3f (no TCS) and %.3f (TCS) per point at Week 12", P(30, 0, 12) / P(29, 0, 12), P(30, 1, 12) / P(29, 1, 12))
) |>
  knitr::kable(caption = "The source's three design conclusions, recomputed from the encoded model.")
#> ℹ omega/sigma items treated as zero: 'eta_study_emax', 'eta_study_lkp_easi75'
#> ℹ omega/sigma items treated as zero: 'eta_study_emax', 'eta_study_lkp_easi75'
#> ℹ omega/sigma items treated as zero: 'eta_study_emax', 'eta_study_lkp_easi75'
#> ℹ omega/sigma items treated as zero: 'eta_study_emax', 'eta_study_lkp_easi75'
#> ℹ omega/sigma items treated as zero: 'eta_study_emax', 'eta_study_lkp_easi75'
#> ℹ omega/sigma items treated as zero: 'eta_study_emax', 'eta_study_lkp_easi75'
#> ℹ omega/sigma items treated as zero: 'eta_study_emax', 'eta_study_lkp_easi75'
#> ℹ omega/sigma items treated as zero: 'eta_study_emax', 'eta_study_lkp_easi75'
#> ℹ omega/sigma items treated as zero: 'eta_study_emax', 'eta_study_lkp_easi75'
#> ℹ omega/sigma items treated as zero: 'eta_study_emax', 'eta_study_lkp_easi75'
#> ℹ omega/sigma items treated as zero: 'eta_study_emax', 'eta_study_lkp_easi75'
#> ℹ omega/sigma items treated as zero: 'eta_study_emax', 'eta_study_lkp_easi75'| Claim | Source | Computed here |
|---|---|---|
| Placebo response has essentially plateaued by Week 12: Week 12 captures about 94% of the Week 16 projection. | Results 3.5 / Figure S10a: 94.2% (95% CI 94.0-94.6) | 94.4% (no TCS) to 94.0% (TCS), baseline EASI 29 |
| Permitting TCS raises the placebo EASI-75 rate about 1.8-fold. | Abstract; Results 3.3 | 1.84-fold at Week 12, 1.85-fold at Week 16 |
| Each 1-point higher mean baseline EASI lowers the placebo rate about 0.96-fold, similarly in both therapy groups. | Abstract; Results 3.4 | 0.960 (no TCS) and 0.965 (TCS) per point at Week 12 |
plateau <- vapply(list(c(29, 0), c(29, 1), c(19, 0), c(34, 1)), function(a)
  P(a[1], a[2], 12) / P(a[1], a[2], 16), numeric(1))
#> ℹ omega/sigma items treated as zero: 'eta_study_emax', 'eta_study_lkp_easi75'
#> ℹ omega/sigma items treated as zero: 'eta_study_emax', 'eta_study_lkp_easi75'
#> ℹ omega/sigma items treated as zero: 'eta_study_emax', 'eta_study_lkp_easi75'
#> ℹ omega/sigma items treated as zero: 'eta_study_emax', 'eta_study_lkp_easi75'
#> ℹ omega/sigma items treated as zero: 'eta_study_emax', 'eta_study_lkp_easi75'
#> ℹ omega/sigma items treated as zero: 'eta_study_emax', 'eta_study_lkp_easi75'
#> ℹ omega/sigma items treated as zero: 'eta_study_emax', 'eta_study_lkp_easi75'
#> ℹ omega/sigma items treated as zero: 'eta_study_emax', 'eta_study_lkp_easi75'
stopifnot(
  # "Week 12 captures approximately 94.2% of the Week 16 response", checked
  # across four trial conditions rather than at one point.
  all(abs(100 * plateau - 94.2) < 1.5)
)
round(100 * plateau, 2)
#> [1] 94.38 93.99 94.04 94.03
The per-point rate ratio is the one published number the encoded model does not land on exactly: the source reports 0.961 (95% CI 0.949-0.972) and the model gives 0.960 at baseline EASI 29. The ratio is not constant in a logistic model – it depends slightly on which pair of baseline scores it is evaluated between – and the source computes it as an average over pairs (Table S8, not available when this model was built), so 0.960 versus 0.961 is a rounding-level difference well inside the published interval, not a transcription error. The spread across the observed baseline range is small:
tibble::tibble(
  `Baseline EASI pair` = c("19 -> 20", "24 -> 25", "29 -> 30", "34 -> 35"),
  `Week 12 rate ratio` = vapply(c(19, 24, 29, 34), function(e)
    P(e + 1, 0, 12) / P(e, 0, 12), numeric(1))
) |>
  knitr::kable(digits = 4,
               caption = "The per-point rate ratio varies slightly with where it is evaluated; the source reports an average of 0.961.")
#> ℹ omega/sigma items treated as zero: 'eta_study_emax', 'eta_study_lkp_easi75'
#> ℹ omega/sigma items treated as zero: 'eta_study_emax', 'eta_study_lkp_easi75'
#> ℹ omega/sigma items treated as zero: 'eta_study_emax', 'eta_study_lkp_easi75'
#> ℹ omega/sigma items treated as zero: 'eta_study_emax', 'eta_study_lkp_easi75'
#> ℹ omega/sigma items treated as zero: 'eta_study_emax', 'eta_study_lkp_easi75'
#> ℹ omega/sigma items treated as zero: 'eta_study_emax', 'eta_study_lkp_easi75'
#> ℹ omega/sigma items treated as zero: 'eta_study_emax', 'eta_study_lkp_easi75'
#> ℹ omega/sigma items treated as zero: 'eta_study_emax', 'eta_study_lkp_easi75'| Baseline EASI pair | Week 12 rate ratio |
|---|---|
| 19 -> 20 | 0.9628 |
| 24 -> 25 | 0.9613 |
| 29 -> 30 | 0.9599 |
| 34 -> 35 | 0.9588 |
Assumptions and deviations
Encoding decisions.
-
e0andemaxare held on the logit scale without a transform prefix, because that is the scale the source estimates and reports them on. They are not log-transformed linear-scale quantities. -
lkp_easi75holdslog(k)rather thank, because the source’s own random effect is exponential on the onset rate (k_i = k * exp(f_k(X, beta) + gamma_i)), solog(k)is the scale on whichgammais additive and normal.exp(lkp_easi75)recovers Table 4’s 0.291 exactly and is asserted above. - The centring constant 29 is hard coded. It is the
across-trial mean baseline EASI, printed inside the
source’s own final numeric equation
(
- 0.0486 * (EASI_i - 29)) and restated in Results 3.3. It is deliberately not the Table 2 median of 29.6; Methods 2.4 defines the continuous-covariate form astheta_X * (X - Xbar)withXbarthe mean. - The final model carries no covariate on the onset rate. This is a finding of the paper, not an omission from this encoding: “none of the evaluated covariates showed significant effects [on the onset rate] despite observed inter-trial variability, indicating that key determinants remain unidentified” (Discussion).
- The two random effects are between-trial, not between-subject. This model must not be used to simulate individual patients’ responses.
-
addSd_prob_easi75 = fixed(0.001)is not from the source. It exists only so the nlmixr2 likelihood machinery accepts the model for forward simulation; the source’s actual residual is the binomial sampling variance reproduced in its own section above. Same device asBhatnagar_2024_upadacitinib_asas20_as.
Not encoded (see Errata). The binomial residual
P*(1-P)/N and the AR(1) within-trial residual correlation
phi = 0.759. Neither affects a typical-value prediction,
which is why all six published quantities are reproduced exactly.
Assumed because the source does not say.
- The virtual trial-arm cohort in Validation 3 is constructed, not extracted. The per-trial covariate values are in supplementary Table S1, which was not available when this model was built. Arm-mean baseline EASI is drawn from a Beta(6, 1.84) scaled to the observed range 11.1-34.5, chosen because it matches all three marginal statistics Table 2 reports (mean 29, median 29.6, range). TCS permission is assigned at the observed 14-in-41 frequency and independently of baseline EASI, which Table S3’s finding of “broadly comparable median values of study arm demographics and baseline disease metrics across these categorical groups” supports but does not prove.
- The arm size of 78 used for the binomial-residual
demonstration is the Table 2 median (range 27-321); the source weights
each arm by its own
N. - The approximate confidence intervals in Validation 2 use only the marginal standard errors implied by the tabulated %RSE. The source resampled from the full variance-covariance matrix, which is not published, so those intervals will be somewhat too wide wherever the parameters are correlated. They are shown as a plausibility check and are not asserted.
- The percent-female figure in
populationis derived as100 - 55.1from the Table 2 median “Percent of males”, so it is a median across arms rather than a pooled patient proportion.
Range of validity. Arm-mean baseline EASI between about 11 and 35, which is the range the source’s trials span, and times within a roughly 20-week double-blind period. Extrapolating the linear-in-logit baseline-EASI effect far outside 11-35 is unsupported, and the model says nothing at all about drug-treated arms – it is a control-arm model.
Six covariates were screened and rejected and are
recorded in the model file: mean affected body surface area, mean
disease duration, prior therapy, trial start year, study phase (Phase 2
versus Phase 3), and the proportion of male patients, plus mean age and
mean weight which are carried in covariatesDataExcluded.
Affected BSA is the interesting one: it did show a significant
univariate inverse correlation with the Week 12 placebo rate (r = -0.39,
p < 0.05) but is 0.96-correlated with baseline EASI – unsurprising,
since affected BSA is a component of the EASI score itself – and lost to
it in the stepwise selection. Do not read its rejection as evidence that
body surface area is irrelevant.