Drug-elimination-pathway ontogeny and paediatric DDI (Salem 2013)
Source:vignettes/articles/Salem_2013_cyp_ontogeny.Rmd
Salem_2013_cyp_ontogeny.RmdModel and source
- Citation: Salem F, Johnson TN, Barter ZE, Leeder JS, Rostami-Hodjegan A. Age related changes in fractional elimination pathways for drugs: assessing the impact of variable ontogeny on metabolic drug-drug interactions. J Clin Pharmacol. 2013;53(8):857-865. doi:10.1002/jcph.100.
- Article: https://doi.org/10.1002/jcph.100
Salem 2013 is not a drug model. It is the system layer that a paediatric physiologically-based pharmacokinetic (p-PBPK) model sits on: ten algebraic functions giving the activity or protein expression of a drug-elimination pathway relative to its own adult value, from birth to 20 years. The paper’s argument is that the magnitude of a metabolic drug-drug interaction (DDI) depends on the fraction of the victim drug cleared by the inhibited route (fm), that fm is not age-invariant because each pathway matures at its own rate, and that a DDI which is trivial in adults can therefore be serious in a neonate – and vice versa.
The packaged model has no drug, no dose, no compartments and no ODEs.
Every output is an algebraic function of the rxode2 time
variable, which the model interprets as postnatal age in
years. Solving over time = 0 to 20
traces the published range.
Drug-elimination-pathway ontogeny (system-parameter) model for birth to 20 years (Salem 2013 J Clin Pharmacol). Ten algebraic functions give the activity or protein expression of an elimination pathway relative to its own adult value: hepatic CYP1A2, CYP2B6, CYP2C8, CYP2C9, CYP2C18/19, CYP2D6, CYP2E1 and CYP3A4/5, enterocytic (gut) CYP3A4/5, and renal function. The nine CYP pathways follow the sigmoidal (hyperbolic) maturation form of Equation 1, fraction of adult = Fbirth + (AdultMax - Fbirth) * Age^n / (Agemid^n + Age^n), with Age in years; renal function follows a quadratic in body surface area normalised to an adult glomerular filtration rate of 120 mL/min. This is a SYSTEM layer, not a drug model: it has no drug, no dosing, no compartments and no ODEs, and every output is an algebraic function of the rxode2 time variable, which the model interprets as postnatal age in YEARS. Ratios of two pathway functions (Equation 2) quantify differential ontogeny and hence the age-dependence of the fraction metabolised by each route, which is what drives the age-dependence of metabolic drug-drug interactions. Valid from birth to 20 years. No between-subject variability is encoded: the paper propagates uncertainty by bootstrapping the residual variance about each regression line, and the per-pathway residual variances are not reported.
Population
The ontogeny functions themselves are regressions on pooled in vitro human liver-bank expression and catalytic-activity data (Supplementary Table S1 references 1 to 16), updated from the models of Johnson et al. 2006. The paper does not restate the per-study subject counts.
The hypothetical DDI simulations that motivate the ontogeny comparison were run in Simcyp Paediatric v12 with 100 simulations x 10 trials x 10 subjects = 10,000 virtual subjects per age band, fraction of females 0.5, over age bands 1 day (0.00274 to 0.00276 years), 7 days, 1 month, 1 year, 2 years and 20 years (19.99 to 20.01 years). Those simulations depend on Simcyp’s proprietary system parameters (liver size, liver blood flow, enzyme abundance, fraction unbound) and are not reproducible outside that platform; only the Supplementary Table S1 ontogeny functions are extracted here.
Uncertainty around each ontogeny line was propagated by bootstrapping the residual variance S0^2 about the regression (Equations 3 and 4), 10,000 iterations per pathway per age point. The per-pathway S0 values are not reported, so the packaged model carries no between-subject variability and no residual error – it is a deterministic system layer.
Source trace
Every packaged value is taken verbatim from a printed equation.
Supplementary Table S1’s “Hyperbolic function” column is a set of ten
Microsoft Equation 3.0 OLE objects embedded in the supplementary
.doc; plain-text extraction of that file yields only
EMBED Equation.3 placeholders, so the objects were decoded
from the file’s ObjectPool storage (streams
_1425384659 through _1425384668). The decoded
equations are quoted verbatim in the model file’s comments and are
listed below.
| Quantity | Source |
|---|---|
| Maturation form: fraction of adult = Fbirth + (AdultMax - Fbirth) * Age^n / (Agemid^n + Age^n) | Equation (1), page 858 |
| Pathway-ratio definition (Paed_i/Adult_i) / (Paed_j/Adult_j) | Equation (2), page 858 |
| CYP1A2 = (1.05 - 0.08) * Age^1.1 / (1.69^1.1 + Age^1.1) + 0.08 | Supplementary Table S1, decoded equation object |
| CYP2B6 = (1 - 0.1) * Age / (1 + Age) + 0.1 | Supplementary Table S1, decoded equation object (exponent boxes empty; see Errata) |
| CYP2C8 = (1 - 0.3) * Age / (0.02 + Age) + 0.3 | Supplementary Table S1, decoded equation object |
| CYP2C9 = (1 - 0.17) * Age^0.53 / (0.016^0.53 + Age^0.53) + 0.17 | Supplementary Table S1, decoded equation object |
| CYP2C19 = (1 - 0.3) * Age^2.44 / (0.28^2.44 + Age^2.44) + 0.3 | Supplementary Table S1, decoded equation object |
| CYP2D6 = (1.0 - 0.036) * Age / (0.1 + Age) + 0.036 | Supplementary Table S1, decoded equation object |
| CYP2E1 = (1.074 - 0.086) * Age^0.496 / (0.226^0.496 + Age^0.496) + 0.086 | Supplementary Table S1, decoded equation object |
| CYP3A4/5 hepatic = 1.061 * Age^0.78 / (0.66^0.78 + Age^0.78) | Supplementary Table S1, decoded equation object |
| CYP3A4/5 gut = (1 - 0.42) * Age / (2.357 + Age) + 0.42 | Supplementary Table S1, decoded equation object |
| Renal = ((-0.61604 * BSA^2) + (99.054 * BSA) - 17.74) / 120 | Supplementary Table S1, decoded equation object (renal row) |
| Birth levels annotated 0.17 (CYP2C9), 0.04 (CYP2D6), 0 (CYP1A2), 0 (CYP3A4) | Figure 1 in-panel annotations, page 860 |
| Time to half adult expression, all pathways (descriptive column) | Supplementary Table S1, column 4 |
| fm % by pathway for COMP 1 and COMP 2 at day 1, year 1 and year 20 | Table 1, page 860 |
| COMP 3 fm by CYP2D6 / CYP3A4 across six age bands | Figure 4 (left panel) and page 860 text |
| 20.9-fold CYP2C9:CYP1A2 disparity at day 1 | Discussion, page 861 |
| 2.4-fold CYP2B6:CYP2C18/19 disparity at month 5 | Results, page 860 |
| Simulation design (100 sims x 10 trials x 10 subjects; age bands) | Methods, ‘Hypothetical Age Related Changes in DDI’ |
Solving the ontogeny functions
age_grid <- exp(seq(log(1 / 365.25), log(20), length.out = 500))

ev <- data.frame(
  id   = 1L,
  time = age_grid,
  BSA  = 0.22       # placeholder; only the renal output uses BSA
)

sim <- rxode2::rxSolve(ui, ev, returnType = "data.frame")

ont_cols <- grep("^ont_cyp", names(sim), value = TRUE)
long <- sim |>
  dplyr::select(dplyr::all_of(c("time", ont_cols))) |>
  tidyr::pivot_longer(-time, names_to = "pathway", values_to = "fraction") |>
  dplyr::mutate(pathway = toupper(sub("^ont_", "", pathway)))

head(sim[, c("time", "age_y", ont_cols)], 3)
#>          time       age_y ont_cyp1a2 ont_cyp2b6 ont_cyp2c8 ont_cyp2c9
#> 1 0.002737851 0.002737851 0.08082580  0.1024573  0.3842866  0.4038739
#> 2 0.002787100 0.002787100 0.08084215  0.1025014  0.3856173  0.4054643
#> 3 0.002837234 0.002837234 0.08085881  0.1025463  0.3869661  0.4070613
#>   ont_cyp2c19 ont_cyp2d6 ont_cyp2e1 ont_cyp3a4 ont_cyp3a4gut
#> 1   0.3000087 0.06168954  0.1855313 0.01451010     0.4206729
#> 2   0.3000091 0.06213912  0.1863256 0.01471047     0.4206850
#> 3   0.3000095 0.06259634  0.1871254 0.01491357     0.4206973
Structural identity check
The packaged model() block must reproduce Equation (1)
exactly. This is a deterministic model, so the comparison against an
independent closed-form implementation is pure floating-point noise and
a tight bound is appropriate.
hill_fn <- function(age, amax, fbirth, t50, n) {
  fbirth + (amax - fbirth) * age^n / (t50^n + age^n)
}

# Parameter values read back out of the packaged model, not re-typed.
th <- ui$theta
pathways <- c("cyp1a2", "cyp2b6", "cyp2c8", "cyp2c9", "cyp2c19",
              "cyp2d6", "cyp2e1", "cyp3a4", "cyp3a4gut")

max_abs_diff <- max(vapply(pathways, function(p) {
  ref <- hill_fn(sim$time,
                 th[[paste0(p, "_max")]], th[[paste0(p, "_birth")]],
                 th[[paste0(p, "_t50")]], th[[paste0(p, "_hill")]])
  max(abs(sim[[paste0("ont_", p)]] - ref))
}, numeric(1)))

renal_ref <- (th[["renal_bsa2"]] * 0.22^2 + th[["renal_bsa1"]] * 0.22 +
                th[["renal_int"]]) / th[["renal_adult"]]

stopifnot(
  max_abs_diff < 1e-8,
  abs(sim$ont_renal[1] - renal_ref) < 1e-12,
  # Every CYP pathway is monotonically non-decreasing in age.
  all(vapply(pathways, function(p) all(diff(sim[[paste0("ont_", p)]]) >= -1e-12),
             logical(1))),
  # and stays on a sensible fraction-of-adult scale over 0 to 20 y.
  all(vapply(pathways, function(p) {
    v <- sim[[paste0("ont_", p)]]
    all(v >= 0) && all(v <= 1.11)
  }, logical(1))),
  # Each pathway is essentially mature by 20 years.
  all(vapply(pathways, function(p) {
    utils::tail(sim[[paste0("ont_", p)]], 1) > 0.93
  }, logical(1)))
)
max_abs_diff
#> [1] 0
Each function must also start from its own printed
Fbirth as age tends to zero, which is an independent check
that the additive birth term was transcribed into the right slot of
Equation (1).
# The probe age must be small enough that Age^n is negligible against
# Agemid^n even for the shallowest exponent in the table (CYP2E1, n = 0.496).
tiny <- 1e-40
birth_limit <- vapply(pathways, function(p) {
  hill_fn(tiny, th[[paste0(p, "_max")]], th[[paste0(p, "_birth")]],
          th[[paste0(p, "_t50")]], th[[paste0(p, "_hill")]])
}, numeric(1))
birth_par <- vapply(pathways, function(p) th[[paste0(p, "_birth")]], numeric(1))

stopifnot(max(abs(birth_limit - birth_par)) < 1e-12)
round(birth_par, 4)
#>    cyp1a2    cyp2b6    cyp2c8    cyp2c9   cyp2c19    cyp2d6    cyp2e1    cyp3a4
#>     0.080     0.100     0.300     0.170     0.300     0.036     0.086     0.000
#> cyp3a4gut
#>     0.420
Replication of Figure 1
Figure 1 plots the four pathways used by the hypothetical compounds – CYP1A2 and CYP2C9 (COMP 1), CYP2D6 and CYP3A4 (COMP 2) – on a log age axis from 0.01 to 20 years, and annotates the birth level of each.
fig1 <- long |>
  dplyr::filter(pathway %in% c("CYP1A2", "CYP2C9", "CYP2D6", "CYP3A4"),
                time >= 0.01) |>
  dplyr::mutate(panel = ifelse(pathway %in% c("CYP1A2", "CYP2C9"),
                               "CYP1A2 vs CYP2C9", "CYP3A4 vs CYP2D6"))

ggplot(fig1, aes(time, fraction, colour = pathway)) +
  geom_line(linewidth = 0.9) +
  facet_wrap(~panel) +
  scale_x_log10(breaks = c(0.01, 0.1, 1, 10)) +
  coord_cartesian(ylim = c(0, 1)) +
  labs(x = "Age (years)", y = "Fraction of adult value", colour = NULL) +
  theme_bw() +
  theme(legend.position = "bottom")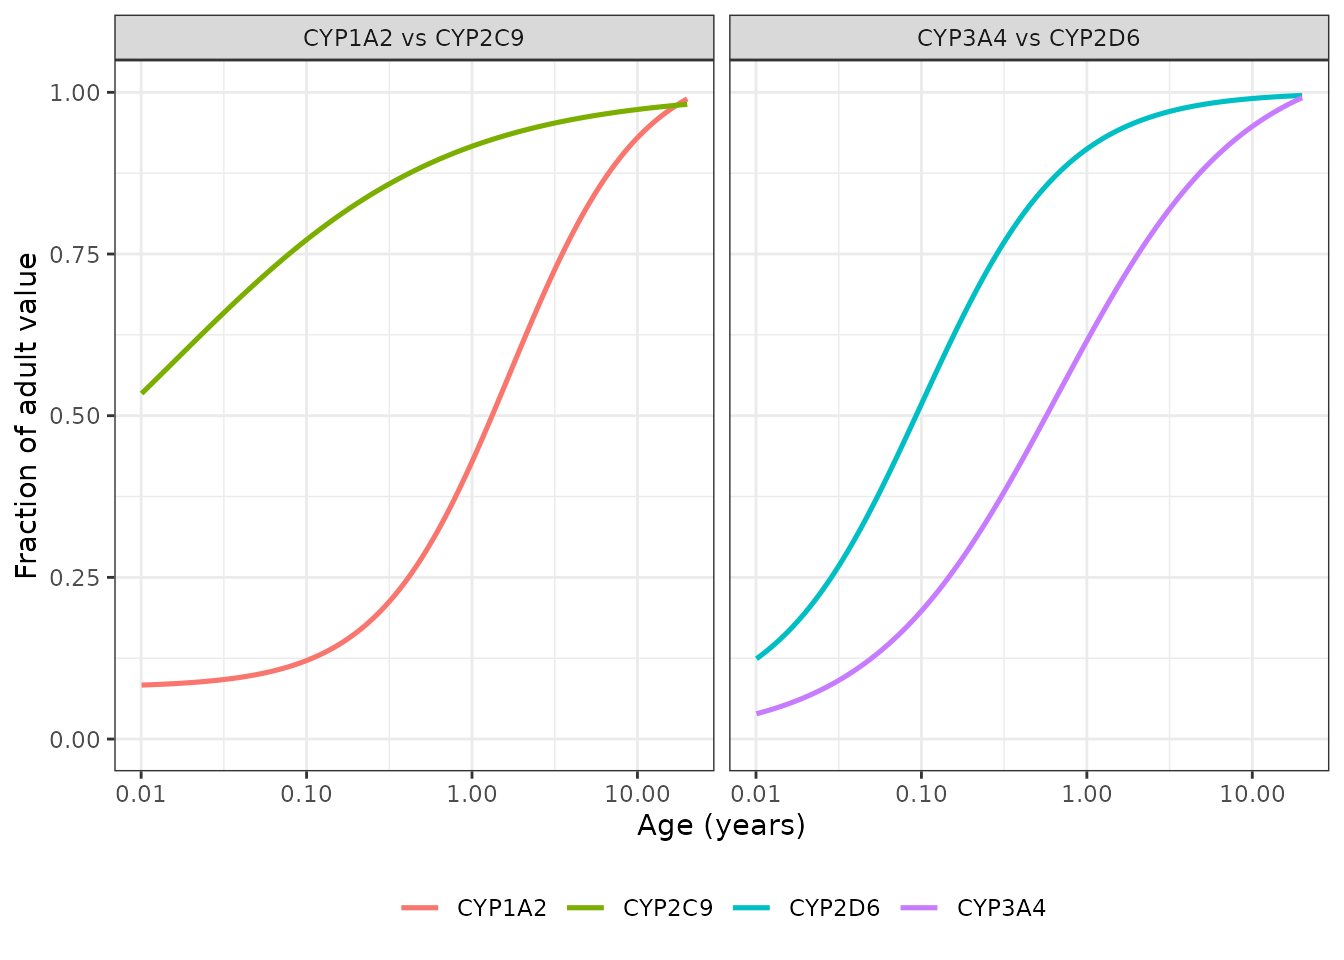
Replicates Figure 1 of Salem 2013. Left: CYP1A2 vs CYP2C9. Right: CYP3A4 vs CYP2D6.
Figure 1 annotates four birth levels directly on the panels. Three of the four match the packaged (printed) constants; the CYP1A2 annotation does not, and is the subject of the first Errata entry below.
anchors <- tibble::tibble(
  Pathway   = c("CYP2C9", "CYP2D6", "CYP3A4", "CYP1A2"),
  Model     = c(birth_par[["cyp2c9"]], birth_par[["cyp2d6"]],
                birth_par[["cyp3a4"]], birth_par[["cyp1a2"]]),
  `Figure 1` = c(0.17, 0.04, 0, 0),
  Agrees    = c(TRUE, TRUE, TRUE, FALSE)
)

stopifnot(
  # The three pathways whose printed equation and Figure 1 annotation agree.
  all(abs(anchors$Model[anchors$Agrees] - anchors$`Figure 1`[anchors$Agrees]) <= 0.005),
  # CYP1A2 is a KNOWN, DOCUMENTED mismatch: the equation prints 0.08 where the
  # figure annotates 0. Pinned so a future edit to the model cannot silently
  # change which of the two the package ships. See Errata.
  abs(birth_par[["cyp1a2"]] - 0.08) < 1e-12
)
knitr::kable(anchors, digits = 3,
caption = "Birth levels annotated in Figure 1 of Salem 2013 vs the packaged constants.")| Pathway | Model | Figure 1 | Agrees |
|---|---|---|---|
| CYP2C9 | 0.170 | 0.17 | TRUE |
| CYP2D6 | 0.036 | 0.04 | TRUE |
| CYP3A4 | 0.000 | 0.00 | TRUE |
| CYP1A2 | 0.080 | 0.00 | FALSE |
The Results text makes one directly testable qualitative claim about Figure 1: it “shows a higher activity at each age (relative to adults) for CYPs 2C9 and CYPs 2D6” than for their panel partners.
gap_2d6_3a4 <- min(sim$ont_cyp2d6 - sim$ont_cyp3a4)
gap_2c9_1a2 <- min(sim$ont_cyp2c9 - sim$ont_cyp1a2)

stopifnot(
  # CYP2D6 exceeds CYP3A4 at every age in the published range.
  gap_2d6_3a4 > 0
)
c(min_CYP2D6_minus_CYP3A4 = round(gap_2d6_3a4, 4),
  min_CYP2C9_minus_CYP1A2 = round(gap_2c9_1a2, 4))
#> min_CYP2D6_minus_CYP3A4 min_CYP2C9_minus_CYP1A2
#>                  0.0035                 -0.0085
CYP2C9 exceeds CYP1A2 across almost the whole range but dips
marginally below it in late adolescence, because the printed CYP1A2
AdultMax is 1.05 while CYP2C9’s is 1.00, so the two curves
cross just before 20 years. The gap is under 0.01 fraction-of-adult
units and is invisible at the scale of Figure 1.
The Supplementary Table S1 summary columns
Supplementary Table S1 carries, alongside each pathway’s equation, two descriptive columns: the fractional expression at birth, and a “time to half adult expression”. Reading the latter as the age at which the function reaches 0.5, neither column is reproducible from the printed equations for most rows. The table is reported here rather than asserted, because it establishes that these columns are rounded annotation and cannot be used to override the equations.
published_half <- c(cyp1a2 = 1.8, cyp2b6 = 1.2, cyp2c8 = 0.008, cyp2c9 = 0.005,
                    cyp2c19 = 0.2, cyp2d6 = 0.08, cyp2e1 = 0.1, cyp3a4 = 0.6,
                    cyp3a4gut = 0.3)

half_age <- vapply(names(published_half), function(p) {
  f <- function(a) {
    hill_fn(a, th[[paste0(p, "_max")]], th[[paste0(p, "_birth")]],
            th[[paste0(p, "_t50")]], th[[paste0(p, "_hill")]]) - 0.5
  }
  stats::uniroot(f, c(1e-9, 60), tol = 1e-12)$root
}, numeric(1))

half_tab <- tibble::tibble(
  Pathway              = toupper(names(published_half)),
  `From the equation`  = signif(half_age, 3),
  `Table S1 column`    = unname(published_half),
  Ratio                = round(half_age / published_half, 3)
)

stopifnot(
  # Every row is within a factor of two, so no equation was mis-transcribed by
  # an order of magnitude, but NO row is exact -- which is the point.
  all(half_tab$Ratio > 0.5), all(half_tab$Ratio < 2.0),
  # At least four rows disagree by more than 15 %, confirming the column is
  # annotation rather than a parameter source.
  sum(abs(half_tab$Ratio - 1) > 0.15) >= 4L
)
knitr::kable(half_tab,
caption = "Age at half the adult value: implied by the printed equation vs the Supplementary Table S1 column.")| Pathway | From the equation | Table S1 column | Ratio |
|---|---|---|---|
| CYP1A2 | 1.32000 | 1.800 | 0.735 |
| CYP2B6 | 0.80000 | 1.200 | 0.667 |
| CYP2C8 | 0.00800 | 0.008 | 1.000 |
| CYP2C9 | 0.00731 | 0.005 | 1.461 |
| CYP2C19 | 0.19200 | 0.200 | 0.962 |
| CYP2D6 | 0.09280 | 0.080 | 1.160 |
| CYP2E1 | 0.11700 | 0.100 | 1.169 |
| CYP3A4 | 0.56900 | 0.600 | 0.949 |
| CYP3A4GUT | 0.37700 | 0.300 | 1.257 |
Age-dependence of the fraction metabolised (Table 1)
Equation (2) makes the fm calculation explicit. If a drug is cleared by named routes i with adult fractions fm_i(adult), and each route matures with its own ontogeny function Ont_i(age), then at any age
fm_i(age) = fm_i(adult) * Ont_i(age) / sum_j (fm_j(adult) * Ont_j(age))
because every non-pathway-specific scaling (liver size, blood flow, protein binding) is common to numerator and denominator and cancels. Table 1 of the paper reports the Simcyp-derived fm for two hypothetical compounds – COMP 1 (CYP1A2 + CYP2C9) and COMP 2 (CYP3A4 + CYP2D6) – at day 1, year 1 and year 20. This is the strongest independent answer key available for the ontogeny functions, because it was produced by the full p-PBPK platform rather than from Equation (1).
ont_at <- function(p, age) {
  hill_fn(age, th[[paste0(p, "_max")]], th[[paste0(p, "_birth")]],
          th[[paste0(p, "_t50")]], th[[paste0(p, "_hill")]])
}

fm_by_age <- function(paths, fm_adult, ages, adult_age = 20) {
  w <- fm_adult / vapply(paths, ont_at, numeric(1), age = adult_age)
  vapply(ages, function(a) {
    o <- vapply(paths, ont_at, numeric(1), age = a)
    100 * (w * o) / sum(w * o)
  }, numeric(length(paths)))
}

ages_tab1 <- c(`Day 1` = 1 / 365.25, `Year 1` = 1, `Year 20` = 20)

comp1 <- fm_by_age(c("cyp1a2", "cyp2c9"), c(0.93, 0.07), ages_tab1)
comp2 <- fm_by_age(c("cyp3a4", "cyp2d6"), c(0.80, 0.20), ages_tab1)

fm_tab <- tibble::tibble(
  Age                       = names(ages_tab1),
  `COMP 1 CYP1A2 model`     = round(comp1[1, ], 1),
  `COMP 1 CYP1A2 published` = c(47, 86, 93),
  `COMP 1 CYP2C9 model`     = round(comp1[2, ], 1),
  `COMP 1 CYP2C9 published` = c(53, 14, 7),
  `COMP 2 CYP3A4 model`     = round(comp2[1, ], 1),
  `COMP 2 CYP3A4 published` = c(51, 74, 80),
  `COMP 2 CYP2D6 model`     = round(comp2[2, ], 1),
  `COMP 2 CYP2D6 published` = c(49, 26, 20)
)
knitr::kable(fm_tab, digits = 1,
caption = "Fraction metabolised by each pathway (%), model vs Table 1 of Salem 2013.")| Age | COMP 1 CYP1A2 model | COMP 1 CYP1A2 published | COMP 1 CYP2C9 model | COMP 1 CYP2C9 published | COMP 2 CYP3A4 model | COMP 2 CYP3A4 published | COMP 2 CYP2D6 model | COMP 2 CYP2D6 published |
|---|---|---|---|---|---|---|---|---|
| Day 1 | 72.5 | 47 | 27.5 | 53 | 48.6 | 51 | 51.4 | 49 |
| Year 1 | 86.0 | 86 | 14.0 | 14 | 73.0 | 74 | 27.0 | 26 |
| Year 20 | 93.0 | 93 | 7.0 | 7 | 80.0 | 80 | 20.0 | 20 |
COMP 2 reproduces all three published age bands. COMP 1 reproduces year 1 and year 20 exactly but misses the day-1 band badly, and the single parameter responsible is the CYP1A2 birth level (Errata, first entry). The contrast between the two compounds is the cleanest evidence in the paper that the printed CYP1A2 row is the outlier: the same fm identity, applied to the same platform output, is accurate to about two percentage points for CYP3A4 and CYP2D6 and wrong by 25 for CYP1A2.
comp2_err <- max(abs(fm_tab$`COMP 2 CYP3A4 model` - fm_tab$`COMP 2 CYP3A4 published`))
comp1_day1_err <- abs(fm_tab$`COMP 1 CYP1A2 model`[1] -
                        fm_tab$`COMP 1 CYP1A2 published`[1])

stopifnot(
  # COMP 2 reproduces every age band to within 2.5 percentage points.
  comp2_err <= 2.5,
  # COMP 1 reproduces year 1 and year 20 to within 0.5 percentage points.
  all(abs(fm_tab$`COMP 1 CYP1A2 model`[2:3] -
            fm_tab$`COMP 1 CYP1A2 published`[2:3]) <= 0.5),
  # KNOWN non-reproduction, pinned so it cannot drift silently: the printed
  # CYP1A2 equation puts 72.5 % of neonatal COMP 1 clearance through CYP1A2
  # where the paper reports 47 %. See Errata.
  abs(fm_tab$`COMP 1 CYP1A2 model`[1] - 72.5) < 0.5,
  comp1_day1_err > 20,
  # The paper's qualitative claim for COMP 2 still holds: CYP3A4 carries a
  # smaller share of clearance in the neonate than in the adult.
  fm_tab$`COMP 2 CYP3A4 model`[1] < fm_tab$`COMP 2 CYP3A4 model`[3]
)
c(comp2_max_abs_error_pct = round(comp2_err, 2),
  comp1_day1_abs_error_pct = round(comp1_day1_err, 2))
#>        comp2_max_abs_error_pct comp1_day1_abs_error_pct.Day 1
#>                            2.4                           25.5
COMP 3 was designed so that CYP2D6 and CYP3A4 each account for ~50% of adult clearance rather than of neonatal clearance. The paper reports its fm by CYP3A4 across six age bands in Figure 4 (left panel) and states that the fold AUC increase on ketoconazole “ranged from 1.02 in 1 day old neonates up to 1.72-fold in adults … reflect[ing] the faster ontogeny of CYP2D6 compared to CYP3A4.”
ages_comp3 <- c(`1 day` = 1 / 365.25, `7 days` = 7 / 365.25,
                `1 month` = 1 / 12, `1 year` = 1, `2 years` = 2,
                `20 years` = 20)
comp3 <- fm_by_age(c("cyp3a4", "cyp2d6"), c(0.5, 0.5), ages_comp3)

comp3_tab <- tibble::tibble(
  `Age band`      = names(ages_comp3),
  `fm CYP3A4 (%)` = round(comp3[1, ], 1),
  `fm CYP2D6 (%)` = round(comp3[2, ], 1)
)
stopifnot(
  # Monotone rise in the CYP3A4 share with age, ending at the design value.
  all(diff(comp3_tab$`fm CYP3A4 (%)`) > 0),
  abs(comp3_tab$`fm CYP3A4 (%)`[6] - 50) < 0.5,
  # The neonate carries far less CYP3A4 flux than the adult, which is the
  # mechanism behind the 1.02 vs 1.72-fold ketoconazole DDI of Figure 4.
  comp3_tab$`fm CYP3A4 (%)`[1] < 25
)
knitr::kable(comp3_tab,
caption = "COMP 3 fraction metabolised by age (replicates Figure 4, left panel).")| Age band | fm CYP3A4 (%) | fm CYP2D6 (%) |
|---|---|---|
| 1 day | 19.1 | 80.9 |
| 7 days | 24.9 | 75.1 |
| 1 month | 27.2 | 72.8 |
| 1 year | 40.4 | 59.6 |
| 2 years | 44.0 | 56.0 |
| 20 years | 50.0 | 50.0 |
Pathway disparities quoted in the text
The paper quotes two specific maximum pathway disparities. Both come from Supplementary Table S4, which is caption-only in the supplementary file – the table body was never deposited – so only the two values repeated in the main text are available. Neither is reproduced by the printed equations, and both are reported rather than asserted.
fine <- exp(seq(log(1 / 365.25), log(20), length.out = 20000))
ont_v <- function(p) {
  hill_fn(fine, th[[paste0(p, "_max")]], th[[paste0(p, "_birth")]],
          th[[paste0(p, "_t50")]], th[[paste0(p, "_hill")]])
}

r_2c9_1a2 <- ont_v("cyp2c9") / ont_v("cyp1a2")
r_2c19_2b6 <- ont_v("cyp2c19") / ont_v("cyp2b6")
i2 <- which.max(r_2c19_2b6)

disp <- tibble::tibble(
  Disparity = c("CYP2C9 vs CYP1A2, at day 1",
                "CYP2C18/19 vs CYP2B6, maximum"),
  Model     = c(round(r_2c9_1a2[1], 2), round(r_2c19_2b6[i2], 2)),
  `Model age` = c("day 1", sprintf("%.1f months", fine[i2] * 12)),
  Published = c(20.9, 2.4),
  `Published age` = c("day 1", "month 5")
)

stopifnot(
  # Pinned characterisations of two KNOWN non-reproductions (see Errata).
  abs(r_2c9_1a2[1] - 5.0) < 0.1,
  abs(r_2c19_2b6[i2] - 2.93) < 0.05,
  # The CYP2C18/19 vs CYP2B6 maximum sits at birth under the printed
  # equations; the paper places it at 5 months.
  fine[i2] < 0.02
)
knitr::kable(disp,
caption = "Pathway disparities quoted in the Salem 2013 text vs the printed Supplementary Table S1 equations.")| Disparity | Model | Model age | Published | Published age |
|---|---|---|---|---|
| CYP2C9 vs CYP1A2, at day 1 | 5.00 | day 1 | 20.9 | day 1 |
| CYP2C18/19 vs CYP2B6, maximum | 2.93 | 0.0 months | 2.4 | month 5 |
Renal function
The renal row of Supplementary Table S1 is not a function of age but a quadratic in body surface area normalised to an adult glomerular filtration rate of 120 mL/min. The paper supplies no age-to-BSA growth function, so the renal output is plotted against its own predictor.
bsa_grid <- seq(0.2, 2.0, by = 0.02)
ev_bsa <- data.frame(id = seq_along(bsa_grid), time = 1, BSA = bsa_grid)
renal <- rxode2::rxSolve(ui, ev_bsa, returnType = "data.frame")
renal <- renal[order(renal$BSA), ]

renal_at <- function(b) {
  (th[["renal_bsa2"]] * b^2 + th[["renal_bsa1"]] * b + th[["renal_int"]]) /
    th[["renal_adult"]]
}
stopifnot(
  all(diff(renal$ont_renal) > 0),                    # monotone in BSA
  max(abs(renal$ont_renal - renal_at(renal$BSA))) < 1e-10,
  abs(renal_at(0.22) - 0.0335) < 0.001,
  abs(renal_at(2.00) - 1.4825) < 0.001,
  # The polynomial crosses the adult value (1.0) between 1.40 and 1.44 m^2.
  renal_at(1.40) < 1, renal_at(1.44) > 1
)

ggplot(renal, aes(BSA, ont_renal)) +
  geom_line(linewidth = 0.9) +
  geom_hline(yintercept = 1, linetype = 2) +
  labs(x = expression("Body surface area (" * m^2 * ")"),
       y = "Renal function (fraction of adult GFR)") +
  theme_bw()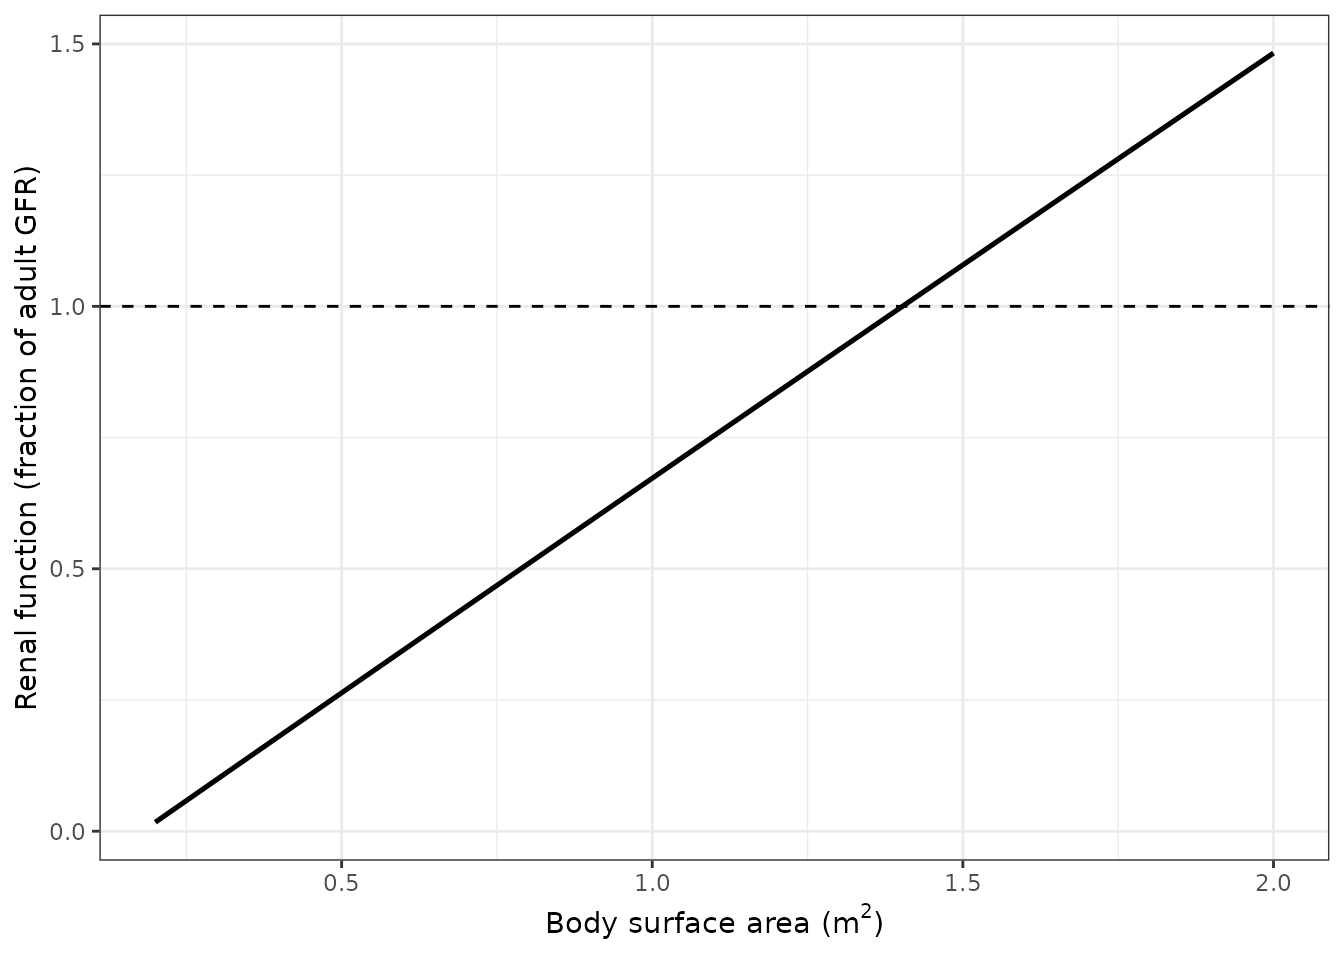
Renal function relative to an adult GFR of 120 mL/min, as a function of body surface area (Supplementary Table S1, renal row).
All pathways together
ggplot(long, aes(time, fraction, colour = pathway)) +
  geom_line(linewidth = 0.8) +
  scale_x_log10(breaks = c(0.01, 0.1, 1, 10)) +
  coord_cartesian(ylim = c(0, 1.05)) +
  labs(x = "Age (years)", y = "Fraction of adult value", colour = NULL) +
  theme_bw()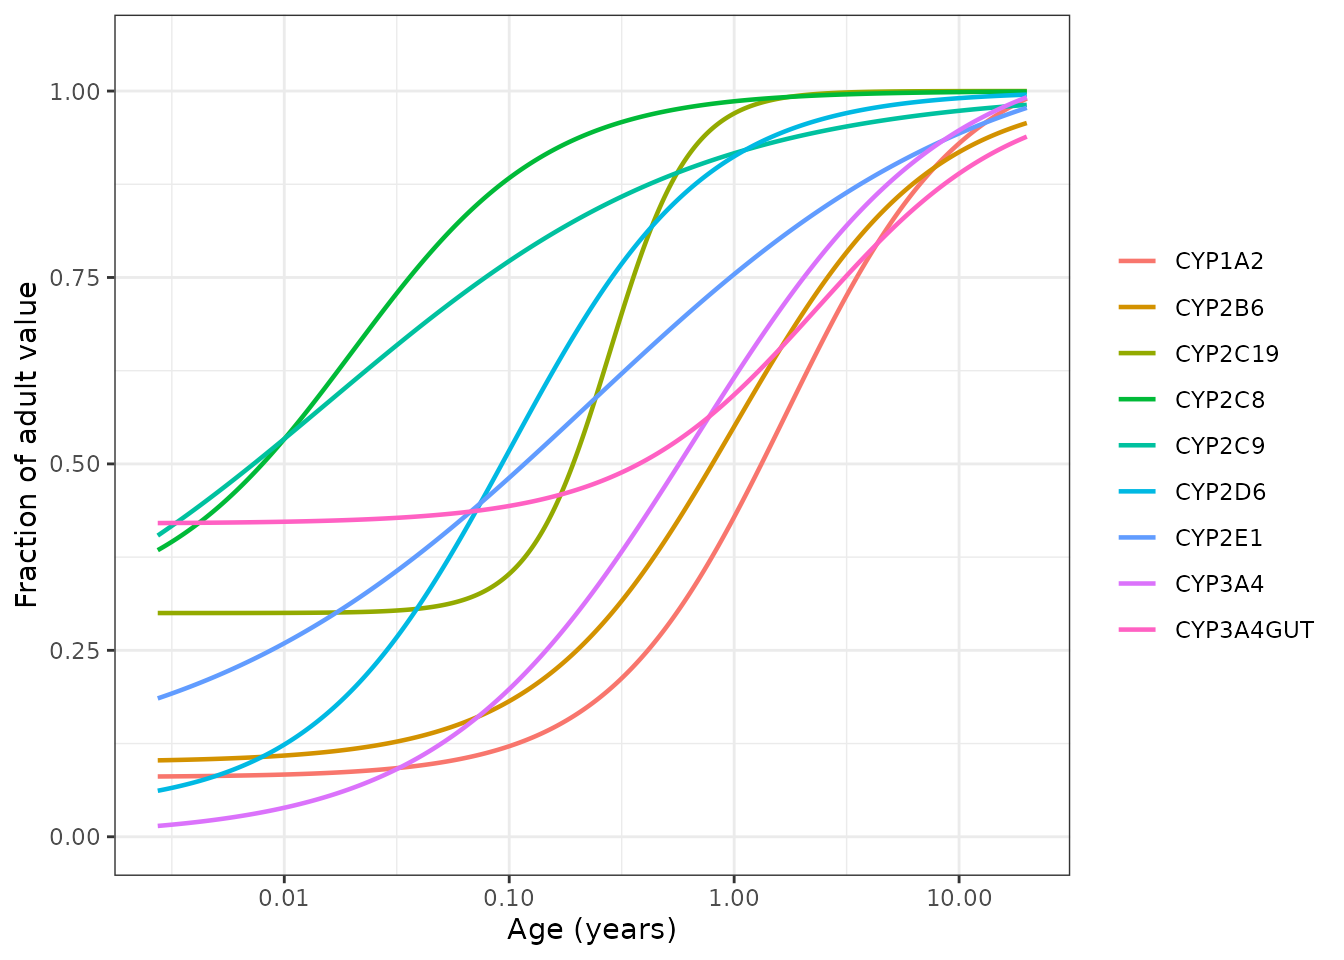
All nine cytochrome P450 ontogeny functions of Supplementary Table S1 over the published 0 to 20 year range.
Assumptions, deviations and errata
The supplementary equations were recovered from binary
embedded objects. Supplementary Table S1’s “Hyperbolic
function” column is ten Microsoft Equation 3.0 OLE objects inside the
supplementary .doc. Plain-text extraction yields
EMBED Equation.3 placeholders and no constants; the objects
were decoded from the file’s ObjectPool storage and are
quoted verbatim in the model file. All ten packaged pathways use the
decoded equation exactly as printed. Where a printed equation conflicts
with a descriptive table column, a figure annotation, or a statement in
the running text, the equation is used and the conflict
is recorded below. No parameter was fitted, digitised, or
back-solved.
CYP1A2: the printed equation is internally inconsistent with
four other statements, and is nevertheless what the package
ships. Supplementary Table S1 prints
CYP1A2 = (1.05 - 0.08) * Age^1.1 / (1.69^1.1 + Age^1.1) + 0.08.
Four other statements in the same paper point to a much lower neonatal
CYP1A2 level than the 0.08 that equation implies:
- The same Table S1 row’s birth column reads “Negligible”, not 0.08.
- Figure 1 annotates “CYP1A2 Birth level= 0”.
- The Discussion gives a 20.9-fold CYP2C9:CYP1A2 disparity at day 1; the printed equations give 5.0-fold. Matching 20.9 would require a day-1 CYP1A2 level near 0.019.
- Table 1’s COMP 1 day-1 band puts 47% of clearance through CYP1A2; the printed equation gives 72.5% (see the fm section above). The companion COMP 2 compound, which uses CYP3A4 and CYP2D6, reproduces all three of its bands to within 2.5 percentage points under the same calculation – so the discrepancy is specific to CYP1A2, not to the method.
The printed equation is kept regardless, for three reasons. First, no
alternative CYP1A2 parameter set is printed anywhere in the paper or its
supplement, so any replacement would be three unpublished numbers
substituted for three published ones. Second, a curve fitted to the
Figure 1 trace requires AdultMax near 1.57, which
contradicts the paper’s own definition of that parameter (“1 at younger
adults but with relevant corrections if the reference group were older”)
and sits far outside the 1.05 to 1.074 range of every other
AdultMax in Table S1. Third, tuning parameters so that a
validation target is met is precisely the failure mode this package’s
conventions forbid. A user who needs the Figure-1-consistent behaviour
should set cyp1a2_birth to 0 knowingly rather than have the
package make that choice silently.
CYP2B6: the exponent is genuinely missing from the
source. The decoded CYP2B6 equation object contains three
superscript template boxes – on the numerator Age, on the
denominator base, and on the denominator Age – and
all three are empty. The equation therefore typesets,
and a reader of the published supplement sees,
CYP2B6 = (1 - 0.1) * Age / (1 + Age) + 0.1, which is n = 1.
That is what the package ships. The distinction from the rows that
genuinely have no exponent is visible in the OLE structure: CYP2B6
carries four templates (one fraction plus three empty superscripts), the
same count as CYP1A2, CYP2C18/19, CYP2E1 and hepatic CYP3A4/5, all of
which have filled exponents, whereas CYP2C8, CYP2D6 and gut CYP3A4/5
carry only one. The row’s summary columns (birth 0.15, half-adult age
1.2 y) are not reachable from the printed constants under any
exponent: with Fbirth = 0.1 and Agemid = 1 the
function reaches 0.5 at Age = 0.8^(1/n), which is below 1
year for every positive n and so can never equal 1.2 years. Attempting
to recover the missing exponent from the Results text’s “2.4-fold CYP2B6
vs CYP2C18/19 at month 5” also fails: n = 0.603 produces a 2.4-fold
maximum but places it at day 1, while the exponents that put the maximum
near month 5 (roughly 1.5 to 3) produce maxima of 3.0 to 5.5-fold. No
single exponent satisfies both halves of the published statement, so
none was adopted.
The Supplementary Table S1 summary columns are annotation, not parameters. Reading “time to half adult expression” as the age at which the function reaches 0.5, the printed equations give 0.008 (column 0.008) for CYP2C8, 0.19 (0.2) for CYP2C18/19, 0.57 (0.6) for hepatic CYP3A4/5, 0.09 (0.08) for CYP2D6, 0.12 (0.1) for CYP2E1, 0.38 (0.3) for gut CYP3A4/5, 0.007 (0.005) for CYP2C9, 1.32 (1.8) for CYP1A2 and 0.80 (1.2) for CYP2B6. Every row disagrees, by up to 40%. The birth columns disagree too, for CYP1A2 (“Negligible” vs 0.08), CYP2B6 (0.15 vs 0.1) and renal (0.15 at birth, which the BSA polynomial reaches only at 0.36 m^2, well past the neonatal range). Because the disagreement is systematic across the whole table rather than confined to one or two rows, the columns are treated as rounded descriptive annotation and are never used to override an equation.
Supplementary Table S4 was never deposited. The main
text cites Supplementary Table S4 for the maximum fold difference
between every pathway pair and the age at which it occurs. In the
supplementary .doc that table is a caption followed by
empty paragraphs; none of its values appears in the
WordDocument, 1Table or Data
streams. Supplementary Figures S1 and S2 are likewise caption-only. The
only two disparity values available anywhere are the ones repeated in
the main text (20.9-fold CYP2C9:CYP1A2 at day 1, in the Discussion, and
2.4-fold CYP2B6:CYP2C18/19 at month 5, in the Results), and neither is
reproduced by the printed equations – see the disparities section above,
where both are reported with the model’s value alongside.
Renal function is validated only against its own equation. The renal polynomial is encoded exactly as printed. No age-to-BSA growth function is supplied by the paper, so the renal output cannot be placed on the same age axis as the nine CYP pathways, and the paper’s renal-versus-CYP comparisons cannot be reproduced. Note also that the polynomial is negative below about 0.18 m^2 and reaches the adult value near 1.42 m^2; keep BSA inside the paediatric-to-adult range 0.2 to 2.0 m^2.
The fm identity is exact only for intrinsic
clearances. The fm_i(age) expression used above
assumes that all non-pathway-specific scaling cancels between numerator
and denominator. That is exact for intrinsic clearances but only
approximate under a well-stirred liver model with age-varying blood flow
and fraction unbound, which is what Simcyp applies. The COMP 2 agreement
to within 2.5 percentage points across a 20-year age span indicates the
approximation is good in practice.
No variability is encoded. The paper bootstraps the residual variance S0^2 about each regression (Equations 3 and 4, 10,000 iterations) to build the confidence intervals in Figures 2 and 3, but does not report the per-pathway S0. Inventing one would fabricate the paper’s central uncertainty claim, so the packaged model is the deterministic median trajectory only. The age ranges over which the paper reports a statistically significant pathway disparity (for example CYP1A2 vs CYP3A4 between 1.4 and 11.6 years, CYP2D6 vs CYP3A4 between 0.4 and 7.2 years, and CYP2C9 vs CYP1A2 between birth and 10.5 years) therefore cannot be reproduced from this model.
The Simcyp DDI simulations are out of scope. Table 1’s median AUC ratios, Figure 4’s fold AUC increases and the abstract’s 1.65 / 2.4 / 3.2-fold ketoconazole example come from Simcyp Paediatric v12 whole-body p-PBPK simulations with proprietary system parameters (liver size, liver blood flow, enzyme abundance, fraction unbound) and time-varying inhibitor exposure. Those are not reproducible outside the platform and are not modelled here. What is reproduced is the ontogeny layer that drives them, plus the fm-versus-age consequence via Equation (2).
Sex is documented but not implemented. Supplementary
Table S1 gives separate renal birth levels for males (0.15) and females
(0.14), but the printed renal equation has no sex term and no CYP row
carries one. SEXF is recorded in
covariatesDataExcluded.