SERT inhibition and tremor incidence MBMA (Panday 2025)
Source:vignettes/articles/Panday_2025_sert_tremor_mbma.Rmd
Panday_2025_sert_tremor_mbma.RmdModel and source
- Citation: Panday SK, Lang BJ, Kapitanov GI, Subramanian K, Klopp-Schulze L, Venkatakrishnan K, Zutshi A, Alnaif AE. A Translational Model-Based Meta-Analysis to Predict Tremor Incidence Associated with Serotonin Reuptake Transporter Inhibition. Clin Pharmacol Ther. 2025;118(3):588-592. doi:10.1002/cpt.3696.
- Description (Cavg fit): MBMA. Translational Emax model-based meta-analysis relating the incidence proportion of tremor (a characteristic manifestation of serotonin syndrome) to predicted brain serotonin-reuptake-transporter (SERT) target coverage, pooled across 20 SERT inhibitors from five drug classes (SSRI, SNRI, SMS, TCA, opioid). Consumes drug-level literature inputs supplied as data columns (steady-state AVERAGE total plasma concentration, plasma fraction unbound, molecular weight, unbound brain-to-unbound-plasma partition coefficient and free-corrected SERT IC50) and returns a per-arm tremor incidence in percent. Suitable for simulating study-arm-level summary outcomes only; there is no PK time course, no dosing event and no individual-level prediction. This file carries the Cavg-based fit; see Panday_2025_sert_tremor_cmax_mbma for the Cmax-based fit.
- Article: https://doi.org/10.1002/cpt.3696
The serotonin reuptake transporter (SERT) clears serotonin from the synapse. Excess extrasynaptic serotonin arising from SERT inhibition produces the adverse-event spectrum called serotonin syndrome, of which tremor is the most frequently reported manifestation. Panday 2025 asked whether the incidence of tremor across marketed SERT inhibitors could be predicted from a single mechanistic quantity: how much of the brain SERT population a drug covers at its clinical dose.
The analysis has three parts (Panday 2025 Figure 1a):
- Literature survey - collate, per drug and per dose, the reported tremor incidence, the steady-state plasma exposure, the plasma and brain unbound fractions and brain partitioning, and the in vitro SERT potency.
- SERT coverage calculation - convert the reported total plasma concentration into an unbound brain concentration, then divide by the free-corrected in vitro potency to obtain a unitless target coverage.
- Emax meta-regression - relate the observed per-arm tremor incidence to that coverage with a three-parameter Emax function, weighted by study-group size.
Parts 2 and 3 are what this extraction encodes. Part 1 is data curation, and its outputs are the covariate columns the model consumes.
The two model files
The paper reports twelve fits of a single structural model - the
cross of two exposure metrics (Cavg, Cmax), two potency metrics (SERT
IC50, SERT KD) and three data selections (all drugs;
excluding drugs with active metabolites; subset to SSRIs and SNRIs). The
structure is identical across all twelve; only the
ini() values and the meaning of the supplied exposure
covariate change.
Two model files are shipped, split along the one axis that changes the input contract - which exposure metric the user must supply:
mod_cavg <- readModelDb("Panday_2025_sert_tremor_cavg_mbma")
mod_cmax <- readModelDb("Panday_2025_sert_tremor_cmax_mbma")

rxode2::rxode(mod_cavg)
#>  ── rxode2-based Pred model ─────────────────────────────────────────────────────
#>  ── Initalization: ──
#> Fixed Effects ($theta):
#> lemax lec50   le0
#> 1.940 0.195 0.293
#>  ── Model (Normalized Syntax): ──
#> function() {
#>     covariateData <- list(CAV = list(description = "Study-arm-level steady-state AVERAGE total (bound + unbound) plasma concentration of the SERT inhibitor at the dose for which tremor incidence was reported.",
#>         units = "ng/mL", type = "continuous", reference_category = NULL,
#>         notes = "Total, not unbound: Eq. S1 applies FU internally. Collated per drug and dose from the primary literature and FDA labels (Panday 2025 Table S2, parameter rows 'plasma steady state total Cavg' / 'plasma steady state Cavg'). For drugs with a SERT-active metabolite (amitriptyline/nortriptyline, fluoxetine/norfluoxetine, venlafaxine/O-desmethylvenlafaxine) the paper computed target coverage separately for parent and metabolite and SUMMED the two coverages (Supplemental Methods, 'Estimating SERT target coverage for drugs with active metabolites'); that summation is NOT performed inside this model -- evaluate the model once per moiety and add the resulting coverages, or use the parameter set fitted excluding drugs with active metabolites (the default here), which is the paper's preferred relationship.",
#>         source_name = "C_pl,ss (Panday 2025 Supplemental Methods Eq. S1); 'Cavg,ub,ss' after the unbound/brain corrections"),
#>         FU = list(description = "Fraction of the SERT inhibitor unbound in human plasma.",
#>             units = "(unitless fraction)", type = "continuous",
#>             reference_category = NULL, notes = "Unitless fraction (e.g. 0.02 for sertraline, 0.7 for desvenlafaxine), NOT percent. Derived from analysis of human plasma samples (Panday 2025 Supplemental Methods, 'Model development for estimating the in vivo brain exposure'); values collated in Table S2 parameter rows 'plasma fu'. Enters Eq. S1 multiplicatively.",
#>             source_name = "f_u,pl (Panday 2025 Supplemental Methods Eq. S1)"),
#>         MW = list(description = "Molecular weight of the SERT inhibitor, used to convert the reported mass-per-volume plasma concentration to a molar concentration so that it is commensurate with the nanomolar in vitro potency.",
#>             units = "g/mol", type = "continuous", reference_category = NULL,
#>             notes = "Enters Eq. S1 as the factor 1000/MW, which converts ng/mL to nM. Values in Panday 2025 Table S2 parameter rows 'MW' (e.g. 298.4 for vortioxetine, 306.2 for sertraline, 263.37 for desvenlafaxine).",
#>             source_name = "MW (Panday 2025 Supplemental Methods Eq. S1)"),
#>         KPUU_BRAIN = list(description = "Unbound-brain to unbound-plasma partition coefficient (Kp,uu) of the SERT inhibitor.",
#>             units = "(unitless ratio)", type = "continuous",
#>             reference_category = NULL, notes = "Typically derived from rat or mouse studies (Panday 2025 Supplemental Methods). The paper preferred the 'Kp,uu * f_u,pl' route (Eq. S2b, encoded here) over the 'Kp * f_u,br' route (Eq. S2a) because it considered plasma fraction-unbound measurements more reliable than brain fraction-unbound measurements. When only a total brain-to-plasma ratio Kp and a brain fraction unbound f_u,br are available, the two routes are algebraically identical for KPUU_BRAIN = Kp * f_u,br / f_u,pl, so supply that product. Brain fraction-unbound values measured in brain homogenate were first pH-partition corrected per Friden et al. (Eqs. S3-S6) before that conversion; the corrected values are tabulated in Panday 2025 Table S2 parameter rows 'brain fu corrected'.",
#>             source_name = "K_p,uu (Panday 2025 Supplemental Methods Eq. S2b)"),
#>         IC50_SERT = list(description = "In vitro SERT inhibitory potency of the drug, corrected to the free (unbound) drug concentration in the assay.",
#>             units = "nM", type = "continuous", reference_category = NULL,
#>             notes = "Where an assay was reported to contain serum, the measured IC50 was corrected to a free-drug basis via Eq. S7 before use; where no serum was reported the measured potency was taken to be the free potency. Where several literature values existed for one drug the GEOMETRIC MEAN was used (Panday 2025 Supplemental Methods). Values in Panday 2025 Table S2 parameter rows 'SERT IC50' / 'SERT IC50 derived'. Substituting a free-corrected SERT K_D here instead of an IC50 is a supported variant of the paper's analysis, but it requires the K_D-based parameter set from Table S4 rather than the IC50-based default shipped in ini() -- see the vignette.",
#>             source_name = "IC50_SERT (Panday 2025 Supplemental Methods Eqs. S7 and S8)"))
#>     description <- "MBMA. Translational Emax model-based meta-analysis relating the incidence proportion of tremor (a characteristic manifestation of serotonin syndrome) to predicted brain serotonin-reuptake-transporter (SERT) target coverage, pooled across 20 SERT inhibitors from five drug classes (SSRI, SNRI, SMS, TCA, opioid). Consumes drug-level literature inputs supplied as data columns (steady-state AVERAGE total plasma concentration, plasma fraction unbound, molecular weight, unbound brain-to-unbound-plasma partition coefficient and free-corrected SERT IC50) and returns a per-arm tremor incidence in percent. Suitable for simulating study-arm-level summary outcomes only; there is no PK time course, no dosing event and no individual-level prediction. This file carries the Cavg-based fit; see Panday_2025_sert_tremor_cmax_mbma for the Cmax-based fit."
#>     population <- list(species = "human", n_subjects = 29677L,
#>         n_studies = 33L, age_range = "Adults; per-study demographics are not re-tabulated by the meta-analysis (each arm's source study is cited by PubMed ID or FDA label URL in Panday 2025 Table S2).",
#>         weight_range = "Not a model covariate; one source study normalised tapentadol IR exposure to a 77 kg body weight (Panday 2025 Table S2).",
#>         sex_female_pct = NA_real_, disease_state = "Mixed: major depressive disorder, generalised anxiety disorder, fibromyalgia, obsessive-compulsive disorder, chronic pain and opioid dependence -- whichever indication the source study of each arm enrolled. The modelled endpoint is the treatment-emergent incidence proportion of tremor, used as a representative manifestation of serotonin syndrome.",
#>         dose_range = "33 drug/dose arms across 20 SERT inhibitors (Panday 2025 Table S1): amitriptyline+nortriptyline 75 and 111 mg QD; citalopram 40 mg QD; desvenlafaxine 50, 100, 200 and 400 mg QD; duloxetine 60 and 90 mg QD; escitalopram 10 mg QD; fluoxetine+norfluoxetine 20, 25 and 40 mg QD; fluvoxamine 100 mg BID and 100 mg QD; imipramine 110 mg BID; methadone 100 mg QD; milnacipran 50 mg BID and 100 and 200 mg QD; nortriptyline 100 mg QD; paroxetine (and CR) 12.5, 22, 22.9, 25 and 30 mg QD; sertraline 50, 100, 144 and 200 mg QD; tapentadol (ER, IR) 75 mg Q6H and 175 mg BID; tramadol ER 200 mg QD; venlafaxine+O-desmethylvenlafaxine 50 and 75 mg BID and 75, 225 and 375 mg QD; venlafaxine XR 85, 150 and 225 mg QD; vilazodone 40 mg QD; vortioxetine 5 and 10 mg QD.",
#>         regions = "Not reported; the arms are drawn from the published literature and from US FDA product labels.",
#>         drug_classes = "Five SERT-inhibitor classes represented: selective serotonin reuptake inhibitors (SSRI), serotonin and norepinephrine reuptake inhibitors (SNRI), serotonin modulator and stimulator (SMS), tricyclic antidepressants (TCA) and opioids (Panday 2025 Figure 1b and Table S1).",
#>         notes = "Summary-level MBMA: the modelled observations are per-arm tremor incidence proportions weighted by study-group size, NOT individual-patient data. n_subjects (29,677) and n_studies (33) are the sum and the count of the treatment-arm group sizes tabulated in Panday 2025 Table S2 ('tremor percent - treatment' rows); the paper itself does not print a pooled total. Placebo-arm group sizes total 20,381 records but double-count shared placebo groups across dose levels of the same trial, so they are not added here. Clinical tremor incidences and plasma fractions unbound are human; the brain distribution parameters (Kp, Kp,uu, brain fraction unbound) are predominantly rat or mouse, and the SERT potencies are in vitro -- this cross-species integration is the 'translational' element of the analysis.")
#>     reference <- "Panday SK, Lang BJ, Kapitanov GI, Subramanian K, Klopp-Schulze L, Venkatakrishnan K, Zutshi A, Alnaif AE. A Translational Model-Based Meta-Analysis to Predict Tremor Incidence Associated with Serotonin Reuptake Transporter Inhibition. Clin Pharmacol Ther. 2025;118(3):588-592. doi:10.1002/cpt.3696."
#>     units <- list(time = "h", dosing = "percent", concentration = "percent/percent")
#>     vignette <- "Panday_2025_sert_tremor_mbma"
#>     ini({
#>         lemax <- 1.94
#>         label("Log maximum attributable tremor incidence, log(Emax) (Emax in percentage points)")
#>         lec50 <- 0.195
#>         label("Log SERT target coverage producing half-maximal tremor incidence, log(EC50) (EC50 unitless)")
#>         le0 <- fix(0.293)
#>         label("Log baseline (placebo) tremor incidence, log(B0) (B0 in percent)")
#>     })
#>     model({
#>         emax <- exp(lemax)
#>         ec50 <- exp(lec50)
#>         b0 <- exp(le0)
#>         cplssub <- CAV * FU * 1000/MW
#>         cbrssub <- cplssub * KPUU_BRAIN
#>         sertcov <- cbrssub/IC50_SERT
#>         tremor <- emax * sertcov/(ec50 + sertcov) + b0
#>     })
#> }
Each file ships the paper’s most-confident data selection for its
metric (“excluding drugs with active metabolites”) with an IC50-based
potency. The other ten parameter sets are tabulated below and are
applied with ini(); the potency-metric axis needs no
separate file because substituting a KD for an IC50 changes
only the value supplied in IC50_SERT and the accompanying
parameter set.
Population
pop <- rxode2::rxode(readModelDb("Panday_2025_sert_tremor_cavg_mbma"))$population
tibble::tibble(
  Field = names(pop),
  Value = vapply(pop, function(x) paste(as.character(x), collapse = "; "), character(1))
) |>
knitr::kable()| Field | Value |
|---|---|
| species | human |
| n_subjects | 29677 |
| n_studies | 33 |
| age_range | Adults; per-study demographics are not re-tabulated by the meta-analysis (each arm’s source study is cited by PubMed ID or FDA label URL in Panday 2025 Table S2). |
| weight_range | Not a model covariate; one source study normalised tapentadol IR exposure to a 77 kg body weight (Panday 2025 Table S2). |
| sex_female_pct | NA |
| disease_state | Mixed: major depressive disorder, generalised anxiety disorder, fibromyalgia, obsessive-compulsive disorder, chronic pain and opioid dependence – whichever indication the source study of each arm enrolled. The modelled endpoint is the treatment-emergent incidence proportion of tremor, used as a representative manifestation of serotonin syndrome. |
| dose_range | 33 drug/dose arms across 20 SERT inhibitors (Panday 2025 Table S1): amitriptyline+nortriptyline 75 and 111 mg QD; citalopram 40 mg QD; desvenlafaxine 50, 100, 200 and 400 mg QD; duloxetine 60 and 90 mg QD; escitalopram 10 mg QD; fluoxetine+norfluoxetine 20, 25 and 40 mg QD; fluvoxamine 100 mg BID and 100 mg QD; imipramine 110 mg BID; methadone 100 mg QD; milnacipran 50 mg BID and 100 and 200 mg QD; nortriptyline 100 mg QD; paroxetine (and CR) 12.5, 22, 22.9, 25 and 30 mg QD; sertraline 50, 100, 144 and 200 mg QD; tapentadol (ER, IR) 75 mg Q6H and 175 mg BID; tramadol ER 200 mg QD; venlafaxine+O-desmethylvenlafaxine 50 and 75 mg BID and 75, 225 and 375 mg QD; venlafaxine XR 85, 150 and 225 mg QD; vilazodone 40 mg QD; vortioxetine 5 and 10 mg QD. |
| regions | Not reported; the arms are drawn from the published literature and from US FDA product labels. |
| drug_classes | Five SERT-inhibitor classes represented: selective serotonin reuptake inhibitors (SSRI), serotonin and norepinephrine reuptake inhibitors (SNRI), serotonin modulator and stimulator (SMS), tricyclic antidepressants (TCA) and opioids (Panday 2025 Figure 1b and Table S1). |
| notes | Summary-level MBMA: the modelled observations are per-arm tremor incidence proportions weighted by study-group size, NOT individual-patient data. n_subjects (29,677) and n_studies (33) are the sum and the count of the treatment-arm group sizes tabulated in Panday 2025 Table S2 (‘tremor percent - treatment’ rows); the paper itself does not print a pooled total. Placebo-arm group sizes total 20,381 records but double-count shared placebo groups across dose levels of the same trial, so they are not added here. Clinical tremor incidences and plasma fractions unbound are human; the brain distribution parameters (Kp, Kp,uu, brain fraction unbound) are predominantly rat or mouse, and the SERT potencies are in vitro – this cross-species integration is the ‘translational’ element of the analysis. |
The clinical layer is human: 33 treatment arms totalling 29,677 participants across 20 SERT inhibitors from five drug classes (Panday 2025 Table S1 and Figure 1b). The distribution layer is not - brain partitioning parameters come predominantly from rat and mouse studies, and the potencies are in vitro. That cross-species integration is what makes the analysis translational, and it is the main source of uncertainty in the predicted coverage.
Scope of this extraction
Included:
- Equation S1 - unbound steady-state plasma concentration, with the ng/mL to nM conversion.
- Equation S2b - unbound steady-state brain concentration via Kp,uu.
- Equation S8 (main-text Eq. 1) - SERT target coverage.
- Equation S9 (main-text Eq. 2) - the Emax relationship for tremor incidence.
Not included in model(), and why:
-
Equation S2a
(
C_br,ss,ub = C_pl,ss * f_u,br * K_p * 1000/MW). The paper states a preference for the S2b route because it “consideredf_u,plmeasurements to be more reliable thanf_u,brmeasurements”. S2a is algebraically the same quantity: supplyKPUU_BRAIN = K_p * f_u,br / f_u,pland the two routes agree exactly. This identity is checked numerically below. -
Equations S3-S6 (Friden pH-partition correction of
brain-homogenate
f_u,br). The equations are printed in the supplement but the compartment volumes (V_ISF,V_cyto,V_lyso) and compartmental pH values they require are not - they live in the cited Friden et al. reference, which was not available when this model was built. The outputs of the correction are tabulated (Table S2, parameter rowsbrain fu corrected), so the correction is an input-curation step whose results the model consumes rather than a step the model performs. No constant has been substituted from outside the available sources. - Equation S7 (free-potency correction for serum-containing assays). See Errata - the tabulated corrected potencies could not be reproduced from the equation as printed, so the model consumes the already-corrected values.
-
The active-metabolite coverage summation. For
amitriptyline/nortriptyline, fluoxetine/norfluoxetine and
venlafaxine/O-desmethylvenlafaxine the paper computed coverage
separately per moiety and added the two. Evaluate the model once per
moiety and add the resulting
sertcovvalues to reproduce that; the default parameter set is the fit that excludes those drugs. -
Residual error. Main-text Eq. 2 carries an additive
noise term
eta, but no variance for it is reported in any available source. Per the standing policy against inventing variances, the model is typical-value only. There is also no between-study random effect in this MBMA - the study-group sizes enter as regression weights, not as a variance component.
Source trace
Every equation and every ini() value, with its location
in the source.
tibble::tribble(
  ~Element,                    ~Source,
  "cplssub = CAV * FU * 1000 / MW",
    "Supplemental Methods Eq. S1",
  "cbrssub = cplssub * KPUU_BRAIN",
    "Supplemental Methods Eq. S2b",
  "sertcov = cbrssub / IC50_SERT",
    "Supplemental Methods Eq. S8; main text Eq. 1",
  "tremor = emax * sertcov / (ec50 + sertcov) + b0",
    "Supplemental Methods Eq. S9; main text Eq. 2",
  "emax = exp(lemax), ec50 = exp(lec50), b0 = exp(le0)",
    "Supplemental Methods, final paragraph: 'parameter = exp(theta_parameter)'",
  "lemax = 1.94 (Cavg model)",
    "Table S2, Cavg,ub,ss / SERT IC50, excluding drugs with active metabolites, weighted estimate (SE 0.229)",
  "lec50 = 0.195 (Cavg model)",
    "Table S2, same row block (SE 0.803)",
  "lemax = 1.84 (Cmax model)",
    "Table S2, Cmax,ub,ss / SERT IC50, excluding drugs with active metabolites, weighted estimate (SE 0.257)",
  "lec50 = 0.300 (Cmax model)",
    "Table S2, same row block (SE 1.27)",
  "le0 = fixed(0.293), both models",
    "Table S2 (theta_B0 = 0.293 in all twelve fits); Results and Supplemental Methods state B0 was SET to the group-size-weighted mean placebo tremor incidence of 1.34%, and exp(0.293) = 1.340",
  "CAV / CMAX covariate values",
    "Table S2, 'plasma steady state total Cavg' / '...Cmax' parameter rows",
  "FU covariate values",
    "Table S2, 'plasma fu' parameter rows",
  "MW covariate values",
    "Table S2, 'MW' parameter rows",
  "KPUU_BRAIN covariate values",
    "Table S2, 'unbound brain to plasma ratio' / 'Kpuu' rows, or 'total brain to plasma ratio' x 'brain fu corrected' / 'plasma fu'",
  "IC50_SERT covariate values",
    "Table S2, 'SERT IC50' / 'SERT IC50 derived' parameter rows (geometric mean where several were found)"
) |>
knitr::kable()| Element | Source |
|---|---|
| cplssub = CAV * FU * 1000 / MW | Supplemental Methods Eq. S1 |
| cbrssub = cplssub * KPUU_BRAIN | Supplemental Methods Eq. S2b |
| sertcov = cbrssub / IC50_SERT | Supplemental Methods Eq. S8; main text Eq. 1 |
| tremor = emax * sertcov / (ec50 + sertcov) + b0 | Supplemental Methods Eq. S9; main text Eq. 2 |
| emax = exp(lemax), ec50 = exp(lec50), b0 = exp(le0) | Supplemental Methods, final paragraph: ‘parameter = exp(theta_parameter)’ |
| lemax = 1.94 (Cavg model) | Table S2, Cavg,ub,ss / SERT IC50, excluding drugs with active metabolites, weighted estimate (SE 0.229) |
| lec50 = 0.195 (Cavg model) | Table S2, same row block (SE 0.803) |
| lemax = 1.84 (Cmax model) | Table S2, Cmax,ub,ss / SERT IC50, excluding drugs with active metabolites, weighted estimate (SE 0.257) |
| lec50 = 0.300 (Cmax model) | Table S2, same row block (SE 1.27) |
| le0 = fixed(0.293), both models | Table S2 (theta_B0 = 0.293 in all twelve fits); Results and Supplemental Methods state B0 was SET to the group-size-weighted mean placebo tremor incidence of 1.34%, and exp(0.293) = 1.340 |
| CAV / CMAX covariate values | Table S2, ‘plasma steady state total Cavg’ / ‘…Cmax’ parameter rows |
| FU covariate values | Table S2, ‘plasma fu’ parameter rows |
| MW covariate values | Table S2, ‘MW’ parameter rows |
| KPUU_BRAIN covariate values | Table S2, ‘unbound brain to plasma ratio’ / ‘Kpuu’ rows, or ‘total brain to plasma ratio’ x ‘brain fu corrected’ / ‘plasma fu’ |
| IC50_SERT covariate values | Table S2, ‘SERT IC50’ / ‘SERT IC50 derived’ parameter rows (geometric mean where several were found) |
The twelve reported fits
All twelve log-scale parameter sets from Tables S2 and S4. The two
rows marked * are the defaults shipped in the two model
files.
# Values are carried as STRINGS so that the number of printed decimals -- and
# therefore the rounding interval each published estimate stands for -- survives
# into the tolerance calculation in Gate 1 below.
fits <- tibble::tribble(
  ~exposure, ~potency, ~selection,                 ~lemax_s, ~se_lemax_s, ~lec50_s, ~se_lec50_s, ~le0_s, ~se_le0_s,
  "Cavg", "IC50", "All drugs",                 "2.01", "0.253", "0.0949", "0.926", "0.293", "0.796",
  "Cavg", "IC50", "Excl. active metabolites*", "1.94", "0.229", "0.195",  "0.803", "0.293", "0.620",
  "Cavg", "IC50", "SSRIs and SNRIs",           "1.91", "0.248", "-0.397", "0.974", "0.293", "0.867",
  "Cmax", "IC50", "All drugs",                 "2.00", "0.229", "0.584",  "0.942", "0.293", "1.03",
  "Cmax", "IC50", "Excl. active metabolites*", "1.84", "0.257", "0.300",  "1.27",  "0.293", "1.20",
  "Cmax", "IC50", "SSRIs and SNRIs",           "1.92", "0.311", "0.218",  "1.18",  "0.293", "1.70",
  "Cavg", "KD",   "All drugs",                 "1.85", "0.212", "1.42",   "1.08",  "0.293", "0.944",
  "Cavg", "KD",   "Excl. active metabolites",  "1.77", "0.201", "1.42",   "1.01",  "0.293", "0.764",
  "Cavg", "KD",   "SSRIs and SNRIs",           "1.87", "0.214", "1.42",   "1.06",  "0.293", "0.858",
  "Cmax", "KD",   "All drugs",                 "1.71", "0.691", "1.42",   "2.34",  "0.293", "3.35",
  "Cmax", "KD",   "Excl. active metabolites",  "1.66", "0.739", "1.42",   "2.71",  "0.293", "3.54",
  "Cmax", "KD",   "SSRIs and SNRIs",           "1.74", "1.1",   "1.42",   "3.32",  "0.293", "5.44"
) |>
  dplyr::mutate(
    lemax = as.numeric(lemax_s), se_lemax = as.numeric(se_lemax_s),
    lec50 = as.numeric(lec50_s), se_lec50 = as.numeric(se_lec50_s),
    le0   = as.numeric(le0_s),   se_le0   = as.numeric(se_le0_s)
  )

fits |>
  dplyr::transmute(
    Exposure = exposure, Potency = potency, `Data selection` = selection,
    `theta_Emax (SE)` = paste0(lemax_s, " (", se_lemax_s, ")"),
    `theta_EC50 (SE)` = paste0(lec50_s, " (", se_lec50_s, ")"),
    `theta_B0 (SE)`   = paste0(le0_s,   " (", se_le0_s,   ")")
  ) |>
knitr::kable(caption = "Panday 2025 Tables S2 (IC50-based) and S4 (K_D-based).")| Exposure | Potency | Data selection | theta_Emax (SE) | theta_EC50 (SE) | theta_B0 (SE) |
|---|---|---|---|---|---|
| Cavg | IC50 | All drugs | 2.01 (0.253) | 0.0949 (0.926) | 0.293 (0.796) |
| Cavg | IC50 | Excl. active metabolites* | 1.94 (0.229) | 0.195 (0.803) | 0.293 (0.620) |
| Cavg | IC50 | SSRIs and SNRIs | 1.91 (0.248) | -0.397 (0.974) | 0.293 (0.867) |
| Cmax | IC50 | All drugs | 2.00 (0.229) | 0.584 (0.942) | 0.293 (1.03) |
| Cmax | IC50 | Excl. active metabolites* | 1.84 (0.257) | 0.300 (1.27) | 0.293 (1.20) |
| Cmax | IC50 | SSRIs and SNRIs | 1.92 (0.311) | 0.218 (1.18) | 0.293 (1.70) |
| Cavg | KD | All drugs | 1.85 (0.212) | 1.42 (1.08) | 0.293 (0.944) |
| Cavg | KD | Excl. active metabolites | 1.77 (0.201) | 1.42 (1.01) | 0.293 (0.764) |
| Cavg | KD | SSRIs and SNRIs | 1.87 (0.214) | 1.42 (1.06) | 0.293 (0.858) |
| Cmax | KD | All drugs | 1.71 (0.691) | 1.42 (2.34) | 0.293 (3.35) |
| Cmax | KD | Excl. active metabolites | 1.66 (0.739) | 1.42 (2.71) | 0.293 (3.54) |
| Cmax | KD | SSRIs and SNRIs | 1.74 (1.1) | 1.42 (3.32) | 0.293 (5.44) |
Gate 1 - reproduce Tables S3 and S5 from the log-scale estimates
Tables S3 and S5 report the physical (back-transformed)
Emax, EC50 and B0 for every fit, computed from the log-scale estimates
as mean = exp(mu + sigma^2/2),
sd = sqrt((exp(sigma^2) - 1) * exp(2*mu + sigma^2)) and
median = exp(mu). Reproducing all 36 published values from
the 36 log-scale inputs is an enumerating check over the entire reported
parameter space: a transposed column, a variance-versus-SD mix-up or a
missing back-transform would break it immediately. This check is
deterministic - no seed, no cohort, no simulation - so an exact
tolerance is appropriate.
ln_mean   <- function(mu, s) exp(mu + s^2 / 2)
ln_sd     <- function(mu, s) sqrt((exp(s^2) - 1) * exp(2 * mu + s^2))
ln_median <- function(mu, s) exp(mu)

# Half-width of the rounding interval a printed value stands for. With a decimal
# point, precision is the number of decimals ("1.20" is 1.20 +/- 0.005, "1.1" is
# 1.1 +/- 0.05). Without one, Tables S3/S5 print three significant figures
# ("36700" is 36700 +/- 50).
printed_half <- function(txt) {
  has_dot <- grepl(".", txt, fixed = TRUE)
  dec <- ifelse(has_dot, nchar(sub("^[^.]*\\.", "", txt)), 0L)
  v <- as.numeric(txt)
  ifelse(has_dot, 0.5 * 10^(-dec),
         ifelse(v == 0, 0, 0.5 * 10^(floor(log10(abs(v))) - 2)))
}

long <- dplyr::bind_rows(
  dplyr::transmute(fits, exposure, potency, selection, parameter = "Emax",
                   mu_s = lemax_s, se_s = se_lemax_s),
  dplyr::transmute(fits, exposure, potency, selection, parameter = "EC50",
                   mu_s = lec50_s, se_s = se_lec50_s),
  dplyr::transmute(fits, exposure, potency, selection, parameter = "B0",
                   mu_s = le0_s,   se_s = se_le0_s)
)

# ln_mean and ln_sd increase in mu and in s (s >= 0); ln_median depends on mu
# alone. The extremes of each statistic over the rounding box of the two inputs
# are therefore attained at the corners of that box.
recomputed <- long |>
  dplyr::mutate(
    mu = as.numeric(mu_s), se = as.numeric(se_s),
    dmu = printed_half(mu_s), dse = printed_half(se_s),
    se_lo = pmax(se - dse, 0), se_hi = se + dse,
    mean = ln_mean(mu, se),
    mean_lo = ln_mean(mu - dmu, se_lo), mean_hi = ln_mean(mu + dmu, se_hi),
    sd = ln_sd(mu, se),
    sd_lo = ln_sd(mu - dmu, se_lo), sd_hi = ln_sd(mu + dmu, se_hi),
    median = ln_median(mu, se),
    median_lo = exp(mu - dmu), median_hi = exp(mu + dmu)
  )

# Published values, Panday 2025 Tables S3 (IC50) and S5 (K_D), carried as
# strings so each one's own printed precision is preserved.
published <- tibble::tribble(
  ~exposure, ~potency, ~selection,                 ~parameter, ~mean_s,  ~sd_s,   ~median_s,
  "Cavg", "IC50", "All drugs",                 "Emax", "7.73",   "1.98",  "7.48",
  "Cavg", "IC50", "All drugs",                 "EC50", "1.69",   "1.97",  "1.10",
  "Cavg", "IC50", "All drugs",                 "B0",   "1.84",   "1.73",  "1.34",
  "Cavg", "IC50", "Excl. active metabolites*", "Emax", "7.15",   "1.66",  "6.96",
  "Cavg", "IC50", "Excl. active metabolites*", "EC50", "1.68",   "1.60",  "1.22",
  "Cavg", "IC50", "Excl. active metabolites*", "B0",   "1.62",   "1.11",  "1.34",
  "Cavg", "IC50", "SSRIs and SNRIs",           "Emax", "6.97",   "1.75",  "6.76",
  "Cavg", "IC50", "SSRIs and SNRIs",           "EC50", "1.08",   "1.36",  "0.67",
  "Cavg", "IC50", "SSRIs and SNRIs",           "B0",   "1.95",   "2.07",  "1.34",
  "Cmax", "IC50", "All drugs",                 "Emax", "7.62",   "1.77",  "7.42",
  "Cmax", "IC50", "All drugs",                 "EC50", "2.79",   "3.34",  "1.79",
  "Cmax", "IC50", "All drugs",                 "B0",   "2.29",   "3.16",  "1.34",
  "Cmax", "IC50", "Excl. active metabolites*", "Emax", "6.52",   "1.70",  "6.31",
  "Cmax", "IC50", "Excl. active metabolites*", "EC50", "3.04",   "6.12",  "1.35",
  "Cmax", "IC50", "Excl. active metabolites*", "B0",   "2.75",   "4.93",  "1.34",
  "Cmax", "IC50", "SSRIs and SNRIs",           "Emax", "7.18",   "2.29",  "6.84",
  "Cmax", "IC50", "SSRIs and SNRIs",           "EC50", "2.50",   "4.34",  "1.24",
  "Cmax", "IC50", "SSRIs and SNRIs",           "B0",   "5.73",   "23.8",  "1.34",
  "Cavg", "KD",   "All drugs",                 "Emax", "6.52",   "1.4",   "6.38",
  "Cavg", "KD",   "All drugs",                 "EC50", "7.41",   "11.0",  "4.15",
  "Cavg", "KD",   "All drugs",                 "B0",   "2.09",   "2.51",  "1.34",
  "Cavg", "KD",   "Excl. active metabolites",  "Emax", "6.01",   "1.22",  "5.89",
  "Cavg", "KD",   "Excl. active metabolites",  "EC50", "6.94",   "9.29",  "4.15",
  "Cavg", "KD",   "Excl. active metabolites",  "B0",   "1.79",   "1.60",  "1.34",
  "Cavg", "KD",   "SSRIs and SNRIs",           "Emax", "6.66",   "1.44",  "6.51",
  "Cavg", "KD",   "SSRIs and SNRIs",           "EC50", "7.27",   "10.45", "4.15",
  "Cavg", "KD",   "SSRIs and SNRIs",           "B0",   "1.94",   "2.02",  "1.34",
  "Cmax", "KD",   "All drugs",                 "Emax", "7.00",   "5.48",  "5.51",
  "Cmax", "KD",   "All drugs",                 "EC50", "64.6",   "1000",  "4.15",
  "Cmax", "KD",   "All drugs",                 "B0",   "372",    "10000", "1.34",
  "Cmax", "KD",   "Excl. active metabolites",  "Emax", "6.91",   "5.88",  "5.26",
  "Cmax", "KD",   "Excl. active metabolites",  "EC50", "165",    "6530",  "4.15",
  "Cmax", "KD",   "Excl. active metabolites",  "B0",   "702",    "36700", "1.34",
  "Cmax", "KD",   "SSRIs and SNRIs",           "Emax", "10.4",   "15.9",  "5.7",
  "Cmax", "KD",   "SSRIs and SNRIs",           "EC50", "1010",   "24800", "4.15",
  # Table S5 prints this SD as "10E+12"; read as 1e13 it agrees with the formula.
  "Cmax", "KD",   "SSRIs and SNRIs",           "B0",   "365000", "1e13",  "1.34"
)

chk <- dplyr::inner_join(recomputed, published,
                         by = c("exposure", "potency", "selection", "parameter"))
stopifnot(nrow(chk) == 36L)

# A value is consistent when the interval implied by rounding of the two
# log-scale inputs overlaps the interval implied by rounding of the published
# value. No fudge factor: a wrong formula, a variance/SD mix-up or a missing
# back-transform breaks this immediately.
consistent <- function(lo, hi, pub_s) {
  pub <- as.numeric(pub_s); h <- printed_half(pub_s)
  pub + h >= lo & pub - h <= hi
}

chk <- chk |>
  dplyr::mutate(
    ok_mean   = consistent(mean_lo,   mean_hi,   mean_s),
    ok_sd     = consistent(sd_lo,     sd_hi,     sd_s),
    ok_median = consistent(median_lo, median_hi, median_s)
  )

# Four published cells are NOT consistent, all in the Cmax / K_D block of
# Table S5 and all low by a factor of about ten (see Errata). Asserting the
# discrepant set EXACTLY -- rather than loosening the tolerance or dropping the
# cells -- keeps the check honest in both directions: a new disagreement fails,
# and so does a disagreement that silently goes away.
discrepant <- chk |>
  dplyr::filter(!ok_mean | !ok_sd | !ok_median) |>
  dplyr::transmute(cell = paste(exposure, potency, selection, parameter,
                                ifelse(!ok_mean, "mean", "sd"))) |>
  dplyr::pull(cell) |>
  sort()

expected_discrepant <- sort(c(
  "Cmax KD All drugs B0 sd",
  "Cmax KD Excl. active metabolites B0 sd",
  "Cmax KD SSRIs and SNRIs EC50 sd",
  "Cmax KD SSRIs and SNRIs B0 mean"
))
stopifnot(identical(discrepant, expected_discrepant))

n_ok <- sum(chk$ok_mean) + sum(chk$ok_sd) + sum(chk$ok_median)
sprintf(paste("Gate 1: %d of %d published values across Tables S3 and S5 are",
              "consistent with the Table S2 / S4 log-scale estimates;",
              "the %d exceptions are enumerated above and in Errata."),
        n_ok, 3L * nrow(chk), 3L * nrow(chk) - n_ok)
#> [1] "Gate 1: 104 of 108 published values across Tables S3 and S5 are consistent with the Table S2 / S4 log-scale estimates; the 4 exceptions are enumerated above and in Errata."

chk |>
  dplyr::filter(potency == "IC50") |>
  dplyr::transmute(
    Exposure = exposure, `Data selection` = selection, Parameter = parameter,
    `Mean (calc)` = signif(mean, 3),   `Mean (pub)` = mean_s,
    `SD (calc)`   = signif(sd, 3),     `SD (pub)`   = sd_s,
    `Median (calc)` = signif(median, 3), `Median (pub)` = median_s
  ) |>
knitr::kable(caption = "Gate 1: Table S3 reproduced from the Table S2 log-scale estimates. All 54 IC50-based values pass; the K_D half (Tables S4/S5) is checked in the same chunk and carries the four documented exceptions.")| Exposure | Data selection | Parameter | Mean (calc) | Mean (pub) | SD (calc) | SD (pub) | Median (calc) | Median (pub) |
|---|---|---|---|---|---|---|---|---|
| Cavg | All drugs | Emax | 7.71 | 7.73 | 1.98 | 1.98 | 7.460 | 7.48 |
| Cavg | Excl. active metabolites* | Emax | 7.14 | 7.15 | 1.66 | 1.66 | 6.960 | 6.96 |
| Cavg | SSRIs and SNRIs | Emax | 6.96 | 6.97 | 1.75 | 1.75 | 6.750 | 6.76 |
| Cmax | All drugs | Emax | 7.59 | 7.62 | 1.76 | 1.77 | 7.390 | 7.42 |
| Cmax | Excl. active metabolites* | Emax | 6.51 | 6.52 | 1.70 | 1.70 | 6.300 | 6.31 |
| Cmax | SSRIs and SNRIs | Emax | 7.16 | 7.18 | 2.28 | 2.29 | 6.820 | 6.84 |
| Cavg | All drugs | EC50 | 1.69 | 1.69 | 1.97 | 1.97 | 1.100 | 1.10 |
| Cavg | Excl. active metabolites* | EC50 | 1.68 | 1.68 | 1.60 | 1.60 | 1.220 | 1.22 |
| Cavg | SSRIs and SNRIs | EC50 | 1.08 | 1.08 | 1.36 | 1.36 | 0.672 | 0.67 |
| Cmax | All drugs | EC50 | 2.79 | 2.79 | 3.34 | 3.34 | 1.790 | 1.79 |
| Cmax | Excl. active metabolites* | EC50 | 3.02 | 3.04 | 6.06 | 6.12 | 1.350 | 1.35 |
| Cmax | SSRIs and SNRIs | EC50 | 2.49 | 2.50 | 4.34 | 4.34 | 1.240 | 1.24 |
| Cavg | All drugs | B0 | 1.84 | 1.84 | 1.73 | 1.73 | 1.340 | 1.34 |
| Cavg | Excl. active metabolites* | B0 | 1.62 | 1.62 | 1.11 | 1.11 | 1.340 | 1.34 |
| Cavg | SSRIs and SNRIs | B0 | 1.95 | 1.95 | 2.07 | 2.07 | 1.340 | 1.34 |
| Cmax | All drugs | B0 | 2.28 | 2.29 | 3.13 | 3.16 | 1.340 | 1.34 |
| Cmax | Excl. active metabolites* | B0 | 2.75 | 2.75 | 4.94 | 4.93 | 1.340 | 1.34 |
| Cmax | SSRIs and SNRIs | B0 | 5.69 | 5.73 | 23.40 | 23.8 | 1.340 | 1.34 |
All 54 values of Table S3 - its 18 rows times mean, standard deviation and median, covering every IC50-based fit and so every fit either shipped model uses - reproduce. The four exceptions all sit in Table S5’s Cmax / KD block, which the paper itself identifies as its least well determined analysis, and none of them touches a parameter used by the extracted models.
Gate 2 - B0 is the weighted placebo incidence
The paper states in two places that B0 was set to the
group-size-weighted mean placebo tremor incidence of 1.34%, not
estimated. exp(theta_B0) must therefore return exactly that
number, and it must be identical across all twelve fits.
b0_all <- exp(fits$le0)
stopifnot(
  length(unique(fits$le0)) == 1L,
  abs(round(b0_all[1], 2) - 1.34) < 1e-12,
  abs(b0_all[1] - 1.34) < 5e-4
)
sprintf("exp(theta_B0) = exp(%.3f) = %.4f%% (published weighted placebo mean: 1.34%%)",
        fits$le0[1], b0_all[1])
#> [1] "exp(theta_B0) = exp(0.293) = 1.3404% (published weighted placebo mean: 1.34%)"
Gate 3 - the two imputation correlations
Two power-law correlations were fitted to the curated dataset and used to fill gaps. Each has one published worked answer, which pins the coefficient, the exponent and the direction of the fit simultaneously.
-
f_u,brainvsf_u,plasma(Figure S2):y = 0.1495 * x^1.2589. Applied to desvenlafaxine’s reportedf_u,plasmaof 0.7 it must return the 0.0954 recorded in Table S2 (row 848), which the main text rounds to 0.10. - SERT KD vs SERT IC50 (Figure S4):
y = 0.1625 * x^0.9462. Applied to the free-corrected tapentadol/tramadol SERT IC50 of 3219.5 nM it must return the 338.78 nM recorded in Table S2 (row 964).
impute_fu_brain <- function(fu_plasma) 0.1495 * fu_plasma^1.2589   # Panday 2025 Figure S2
impute_sert_kd  <- function(ic50_nm)   0.1625 * ic50_nm^0.9462     # Panday 2025 Figure S4

fu_br_desven <- impute_fu_brain(0.7)
kd_tapentadol <- impute_sert_kd(3219.5)

stopifnot(
  abs(fu_br_desven  - 0.0954) < 5e-5,   # Table S2 row 848, 3 significant figures
  abs(round(fu_br_desven, 2) - 0.10) < 1e-12,  # main text Results
  abs(kd_tapentadol - 338.78) < 5e-3    # Table S2 row 964, 5 significant figures
)

tibble::tibble(
  Quantity = c("desvenlafaxine f_u,brain from f_u,plasma = 0.7",
               "tapentadol/tramadol SERT K_D from IC50 = 3219.5 nM"),
  Reproduced = c(signif(fu_br_desven, 4), signif(kd_tapentadol, 6)),
  Published  = c(0.0954, 338.78),
  Source     = c("Figure S2; Table S2 row 848", "Figure S4; Table S2 row 964")
) |>
knitr::kable()| Quantity | Reproduced | Published | Source |
|---|---|---|---|
| desvenlafaxine f_u,brain from f_u,plasma = 0.7 | 0.09542 | 0.0954 | Figure S2; Table S2 row 848 |
| tapentadol/tramadol SERT K_D from IC50 = 3219.5 nM | 338.78400 | 338.7800 | Figure S4; Table S2 row 964 |
Replicating the fitted relationships (Figure 2 and Figures S3, S5, S6)
Figure 2 of the main text plots tremor incidence against Cavg-based
SERT target coverage for three data selections; Figures S3, S5 and S6 do
the same for the Cmax and KD variants. Below the fitted
curves are evaluated through the model itself by sweeping the covariate
inputs so that sertcov takes the intended values.
Because the model computes coverage from its inputs rather than
accepting it directly, the sweep supplies a unit “probe” drug:
FU = 1, MW = 1000,
KPUU_BRAIN = 1, IC50_SERT = 1, so that
sertcov reduces to the supplied concentration. That the
algebra collapses this way is itself worth asserting.
cov_grid <- c(0, 10^seq(-3, 2, length.out = 200))

# Both CAV and CMAX are supplied so the same probe drives either model file;
# each model reads only the exposure column it declares.
probe_events <- function(coverage) {
  data.frame(
    id         = 1L,
    time       = seq_along(coverage) - 1,
    CAV        = coverage,      # ng/mL
    CMAX       = coverage,      # ng/mL
    FU         = 1,
    MW         = 1000,          # so that 1000/MW == 1
    KPUU_BRAIN = 1,
    IC50_SERT  = 1,             # nM
    evid       = 0L
  )
}

sim_probe <- rxode2::rxSolve(
  rxode2::rxode(mod_cavg), events = probe_events(cov_grid),
  keep = c("CAV")
) |>
  as.data.frame()

# The probe really does make sertcov equal the supplied concentration.
stopifnot(max(abs(sim_probe$sertcov - cov_grid)) < 1e-10)
# Dot-prefixed argument names so the ini() non-standard evaluation cannot
# mistake the supplied value for the model parameter of the same name.
# le0 is not overridden: it is fixed(0.293) in every one of the twelve fits.
curve_for <- function(mod, .lemax, .lec50, coverage = cov_grid) {
  m <- rxode2::rxode(mod)
  m <- suppressMessages(rxode2::ini(m, lemax = .lemax, lec50 = .lec50))
  rxode2::rxSolve(m, events = probe_events(coverage)) |>
    as.data.frame() |>
    dplyr::transmute(sertcov, tremor)
}

fits_ic50 <- dplyr::filter(fits, potency == "IC50")

curves <- split(fits_ic50, seq_len(nrow(fits_ic50))) |>
  lapply(function(row) {
    mod <- if (row$exposure == "Cavg") mod_cavg else mod_cmax
    curve_for(mod, row$lemax, row$lec50) |>
      dplyr::mutate(exposure = row$exposure,
                    selection = sub("\\*$", "", row$selection))
  }) |>
  dplyr::bind_rows()

# The coverage grid includes 0 (used by Gate 4 as the y(0) = B0 anchor); drop it
# here only because a log x-axis cannot show it.
ggplot(dplyr::filter(curves, sertcov > 0),
       aes(x = sertcov, y = tremor, colour = selection)) +
  geom_line(linewidth = 0.9) +
  facet_wrap(~ exposure, ncol = 2,
             labeller = labeller(exposure = c(Cavg = "Cavg,ub,ss / SERT IC50 (Figure 2)",
                                              Cmax = "Cmax,ub,ss / SERT IC50 (Figure S3)"))) +
  scale_x_log10(name = "SERT target coverage, C_br,ss,ub / IC50_SERT (unitless)") +
  scale_y_continuous(name = "Tremor incidence (%)", limits = c(0, NA)) +
  labs(colour = "Data selection",
       caption = "Emax curves from Panday 2025 Table S2; baseline B0 = 1.34% fixed in every fit.") +
  theme_bw() +
  theme(legend.position = "bottom")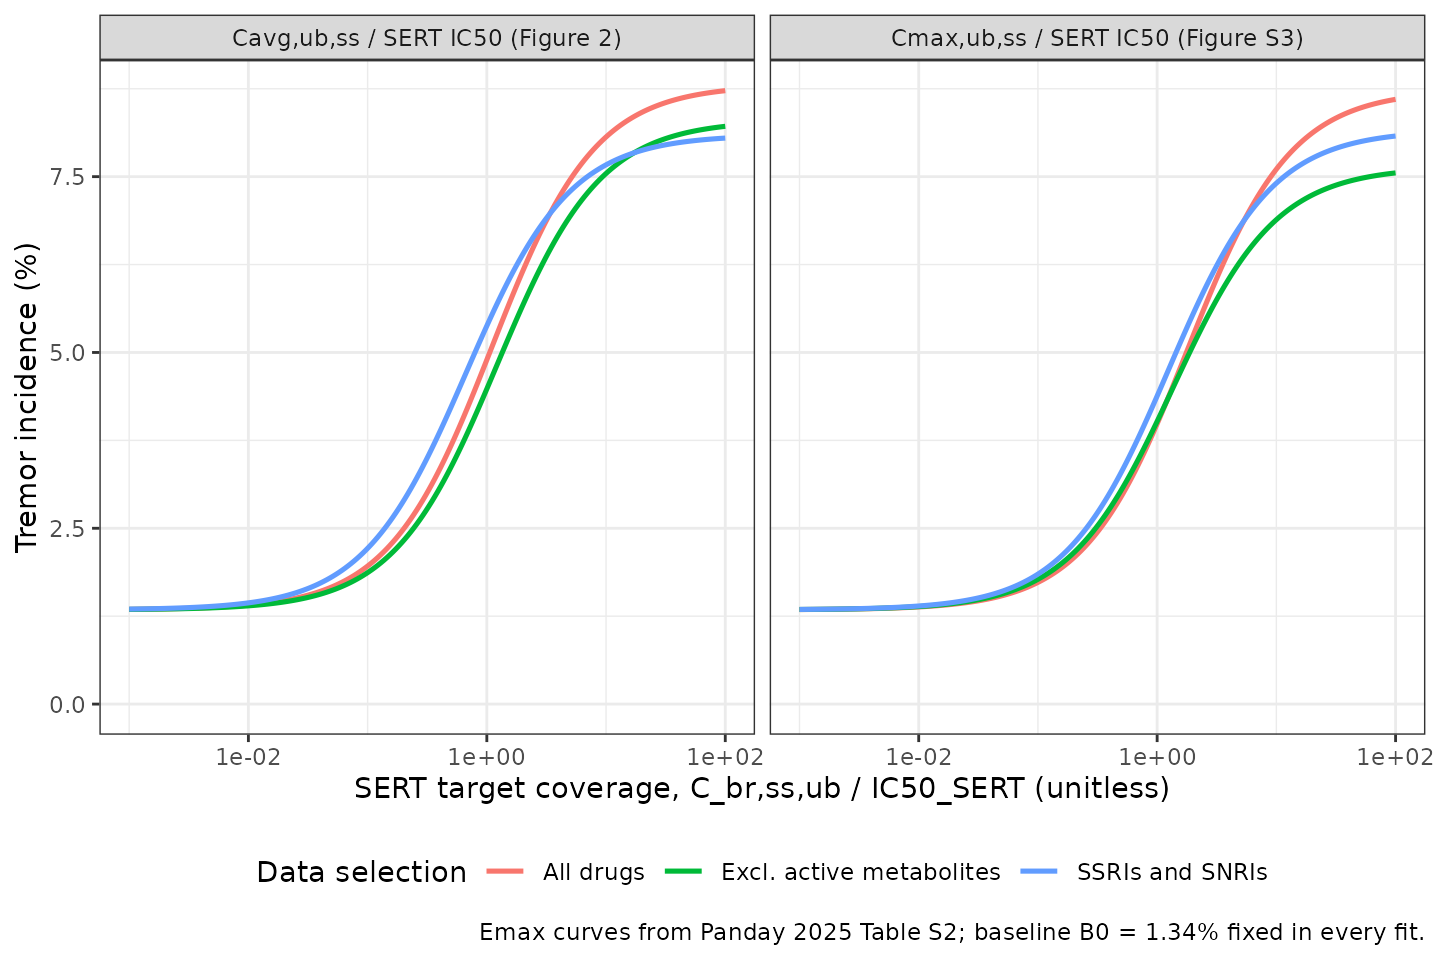
Panday 2025 Figure 2 (Cavg / IC50 panels a-c) and Figure S3 (Cmax / IC50): fitted Emax relationships between SERT target coverage and tremor incidence for each data selection. Curves are evaluated through the extracted model; the paper does not tabulate per-arm target coverage, so the observed study points of the published figures cannot be overlaid (see Assumptions).
Gate 4 - structural anchors of the Emax function
Three points on the curve are known analytically and must hold for every fit.
anchor_check <- split(fits_ic50, seq_len(nrow(fits_ic50))) |>
  lapply(function(row) {
    mod <- if (row$exposure == "Cavg") mod_cavg else mod_cmax
    emax <- exp(row$lemax); ec50 <- exp(row$lec50); b0 <- exp(row$le0)
    got <- curve_for(mod, row$lemax, row$lec50,
                     coverage = c(0, ec50, 1e9))
    tibble::tibble(
      exposure = row$exposure, selection = row$selection,
      zero_calc = got$tremor[1],       zero_exp = b0,
      half_calc = got$tremor[2],       half_exp = emax / 2 + b0,
      asym_calc = got$tremor[3],       asym_exp = emax + b0
    )
  }) |>
  dplyr::bind_rows()

stopifnot(
  max(abs(anchor_check$zero_calc - anchor_check$zero_exp)) < 1e-10,
  max(abs(anchor_check$half_calc - anchor_check$half_exp)) < 1e-10,
  # 1e9 coverage is not literally infinite; allow the residual Emax*ec50/1e9 gap.
  max(abs(anchor_check$asym_calc - anchor_check$asym_exp)) < 1e-6
)

anchor_check |>
  dplyr::transmute(
    Exposure = exposure, `Data selection` = selection,
    `y(0) = B0 (%)`            = signif(zero_calc, 4),
    `y(EC50) = Emax/2+B0 (%)`  = signif(half_calc, 4),
    `y(inf) = Emax+B0 (%)`     = signif(asym_calc, 4)
  ) |>
knitr::kable(caption = "Gate 4: analytical anchors of Eq. S9 recovered from the solved model.")| Exposure | Data selection | y(0) = B0 (%) | y(EC50) = Emax/2+B0 (%) | y(inf) = Emax+B0 (%) |
|---|---|---|---|---|
| Cavg | All drugs | 1.34 | 5.072 | 8.804 |
| Cavg | Excl. active metabolites* | 1.34 | 4.820 | 8.299 |
| Cavg | SSRIs and SNRIs | 1.34 | 4.717 | 8.094 |
| Cmax | All drugs | 1.34 | 5.035 | 8.729 |
| Cmax | Excl. active metabolites* | 1.34 | 4.489 | 7.637 |
| Cmax | SSRIs and SNRIs | 1.34 | 4.751 | 8.161 |
Gate 5 - the solved model equals the closed form
Both sides use the same parameter values, so the difference here is pure floating-point error and a tight bound is the right assertion.
closed_form <- function(coverage, lemax, lec50, le0) {
  exp(lemax) * coverage / (exp(lec50) + coverage) + exp(le0)
}

cf <- closed_form(sim_probe$sertcov, 1.94, 0.195, 0.293)
stopifnot(max(abs(sim_probe$tremor - cf)) < 1e-10)
sprintf("Max |solved - closed form| over %d coverage values: %.3g",
        length(cf), max(abs(sim_probe$tremor - cf)))
#> [1] "Max |solved - closed form| over 201 coverage values: 0"
Gate 6 - the Eq. S2a and Eq. S2b routes agree
The paper allows either brain-exposure route. Supplying
KPUU_BRAIN directly (S2b) and supplying
K_p * f_u,br / f_u,pl in its place (S2a) must give the same
unbound brain concentration and the same predicted incidence.
Vortioxetine is used because Table S2 disambiguates its inputs
explicitly (“Used this value in meta-analysis” against the rat
Kp of 20.1, and a pH-partition-corrected brain fraction
unbound of 0.0007047).
vor <- list(
  cmax_ss     = 18,         # ng/mL, steady-state Cmax at 10 mg QD, Table S2
  fu_plasma   = 0.02,       # human, 98% plasma protein binding, Table S2
  mw          = 298.4,      # g/mol, Table S2
  kp          = 20.1,       # total brain:plasma, rat, "Used this value in meta-analysis"
  fu_brain    = 0.0007047,  # pH-partition corrected, Table S2 row 1124
  kpuu_direct = 1.2,        # unbound brain:plasma, wildtype mice, Table S2 row 815
  ic50        = 5.4         # nM, Table S2
)

kpuu_from_kp <- vor$kp * vor$fu_brain / vor$fu_plasma

# The exposure on hand is a steady-state Cmax, so the Cmax model file is the
# right one to drive here and in Gate 7.
route_events <- function(kpuu) {
  data.frame(id = 1L, time = 0, CMAX = vor$cmax_ss, FU = vor$fu_plasma,
             MW = vor$mw, KPUU_BRAIN = kpuu, IC50_SERT = vor$ic50, evid = 0L)
}

s2a <- rxode2::rxSolve(rxode2::rxode(mod_cmax), events = route_events(kpuu_from_kp)) |>
  as.data.frame()

# S2a as the paper writes it: C_br,ss,ub = C_pl,ss * f_u,br * K_p * 1000/MW
s2a_direct <- vor$cmax_ss * vor$fu_brain * vor$kp * 1000 / vor$mw
stopifnot(abs(s2a$cbrssub - s2a_direct) < 1e-12)

sprintf(paste("Eq. S2a written out: %.5g nM; via KPUU_BRAIN = Kp*fu_br/fu_pl = %.5g:",
              "%.5g nM (identical). Kp,uu implied by S2a is %.4f vs %.1f measured directly."),
        s2a_direct, kpuu_from_kp, s2a$cbrssub, kpuu_from_kp, vor$kpuu_direct)
#> [1] "Eq. S2a written out: 0.85443 nM; via KPUU_BRAIN = Kp*fu_br/fu_pl = 0.70822: 0.85443 nM (identical). Kp,uu implied by S2a is 0.7082 vs 1.2 measured directly."
The implied Kp,uu of 0.708 from the rat Kp route and the mouse-derived direct measurement of 1.2 differ by roughly a factor of 1.7 for the same drug. This is the cross-species uncertainty the Discussion acknowledges, and it propagates linearly into the coverage estimate.
Gate 7 - end-to-end worked example
The full Eq. S1 - S2b - S8 - S9 chain for vortioxetine 10 mg QD, using the Kp route Table S2 marks as the one used in the meta-analysis.
sim_vor <- rxode2::rxSolve(rxode2::rxode(mod_cmax),
                           events = data.frame(
                             id = 1L, time = 0, CMAX = vor$cmax_ss, FU = vor$fu_plasma,
                             MW = vor$mw, KPUU_BRAIN = kpuu_from_kp,
                             IC50_SERT = vor$ic50, evid = 0L)) |>
  as.data.frame()

steps <- tibble::tibble(
  Step = c("C_max,ss (input, total plasma)", "Eq. S1: C_pl,ss,ub", "Eq. S2b: C_br,ss,ub",
           "Eq. S8: SERT target coverage", "Eq. S9: predicted tremor incidence"),
  Value = c(vor$cmax_ss, sim_vor$cplssub, sim_vor$cbrssub, sim_vor$sertcov, sim_vor$tremor),
  Units = c("ng/mL", "nM", "nM", "unitless", "%")
)
knitr::kable(steps, digits = 4)| Step | Value | Units |
|---|---|---|
| C_max,ss (input, total plasma) | 18.0000 | ng/mL |
| Eq. S1: C_pl,ss,ub | 1.2064 | nM |
| Eq. S2b: C_br,ss,ub | 0.8544 | nM |
| Eq. S8: SERT target coverage | 0.1582 | unitless |
| Eq. S9: predicted tremor incidence | 2.0011 | % |
The observed vortioxetine 10 mg QD arm reported 0% tremor against a 2.9% placebo rate in a 100-participant arm (Table S2 rows 832-833); the 5 mg arm reported 4.6% against the same placebo. With a placebo baseline this noisy at n = 100, a single arm cannot discriminate the fit - which is exactly why the paper weights by group size and pools 33 arms. The prediction is asserted only to lie inside the range the model can produce.
stopifnot(
  sim_vor$tremor > exp(0.293),                          # strictly above baseline B0
  sim_vor$tremor < exp(1.84) + exp(0.293),              # strictly below Emax + B0
  sim_vor$sertcov > 0
)
sprintf("Predicted tremor incidence %.2f%% at a SERT target coverage of %.3f.",
        sim_vor$tremor, sim_vor$sertcov)
#> [1] "Predicted tremor incidence 2.00% at a SERT target coverage of 0.158."
Errata and unreproducible source details
Equation S7 (free-potency correction) is mis-typeset and could not be reproduced. As printed it reads
IC50_SERT = IC50_SERT,m (f_u,pl/(1 - f_u,pl) * r_p + f_u,pl, with an unbalanced parenthesis. Read literally, the multiplier exceeds 1 wheneverf_u,pl > 1/(1 + r_p)- it would make the free potency weaker than the measured one, the wrong direction for a protein-binding correction. Checked against the tabulated corrections in Table S2 it does not reproduce them either: l(R)-methadone goes from a measured 0.17 uM in 10% fetal bovine serum to a corrected 167.74 nM (a factor of 0.987, whereas the equation withf_u,pl = 0.13,r_p = 0.1gives 0.145), and tapentadol’s measured 3.2195 uM and corrected 3219.5 nM are the same number. The model therefore consumes the already-correctedIC50_SERTvalues from Table S2 as data, and no attempt is made to re-derive them.Two Table S2 comment cells transpose their source values. Row 1099 (citalopram,
brain fu corrected= 0.02) says the correction was applied to a literature value of 0.0045, and row 1101 (duloxetine, 0.0015606) says 0.06 - but row 49 records citalopram’s literature brainf_uas 0.06 and row 51 records duloxetine’s as 0.0045. The corrected/uncorrected ratios (3.0 and 2.88) confirm the drug assignment is right and only the two cited literature values are swapped between the comments.B0 encoded as
fixed(). Table S2 prints a standard error besidetheta_B0, which normally signals estimation. Both the Results section and the Supplemental Methods say plainly that the weighted placebo mean of 1.34% “was used as” B0, the same 0.293 appears in all twelve fits, andexp(0.293)is 1.340. The bootstrap column, by contrast, varies (-0.0153 to 0.28), consistent with the weighted placebo mean being recomputed within each bootstrap resample.fixed()reflects the point-estimate model as published.No residual-error variance is recoverable. Main-text Eq. 2 includes an additive noise term with no reported variance. The model is typical-value only.
The Friden pH-partition constants were not available. See Scope above.
-
Four cells of Table S5 are low by a factor of about ten. Gate 1 back-computes all 108 published mean / SD / median values in Tables S3 and S5 from the log-scale estimates in Tables S2 and S4 using the transformation the table captions themselves state, propagating the rounding of each printed input. 104 agree. The four that do not are all in the Cmax / KD block of Table S5:
Fit Cell Formula gives Table S5 prints Ratio Cmax / KD / all drugs B0 SD 1.00e5 10000 10.0 Cmax / KD / excl. active metabolites B0 SD 3.71e5 36700 10.1 Cmax / KD / SSRIs and SNRIs EC50 SD 2.53e5 24800 10.2 Cmax / KD / SSRIs and SNRIs B0 mean 3.58e6 365000 9.8 A consistent factor of ten across four independent cells in one table block, with every other cell in the same table reproducing, points to a dropped digit in typesetting rather than a different formula. All four sit in the analysis the Discussion singles out as least well determined, and none affects either shipped model - both are IC50-based, and every Table S3 value reproduces. Gate 1 asserts this discrepant set exactly, so a future correction to the paper would make the gate fail loudly rather than pass silently.
10E+12in Table S5 resolves cleanly. The B0 standard deviation for the Cmax / KD / SSRI-SNRI fit is printed in this unusual form. Read as 1e13 it agrees with the formula’s 9.54e12 to within the input rounding, so it is a notation quirk rather than an error and is checked like any other cell.
Assumptions and deviations
- Per-arm target coverage is not tabulated by the paper, so the observed study points of Figures 2, S3, S5 and S6 cannot be placed on the reproduced curves. Table S2 supplies the raw ingredients, but several drugs carry multiple literature values for the same input (fluoxetine has Kp,uu values of 1, 2.6, 10 and 21.2; vortioxetine has two steady-state Cmax values at 10 mg QD) and only some rows are annotated “Used this value”. Choosing among them would be guesswork, so the vignette validates against the exact published anchors instead of reconstructing the scatter. Gate 7 works one arm end to end using only rows the sheet disambiguates explicitly.
- Two files rather than one or twelve. The structure is identical across all twelve reported fits, so a twelve-file split would be noise. A single file was rejected because shipping the Cavg parameter set as the default while a user supplies Cmax would be silently wrong, and the covariate name is the only place that distinction can be enforced.
-
Species mixing. Tremor incidences and plasma
unbound fractions are human; brain partitioning is largely rodent;
potencies are in vitro.
population$speciesis recorded as"human"because that is the population the response was observed in, with the cross-species inputs described inpopulation$notes. -
Placebo arms are not summed into
n_subjects. The 20,381 placebo records in Table S2 double-count placebo groups shared across dose levels of the same trial; only the 29,677 treatment-arm participants are totalled. -
No PKNCA validation. This model has no PK time
course, no dosing event and no concentration output - non-compartmental
analysis does not apply. The algebraic and identity gates above replace
it, following the same pattern as
Yoshioka_2018_FXa_inhibitors_mbma.