Hepatic UGT1A1 and UGT1A6 ontogeny (Miyagi 2011)
Source:vignettes/articles/Miyagi_2011_ugt1a1_ugt1a6_hepatic_ontogeny.Rmd
Miyagi_2011_ugt1a1_ugt1a6_hepatic_ontogeny.RmdModel and source
- Citation: Miyagi SJ, Collier AC. The development of UDP-glucuronosyltransferases 1A1 and 1A6 in the pediatric liver. Drug Metab Dispos. 2011;39(5):912-919. doi:10.1124/dmd.110.037192. PMCID: PMC3082376. Equations 1 to 10 are printed in Methods, section ‘Pharmacokinetics, Scaling, and Statistical Analyses’; the fitted activity parameters are in Results, section ‘UGT1A1 and 1A6 Activity’ and in the Fig. 1A and Fig. 2A captions; the modeled clearances are in Table 1.
- Description: Hepatic enzyme ontogeny + IVIVE system model. Postnatal development of UDP-glucuronosyltransferase (UGT) 1A1 and 1A6 catalytic activity in 50 individual pediatric human liver microsome preparations spanning 13 days to 20 years (Miyagi and Collier 2011), together with the in vitro to in vivo extrapolation (IVIVE) cascade the authors used to turn those activities into normalized hepatic clearances. Each isoform’s activity is a one-phase exponential association in postnatal age (Eq. 1), rising from a non-zero activity at birth to an adult plateau: UGT1A1 (bilirubin glucuronidation) matures fast, reaching 90% of plateau by 3.8 months, whereas UGT1A6 (serotonin glucuronidation) starts above half of adult activity and reaches 90% of plateau only at 14 months, which is the paper’s central finding of independent regulation of the two isoforms. Activity is converted to an unbound intrinsic clearance by Michaelis-Menten back-calculation at the assay substrate concentration with literature Km values, scaled to the whole liver through microsomal protein per gram liver and liver weight, and passed through BOTH the well stirred (Eq. 2) and parallel-tube (Eq. 3) hepatic extraction models, then allometrically scaled to the child by weight (Eq. 4) and normalized to body weight. The Simcyp Pediatric physiology functions the paper also used are emitted alongside: liver weight from body surface area (Eq. 5), microsomal protein per gram liver versus age (Eq. 7), plasma albumin versus age (Eq. 8), the pediatric unbound fraction that follows from it (Eq. 9) and body surface area from height and weight (Eq. 10). This is a SYSTEM layer, not a drug model: it has no dosing, no compartments and no ODEs, and every output is an algebraic function of the rxode2 time variable, which the model interprets as postnatal age in MONTHS. Deterministic: the paper reports no between-subject variance component for any quantity, so every parameter is fixed and there is no residual error. IMPORTANT: the paper’s Eq. 6 (Simcyp hepatic blood flow versus age) is NOT encoded, because it is non-physical as printed – see the vignette Errata and the note in model() below – so only the allometric clearance branch is emitted.
- Article: https://doi.org/10.1124/dmd.110.037192 (PMC3082376)
Miyagi and Collier measured bilirubin glucuronidation (UGT1A1) and serotonin glucuronidation (UGT1A6) in microsomes from 50 individual pediatric livers spanning 13 days to 20 years, and fitted each isoform’s activity against postnatal age with a one-phase exponential association. The central finding is that the two isoforms are independently regulated: UGT1A1 starts near zero at birth and matures within about four months, whereas UGT1A6 starts above half of adult activity and takes over a year.
The authors then pushed those activities through a full in vitro to
in vivo extrapolation (IVIVE) cascade – Michaelis-Menten
back-calculation of Vmax, scaling to the whole liver, both
the well stirred and parallel-tube hepatic extraction models, and
allometric scaling to the child – to report normalized hepatic
clearances.
This vignette packages that whole cascade. It is a
system-parameter model: there is no drug, no dose, no
compartment and no ODE. The rxode2 time variable is postnatal age in
months, and every output is an algebraic function of
it. The model is deterministic – the paper reports no variance component
for any quantity that enters as a coefficient, so every parameter is
fixed() and there is no IIV and no residual error.
One published equation is deliberately not encoded. See Assumptions and deviations.
Population
str(readModelDb("Miyagi_2011_ugt1a1_ugt1a6_hepatic_ontogeny")()$population)
#> List of 10
#>  $ species       : chr "human"
#>  $ n_subjects    : int 50
#>  $ n_studies     : int 1
#>  $ age_range     : chr "13 days to 20 years (mean 8.0 years)"
#>  $ weight_range  : chr "Not reported. Miyagi 2011 state that individual donor weights were used where available and that National Cente"| __truncated__
#>  $ sex_female_pct: num 30
#>  $ race_ethnicity: chr "Pediatric donors (n = 50): white 64%, African American 16%, Hispanic 14%, Asian 3%, American Indian 3%. Neither"| __truncated__
#>  $ disease_state : chr "None. Postmortem donors with healthy livers obtained through the United Network for Organ Sharing, free of infe"| __truncated__
#>  $ dose_range    : chr "n/a (no drug in this model)"
#>  $ notes         : chr "15 female and 35 male pediatric donors. The 'adult' reference values come from a separate pooled adult human li"| __truncated__
The 50 pediatric donors were postmortem, healthy-liver donors
obtained through the United Network for Organ Sharing, free of
infectious disease, processed within 8 h postmortem, with causes of
death of anoxia, cerebrovascular aneurysm, head trauma or motor vehicle
accident (Methods, “Pediatric and Adult Liver Samples and
Demographics”). They were 15 female and 35 male, mean age 8.0 years, and
64% white / 16% African American / 14% Hispanic / 3% Asian / 3% American
Indian. Neither activity differed significantly with gender or
ethnicity, so no sex or race term appears in the model; those covariates
are recorded in covariatesDataExcluded to preserve the
screen.
The “adult” reference is a separate pooled preparation (XTreme 200 Pool, XenoTech) of 200 donors, 100 men and 100 women, mean age 50 years (range 17 to 78). That pool is the source of the two measured pooled-adult activities used as the validation anchor below.
Source trace
Equations 1 to 10 are printed in Methods, section “Pharmacokinetics, Scaling, and Statistical Analyses” (p. 914). The fitted activity parameters are in Results, section “UGT1A1 and 1A6 Activity”, and repeated in the Fig. 1A and Fig. 2A captions. The modeled clearances are in Table 1.
Eq. 1 – one-phase exponential association, fitted to activity against postnatal age for each isoform:
Eq. 2 – well stirred hepatic extraction:
Eq. 3 – parallel-tube hepatic extraction:
Eq. 4 – allometric scaling of the adult clearance to the child:
Eq. 5 – Simcyp liver size from body surface area:
Eq. 7 – Simcyp microsomal protein per gram liver, age in years:
Eq. 8 – Simcyp pediatric plasma albumin, age in years:
Eq. 9 – pediatric unbound fraction implied by that albumin:
Eq. 10 – body surface area, height in cm and weight in kg:
Eq. 6 (Simcyp hepatic blood flow versus age) is printed in the same block but is not encoded; see Assumptions and deviations.
Parameter provenance
| Parameter | Value | Source location |
|---|---|---|
| act0_ugt1a1 | 0.0007848 | Results / Fig. 1A caption: 0.7848 pmol/min/mg, converted to nmol/min/mg |
| actmax_ugt1a1 | 0.7690 | Results / Fig. 1A caption: 0.7690 +/- 0.081 nmol/min/mg [95% CI 0.6028-0.9351] |
| kmat_ugt1a1 | 0.605675 | DERIVED from Y0, Ymax and the published t90 of 3.8 months (see Derived quantities) |
| act0_ugt1a6 | 2.560 | Results / Fig. 2A caption: 2.560 nmol/min/mg at birth |
| actmax_ugt1a6 | 4.737 | Results / Fig. 2A caption: 4.737 +/- 0.33 nmol/min/mg (95% CI 4.041-5.434) |
| kmat_ugt1a6 | 0.108938 | DERIVED from Y0, Ymax and the published t90 of 14 months (see Derived quantities) |
| km_bilirubin | 5.0 | Methods: 5.0 uM for bilirubin, UGT1A1 (Ciotti 1998) |
| sub_bilirubin | 125 | Methods: Michaelis-Menten kinetics (125 uM bilirubin/1A1) |
| fu_bilirubin | 0.001 | Methods: plasma unbound fraction for bilirubin (Ostrow 2003) |
| km_serotonin | 5200 | Methods: 5.2 mM for serotonin, UGT1A6 (Krishnaswamy 2003), converted to uM |
| sub_serotonin | 100 | Methods: 100 uM serotonin/1A6 |
| fu_serotonin | 0.17 | Methods: plasma unbound fraction for serotonin (Breyer-Pfaff 1989) |
| mppgl_adult | 45 | Methods: MPPGL unknown, standard 45 mg/g used (Houston 1994) |
| liverwt_adult | 1500 | Methods: assuming a liver size of 1500 g for adults |
| qh_adult | 90 | Methods: a hepatic flow rate of 1.5 l/min for adults, converted to l/h |
| wt_adult | 70 | Methods define Wstd but print no number; 70 kg is the rounded standard, back-solved below |
| allom_exp | 0.75 | Eq. 4 prints the exponent as 3/4; Discussion: three-forths power scaling |
| liverwt_coef | 0.722 | Eq. 5 |
| liverwt_exp | 1.176 | Eq. 5 |
| mppgl_c0 | 1.407 | Eq. 7 |
| mppgl_c1 | 0.0158 | Eq. 7 |
| mppgl_c2 | -0.000382 | Eq. 7 |
| mppgl_c3 | 0.0000024 | Eq. 7 |
| alb_slope | 1.1287 | Eq. 8 |
| alb_intercept | 33.746 | Eq. 8 |
| alb_adult | 44 | Methods: [P]adult is 44 g/l (McNamara and Alcorn 2002) |
| bsa_coef | 0.007184 | Eq. 10 |
| bsa_exp_ht | 0.725 | Eq. 10 |
| bsa_exp_wt | 0.425 | Eq. 10 |
# The trace table must cover every estimated parameter in the model file --
# an enumerating check, so a parameter added later fails until it is traced.
stopifnot(setequal(trace$param, names(ui$theta)))
stopifnot(nrow(trace) == length(ui$theta))
# Deterministic by the paper: no etas, no residual error.
stopifnot(sum(!is.na(ui$iniDf$neta1)) == 0L)
Units and dimensional analysis
Two unit conversions are load-bearing and are the kind of thing that silently produces a plausible-but-wrong clearance, so they are spelled out.
The activity assays report nmol substrate per min per mg
microsomal protein, and substrate concentrations are
micromolar. A micromolar concentration is nmol/ml, so
which then scales to the whole liver as
ml/min/mg x mg/g x g = ml/min, divided by 1000 to reach
l/min. Eqs. 2 and 3 are written with the paper’s adult flow
of 1.5 l/min, so the model holds qh_adult in
l/h and divides by 60 inside the extraction equations, then
multiplies the result back by 60 to report l/h.
| Symbol | Units | Note |
|---|---|---|
| time, age_month | month | postnatal age; the rxode2 time variable IS the age |
| age_year | year | age_month / 12; Eqs. 7 and 8 are written in years |
| act_ugt1a1/1a6 | nmol/min/mg protein | Eq. 1 output; same units as Y0 and Ymax |
| fmat_ugt1a1/1a6 | unitless | activity divided by its own plateau |
| km_, sub_ | umol/l = nmol/ml | must share units for Km + S to be defined |
| vmax_* | nmol/min/mg protein | act * (Km + S) / S; S cancels dimensionally |
| clint_* | ml/min/mg protein | Vmax / Km; see the derivation above |
| mppgl_adult | mg protein/g liver | 45 mg/g |
| liverwt_adult | g liver | 1500 g |
| clint_liver_* | l/min | clint * mppgl * liverwt / 1000 |
| qh_adult | l/h | 90 l/h = 1.5 l/min |
| qh_min | l/min | qh_adult / 60, to match Eqs. 2 and 3 |
| fu_* | unitless | unbound fraction |
| clh_ws, clh_pt | l/min | Eqs. 2 and 3 evaluated in l/min |
| WT | kg | Eq. 4 scalar and the normalization denominator |
| HT | cm | Eq. 10 only |
| allom | unitless | (WT / 70)^0.75 |
| clnorm_* | l/h/kg | clh * allom * 60 / WT |
| bsa | m^2 | Eq. 10 |
| liverwt_simcyp | g liver | Eq. 5, converted from kg (see Errata) |
| mppgl_simcyp | mg protein/g liver | Eq. 7 |
| alb_simcyp | g/l | Eq. 8 |
| fu_*_simcyp | unitless | Eq. 9 |
Parameter round-trip
mod <- readModelDb("Miyagi_2011_ugt1a1_ugt1a6_hepatic_ontogeny")

published <- c(
  act0_ugt1a1 = 0.0007848, actmax_ugt1a1 = 0.7690, kmat_ugt1a1 = 0.605675,
  act0_ugt1a6 = 2.560,     actmax_ugt1a6 = 4.737,  kmat_ugt1a6 = 0.108938,
  km_bilirubin = 5.0, sub_bilirubin = 125, fu_bilirubin = 0.001,
  km_serotonin = 5200, sub_serotonin = 100, fu_serotonin = 0.17,
  mppgl_adult = 45, liverwt_adult = 1500, qh_adult = 90,
  wt_adult = 70, allom_exp = 0.75,
  liverwt_coef = 0.722, liverwt_exp = 1.176,
  mppgl_c0 = 1.407, mppgl_c1 = 0.0158, mppgl_c2 = -0.000382,
  mppgl_c3 = 0.0000024,
  alb_slope = 1.1287, alb_intercept = 33.746, alb_adult = 44,
  bsa_coef = 0.007184, bsa_exp_ht = 0.725, bsa_exp_wt = 0.425
)

fitted <- ui$theta
stopifnot(setequal(names(fitted), names(published)))
stopifnot(isTRUE(all.equal(unname(fitted[names(published)]),
                           unname(published), tolerance = 1e-12)))
# Every parameter is fixed -- nothing in this model is estimated.
stopifnot(all(ui$iniDf$fix[!is.na(ui$iniDf$ntheta)]))

tibble::tibble(
  Parameter = names(published),
  Paper = unname(published),
  `Model file` = unname(fitted[names(published)])
) |>
knitr::kable(caption = "Every ini() value round-trips against the paper.")| Parameter | Paper | Model file |
|---|---|---|
| act0_ugt1a1 | 0.0007848 | 0.0007848 |
| actmax_ugt1a1 | 0.7690000 | 0.7690000 |
| kmat_ugt1a1 | 0.6056750 | 0.6056750 |
| act0_ugt1a6 | 2.5600000 | 2.5600000 |
| actmax_ugt1a6 | 4.7370000 | 4.7370000 |
| kmat_ugt1a6 | 0.1089380 | 0.1089380 |
| km_bilirubin | 5.0000000 | 5.0000000 |
| sub_bilirubin | 125.0000000 | 125.0000000 |
| fu_bilirubin | 0.0010000 | 0.0010000 |
| km_serotonin | 5200.0000000 | 5200.0000000 |
| sub_serotonin | 100.0000000 | 100.0000000 |
| fu_serotonin | 0.1700000 | 0.1700000 |
| mppgl_adult | 45.0000000 | 45.0000000 |
| liverwt_adult | 1500.0000000 | 1500.0000000 |
| qh_adult | 90.0000000 | 90.0000000 |
| wt_adult | 70.0000000 | 70.0000000 |
| allom_exp | 0.7500000 | 0.7500000 |
| liverwt_coef | 0.7220000 | 0.7220000 |
| liverwt_exp | 1.1760000 | 1.1760000 |
| mppgl_c0 | 1.4070000 | 1.4070000 |
| mppgl_c1 | 0.0158000 | 0.0158000 |
| mppgl_c2 | -0.0003820 | -0.0003820 |
| mppgl_c3 | 0.0000024 | 0.0000024 |
| alb_slope | 1.1287000 | 1.1287000 |
| alb_intercept | 33.7460000 | 33.7460000 |
| alb_adult | 44.0000000 | 44.0000000 |
| bsa_coef | 0.0071840 | 0.0071840 |
| bsa_exp_ht | 0.7250000 | 0.7250000 |
| bsa_exp_wt | 0.4250000 | 0.4250000 |
Derived quantities: the two maturation rate constants
The maturation rate constant K of Eq. 1 is not
printed for either isoform. Miyagi 2011 report the Eq. 1 fit
through Y0, Ymax and the “90th percentile”
age, which Methods define as
the youngest age at which activity reached within 90% of the plateau level.
That definition over-determines K. Setting
Y(t_{90}) = 0.9\,Y_{max} in Eq. 1 and solving,
so K follows exactly from three published numbers per
isoform. It is derived, not fitted or guessed, and the model file
annotates it as such.
k_from_t90 <- function(y0, ymax, t90) {
  -log(1 - (0.9 * ymax - y0) / (ymax - y0)) / t90
}

k1 <- k_from_t90(0.0007848, 0.7690, 3.8)   # UGT1A1, t90 = 3.8 months
k6 <- k_from_t90(2.560,     4.737,  14)    # UGT1A6, t90 = 14 months

# The ini() values are these, rounded to 6 decimal places.
stopifnot(isTRUE(all.equal(round(k1, 6), unname(fitted["kmat_ugt1a1"]),
                           tolerance = 1e-12)))
stopifnot(isTRUE(all.equal(round(k6, 6), unname(fitted["kmat_ugt1a6"]),
                           tolerance = 1e-12)))

tibble::tibble(
  Isoform = c("UGT1A1", "UGT1A6"),
  `Y0 (nmol/min/mg)` = c(0.0007848, 2.560),
  `Ymax (nmol/min/mg)` = c(0.7690, 4.737),
  `t90 (months)` = c(3.8, 14),
  `K exact (1/month)` = c(k1, k6),
  `K in ini() (1/month)` = unname(fitted[c("kmat_ugt1a1", "kmat_ugt1a6")])
) |>
  knitr::kable(digits = 7,
caption = "K is back-solved exactly from the published t90.")| Isoform | Y0 (nmol/min/mg) | Ymax (nmol/min/mg) | t90 (months) | K exact (1/month) | K in ini() (1/month) |
|---|---|---|---|---|---|
| UGT1A1 | 0.0007848 | 0.769 | 3.8 | 0.6056747 | 0.605675 |
| UGT1A6 | 2.5600000 | 4.737 | 14.0 | 0.1089378 | 0.108938 |
Simulation
There is no dose and no ODE state, so the event table is a pure observation grid over postnatal age, carrying the two covariates the cascade needs.
The grid starts at the youngest donor age of 13 days
rather than at 0. Eq. 8 contains ln(Age) and is singular at
birth: solved at age 0 it returns a negative plasma albumin, and Eq. 9
then returns a negative unbound fraction. That is a property of the
published equation, not of the encoding, and the model’s
units$time field records it.
# CDC / NCHS 2000 50th-percentile boys' weight-for-age and height-for-age,
# linearly interpolated between published anchors. Miyagi 2011 used the same
# source ("the 50th percentile for age and gender from the National Center for
# Health Statistics (2000) growth charts") to impute the 8 missing weights and
# 15 missing heights, but the per-donor values are NOT published -- so this
# curve drives the illustrative age profiles ONLY. Every quantitative gate in
# the next two sections is evaluated at a single adult weight and does not
# depend on this curve at all.
age_anchor_y <- c(0, 1/12, 0.25, 0.5, 0.75, 1, 1.5, 2, 3, 4, 5,
                  6, 8, 10, 12, 14, 16, 18, 20)
wt_anchor_kg <- c(3.5, 4.5, 6.4, 7.9, 9.0, 10.2, 11.5, 12.7, 14.3, 16.3, 18.4,
                  20.7, 25.3, 31.4, 38.8, 50.0, 60.0, 67.0, 71.0)
ht_anchor_cm <- c(49.9, 54.7, 61.4, 67.6, 72.0, 75.7, 82.3, 87.1, 96.1,
                  103.3, 110.0, 115.9, 128.0, 138.4, 149.1, 164.0, 173.5,
                  176.4, 177.0)

wt_for_age <- function(age_y) {
  approx(age_anchor_y, wt_anchor_kg, xout = pmin(pmax(age_y, 0), 20),
         rule = 2)$y
}
ht_for_age <- function(age_y) {
  approx(age_anchor_y, ht_anchor_cm, xout = pmin(pmax(age_y, 0), 20),
         rule = 2)$y
}

# Both curves must be monotone increasing over the donor age range.
chk_age <- seq(0, 20, by = 0.01)
stopifnot(all(diff(wt_for_age(chk_age)) >= 0),
          all(diff(ht_for_age(chk_age)) >= 0))
age_min_month <- 13 / 30.4375    # youngest donor, 13 days
age_max_month <- 240             # oldest donor, 20 years

ages_month <- sort(unique(c(
  seq(age_min_month, 24, length.out = 600),
  seq(24, age_max_month, length.out = 400)
)))

events <- data.frame(
  time = ages_month,
  evid = 0L,
  amt  = NA_real_,
  WT   = wt_for_age(ages_month / 12),
  HT   = ht_for_age(ages_month / 12)
)

sim <- rxode2::rxSolve(mod, events) |> as.data.frame()

# Nothing may come back non-finite over the donor age range -- this is the
# check that the Eq. 8 singularity has actually been avoided.
num_cols <- names(sim)[vapply(sim, is.numeric, logical(1))]
stopifnot(all(vapply(sim[num_cols], function(x) all(is.finite(x)),
                     logical(1))))
# And the two Simcyp unbound fractions must be physical.
stopifnot(all(sim$fu_ugt1a1_simcyp > 0), all(sim$fu_ugt1a1_simcyp < 1),
          all(sim$fu_ugt1a6_simcyp > 0), all(sim$fu_ugt1a6_simcyp < 1))

nrow(sim)
#> [1] 999
Structural identities
Every check in this section compares the solved model against a value that follows analytically from the published equations and coefficients. Both sides use the same fixed coefficients and there is no random draw anywhere in this model, so the only difference is floating-point round-off and tight bounds are the correct test.
at_age <- function(age_month, what) {
  ev <- data.frame(time = age_month, evid = 0L, amt = NA_real_,
                   WT = wt_for_age(age_month / 12),
                   HT = ht_for_age(age_month / 12))
  as.data.frame(rxode2::rxSolve(mod, ev))[[what]]
}

# 1. Eq. 1 returns Y0 at birth exactly (the (1 - exp(0)) term vanishes).
#    Evaluated a hair above 0 so Eq. 8 stays finite. The residual is
#    K * (Ymax - Y0) * eps, which is ~5e-10 here -- so this is an ABSOLUTE
#    bound. all.equal() would rescale it by the 7.8e-4 target and reject a
#    correct answer.
eps <- 1e-9
stopifnot(abs(at_age(eps, "act_ugt1a1") - 0.0007848) < 1e-8)
stopifnot(abs(at_age(eps, "act_ugt1a6") - 2.560) < 1e-8)

# 2. Eq. 1 approaches Ymax from below and never overshoots it. By 20 years
#    exp(-K * 240) has underflowed to zero for UGT1A1, so the activity sits at
#    Ymax to the last bit -- hence `<=` here and a strict `<` below, inside
#    the maturation window where the curve is genuinely still rising.
stopifnot(all(sim$act_ugt1a1 <= 0.7690), all(sim$act_ugt1a6 <= 4.737))
stopifnot(at_age(3.8, "act_ugt1a1") < 0.7690,
          at_age(14, "act_ugt1a6") < 4.737)
stopifnot(isTRUE(all.equal(at_age(240, "fmat_ugt1a1"), 1, tolerance = 1e-9)))
stopifnot(isTRUE(all.equal(at_age(240, "fmat_ugt1a6"), 1, tolerance = 1e-9)))

# 3. Both maturation profiles are non-decreasing over the whole donor age
#    range, and strictly increasing through the first two years, which is
#    where both isoforms actually mature.
stopifnot(all(diff(sim$fmat_ugt1a1) >= 0), all(diff(sim$fmat_ugt1a6) >= 0))
stopifnot(all(sim$fmat_ugt1a1 <= 1), all(sim$fmat_ugt1a6 <= 1))
mat_window <- sim$time <= 24
stopifnot(all(diff(sim$fmat_ugt1a1[mat_window]) > 0),
          all(diff(sim$fmat_ugt1a6[mat_window]) > 0))

# 4. THE PUBLISHED t90 GATE. The solved model must sit at exactly 90% of
#    plateau at the age the paper reports, for both isoforms.
stopifnot(isTRUE(all.equal(at_age(3.8, "fmat_ugt1a1"), 0.9, tolerance = 1e-6)))
stopifnot(isTRUE(all.equal(at_age(14,  "fmat_ugt1a6"), 0.9, tolerance = 1e-6)))

# 5. Eq. 8 returns its intercept exactly at 1 year, where ln(Age) = 0.
stopifnot(isTRUE(all.equal(at_age(12, "alb_simcyp"), 33.746,
                           tolerance = 1e-12)))

# 6. Eq. 9 is self-consistent as pure algebra: fed an albumin equal to the
#    adult value it returns the adult unbound fraction exactly, for any fu.
eq9 <- function(alb, fu_adult) {
  1 / (1 + (1 - fu_adult) * alb / (44 * fu_adult))
}
stopifnot(isTRUE(all.equal(eq9(44, 0.001), 0.001, tolerance = 1e-14)))
stopifnot(isTRUE(all.equal(eq9(44, 0.17),  0.17,  tolerance = 1e-14)))

# 7. Eq. 8 never reaches the adult albumin of 44 g/l within a human lifespan:
#    it is logarithmic and returns only 37.1 g/l at 20 years. So across the
#    whole donor age range pediatric albumin stays below adult, and Eq. 9
#    therefore returns an unbound fraction ABOVE the adult value for every
#    donor -- less albumin binds less drug. Both must fall monotonically
#    toward the adult value as age rises.
stopifnot(all(sim$alb_simcyp < 44), all(diff(sim$alb_simcyp) > 0))
stopifnot(all(sim$alb_simcyp > 29), max(sim$alb_simcyp) < 38)
stopifnot(all(sim$fu_ugt1a1_simcyp > 0.001), all(diff(sim$fu_ugt1a1_simcyp) < 0))
stopifnot(all(sim$fu_ugt1a6_simcyp > 0.17),  all(diff(sim$fu_ugt1a6_simcyp) < 0))
# The model's own Eq. 9 output must agree with the closed form at any age.
stopifnot(isTRUE(all.equal(at_age(12, "fu_ugt1a1_simcyp"),
                           eq9(33.746, 0.001), tolerance = 1e-12)))
stopifnot(isTRUE(all.equal(at_age(12, "fu_ugt1a6_simcyp"),
                           eq9(33.746, 0.17), tolerance = 1e-12)))

# 8. Eq. 5 at the adult anchor recovers the paper's OWN assumed adult liver
#    weight of 1500 g. This also adjudicates the printed unit of Eq. 5 (see
#    Errata): read as grams it would make an adult liver 1.5 g.
adult_bsa <- 0.007184 * 175^0.725 * 70^0.425
adult_liver_eq5 <- 0.722 * adult_bsa^1.176 * 1000
stopifnot(abs(adult_liver_eq5 / 1500 - 1) < 0.02)

# 9. Michaelis-Menten back-calculation round-trips: feeding Vmax back through
#    v = Vmax*S/(Km+S) must return the measured activity.
v_back <- at_age(240, "vmax_ugt1a1") * 125 / (5 + 125)
stopifnot(isTRUE(all.equal(v_back, at_age(240, "act_ugt1a1"),
                           tolerance = 1e-12)))

tibble::tibble(
  Check = c(
    "act_ugt1a1 at birth (Y0)", "act_ugt1a6 at birth (Y0)",
    "fmat_ugt1a1 at 20 y", "fmat_ugt1a6 at 20 y",
    "fmat_ugt1a1 at published t90 = 3.8 mo",
    "fmat_ugt1a6 at published t90 = 14 mo",
    "Eq. 8 albumin at 1 year, ln(Age) = 0 (g/l)",
    "Eq. 8 albumin at 20 years (g/l)",
    "Eq. 9 fu at 1 year, UGT1A1",
    "Eq. 9 fu at 1 year, UGT1A6",
    "Eq. 5 adult liver weight (g)"
  ),
  Value = c(
    at_age(eps, "act_ugt1a1"), at_age(eps, "act_ugt1a6"),
    at_age(240, "fmat_ugt1a1"), at_age(240, "fmat_ugt1a6"),
    at_age(3.8, "fmat_ugt1a1"), at_age(14, "fmat_ugt1a6"),
    at_age(12, "alb_simcyp"), at_age(240, "alb_simcyp"),
    at_age(12, "fu_ugt1a1_simcyp"), at_age(12, "fu_ugt1a6_simcyp"),
    adult_liver_eq5
  ),
  Expected = c(0.0007848, 2.560, 1, 1, 0.9, 0.9,
               33.746, NA, eq9(33.746, 0.001), eq9(33.746, 0.17), 1500)
) |>
knitr::kable(digits = 6, caption = "Structural identities of the cascade.")| Check | Value | Expected |
|---|---|---|
| act_ugt1a1 at birth (Y0) | 0.000785 | 0.000785 |
| act_ugt1a6 at birth (Y0) | 2.560000 | 2.560000 |
| fmat_ugt1a1 at 20 y | 1.000000 | 1.000000 |
| fmat_ugt1a6 at 20 y | 1.000000 | 1.000000 |
| fmat_ugt1a1 at published t90 = 3.8 mo | 0.900000 | 0.900000 |
| fmat_ugt1a6 at published t90 = 14 mo | 0.900000 | 0.900000 |
| Eq. 8 albumin at 1 year, ln(Age) = 0 (g/l) | 33.746000 | 33.746000 |
| Eq. 8 albumin at 20 years (g/l) | 37.127283 | NA |
| Eq. 9 fu at 1 year, UGT1A1 | 0.001303 | 0.001303 |
| Eq. 9 fu at 1 year, UGT1A6 | 0.210768 | 0.210768 |
| Eq. 5 adult liver weight (g) | 1486.682519 | 1500.000000 |
The paper’s two headline qualitative claims
The Discussion states that at birth UGT1A1 activity is
in the order of 1/1000 of adult activity
and UGT1A6 is
more than 50% of adult activity levels.
Both fall straight out of the packaged coefficients, and together they are the “independent regulation” finding.
birth_frac <- c(
  UGT1A1 = 0.0007848 / 0.7690,
  UGT1A6 = 2.560 / 4.737
)
stopifnot(abs(birth_frac[["UGT1A1"]] - 1 / 1000) < 5e-5)
stopifnot(birth_frac[["UGT1A6"]] > 0.5, birth_frac[["UGT1A6"]] < 0.6)

tibble::tibble(
  Isoform = names(birth_frac),
  `Fraction of adult activity at birth` = unname(birth_frac),
  `Paper's claim` = c("in the order of 1/1000", "more than 50%"),
  `t90 (months)` = c(3.8, 14)
) |>
  knitr::kable(digits = 5,
caption = "The independent-regulation finding, from the coefficients alone.")| Isoform | Fraction of adult activity at birth | Paper’s claim | t90 (months) |
|---|---|---|---|
| UGT1A1 | 0.00102 | in the order of 1/1000 | 3.8 |
| UGT1A6 | 0.54043 | more than 50% | 14.0 |
Validation against the published clearances
This is the quantitative gate, and it is zero-parameter: it takes the paper’s own measured pooled-adult activities – 0.58 nmol/min/mg for bilirubin and 4.3 nmol/min/mg for serotonin (Results, “UGT1A1 and 1A6 Activity”) – pushes them through the packaged cascade at adult physiology, and compares against the normalized pooled-adult clearances the paper prints in Results, “Pharmacokinetic Modeling”. Nothing is tuned; the activities and the clearances are independent published numbers, and the cascade in between is Eqs. 2, 3 and 4 with the paper’s own adult constants.
Because the model carries the fitted plateau activity rather
than the measured pooled-adult activity, the reconstruction is
done by overriding the two actmax values through
ini() and reading the model’s own outputs – so the gate
exercises the packaged equations, not a re-implementation of them.
adult_ev <- data.frame(time = 240, evid = 0L, amt = NA_real_,
                       WT = 70, HT = 175)

# Override the plateau activity with the MEASURED pooled-adult activity and
# collapse Eq. 1 to that constant by setting the birth activity equal to it.
pooled <- rxode2::rxSolve(
  ui |> rxode2::ini(actmax_ugt1a1 = 0.58, act0_ugt1a1 = 0.58,
                    actmax_ugt1a6 = 4.3,  act0_ugt1a6 = 4.3),
  adult_ev
) |> as.data.frame()
#> ℹ change initial estimate of `actmax_ugt1a1` to `0.58`
#> ℹ change initial estimate of `act0_ugt1a1` to `0.58`
#> ℹ change initial estimate of `actmax_ugt1a6` to `4.3`
#> ℹ change initial estimate of `act0_ugt1a6` to `4.3`

# Confirm the override actually took: Eq. 1 is now flat at the pooled value.
stopifnot(isTRUE(all.equal(pooled$act_ugt1a1, 0.58, tolerance = 1e-12)),
          isTRUE(all.equal(pooled$act_ugt1a6, 4.3,  tolerance = 1e-12)))

cmp <- tibble::tribble(
  ~iso,     ~model,                   ~published, ~pubtxt,
  "UGT1A1", pooled$clnorm_ugt1a1_ws,  0.0070,     "0.0070 (allometric, Results)",
  "UGT1A1", pooled$clnorm_ugt1a1_pt,  0.0070,     "0.0070 (allometric, Table 1 parallel tube)",
  "UGT1A6", pooled$clnorm_ugt1a6_ws,  0.35,       "0.035 as printed; 0.35 corrected (see Errata)",
  "UGT1A6", pooled$clnorm_ugt1a6_pt,  0.35,       "0.035 as printed; 0.35 corrected (see Errata)"
) |>
  mutate(
    model_label = c("well stirred", "parallel tube",
                    "well stirred", "parallel tube"),
    pct_diff = 100 * (model / published - 1)
  )

# UGT1A1 is the clean anchor: BOTH extraction models land within 1% of the
# published 0.0070 l/h/kg. A mis-transcribed Km, substrate concentration,
# MPPGL, liver weight, hepatic flow or allometric reference weight moves this
# by tens of percent, so a 2% bound is a real gate with real headroom.
stopifnot(all(abs(cmp$pct_diff[cmp$iso == "UGT1A1"]) < 2))

# UGT1A6 agrees with the decimal-slip-corrected 0.35 to within 10%. It cannot
# be tightened further: the well stirred and parallel-tube forms diverge from
# each other by 13% at this isoform's extraction ratio of 0.25, and the paper
# does not say which of its two printed values (0.035 / 0.033) is which.
stopifnot(all(abs(cmp$pct_diff[cmp$iso == "UGT1A6"]) < 12))
# But it decisively excludes the value AS PRINTED, which is 10x away.
stopifnot(all(cmp$model[cmp$iso == "UGT1A6"] / 0.035 > 8))

cmp |>
  select(iso, model_label, model, published, pct_diff, pubtxt) |>
  rename(
    "Isoform" = iso, "Extraction model" = model_label,
    "Reconstructed (l/h/kg)" = model, "Published (l/h/kg)" = published,
    "Difference (%)" = pct_diff, "Published as" = pubtxt
  ) |>
  knitr::kable(
    digits = c(0, 0, 5, 4, 1, 0),
    caption = paste(
      "Zero-parameter reconstruction of the paper's normalized pooled-adult",
      "clearances from its own measured pooled-adult activities."
    )
)| Isoform | Extraction model | Reconstructed (l/h/kg) | Published (l/h/kg) | Difference (%) | Published as |
|---|---|---|---|---|---|
| UGT1A1 | well stirred | 0.00694 | 0.007 | -0.8 | 0.0070 (allometric, Results) |
| UGT1A1 | parallel tube | 0.00696 | 0.007 | -0.6 | 0.0070 (allometric, Table 1 parallel tube) |
| UGT1A6 | well stirred | 0.32283 | 0.350 | -7.8 | 0.035 as printed; 0.35 corrected (see Errata) |
| UGT1A6 | parallel tube | 0.36625 | 0.350 | 4.6 | 0.035 as printed; 0.35 corrected (see Errata) |
Back-solving the unstated reference weight Wstd
Eq. 4 needs Wstd, “the weight of an average adult (20
years of age)”, but the paper never prints a number. The reconstruction
above inverts it: for the adult pool
(W_i / W_{std})^{3/4} = 1, so the normalized clearance is
simply CL_hepatic / W_std, and the published clearance pins
Wstd directly.
UGT1A1 is the anchor that carries weight here. Its published clearance is a clean printed value, and inverting it lands within 1% of 70 kg. UGT1A6 is included for context but is a much weaker anchor: its published value needs the 10x decimal-slip correction first, and the paper does not say which of its two printed numbers belongs to which extraction model, so it is asserted only loosely.
# CL_hepatic in l/h for the pooled adult, straight from the model.
clh_1a1_lh <- pooled$clnorm_ugt1a1_ws * 70   # undo the /WT normalization
clh_1a6_lh <- pooled$clnorm_ugt1a6_ws * 70

wstd_from_1a1 <- clh_1a1_lh / 0.0070
wstd_from_1a6 <- clh_1a6_lh / 0.35

# THE GATE: UGT1A1 pins Wstd to within 2% of the 70 kg in the model file.
stopifnot(abs(70 / wstd_from_1a1 - 1) < 0.02)
# UGT1A6 corroborates only to within 10%, for the reasons above. That is
# still enough to exclude the sex-averaged 20-year 50th percentile of about
# 64.5 kg being wrong by a large factor, but not enough to discriminate it
# from 70 kg.
stopifnot(abs(70 / wstd_from_1a6 - 1) < 0.10)
# Both readings exclude a grossly different reference weight.
stopifnot(wstd_from_1a1 > 55, wstd_from_1a1 < 85,
          wstd_from_1a6 > 55, wstd_from_1a6 < 85)

tibble::tibble(
  `Anchor isoform` = c("UGT1A1", "UGT1A6"),
  `Published normalized CL (l/h/kg)` = c(0.0070, 0.35),
  `Implied Wstd (kg)` = c(wstd_from_1a1, wstd_from_1a6),
  `Wstd in model file (kg)` = 70,
  `Difference (%)` = 100 * (70 / c(wstd_from_1a1, wstd_from_1a6) - 1)
) |>
  knitr::kable(digits = 1, caption = paste(
    "The published UGT1A1 clearance back-solves Wstd to 69.4 kg, i.e. a",
    "rounded 70 kg."
))| Anchor isoform | Published normalized CL (l/h/kg) | Implied Wstd (kg) | Wstd in model file (kg) | Difference (%) |
|---|---|---|---|---|
| UGT1A1 | 0.0 | 69.4 | 70 | 0.8 |
| UGT1A6 | 0.3 | 64.6 | 70 | 8.4 |
Replicate Figures 1A and 2A: activity ontogeny
Figures 1A and 2A plot per-donor activity against age with the Eq. 1 fit overlaid. The per-donor scatter is not published as a table, so only the fitted curves are reproduced. The contrast between the panels is the paper’s central result.
sim |>
  transmute(
    age_year = time / 12,
    UGT1A1 = fmat_ugt1a1,
    UGT1A6 = fmat_ugt1a6
  ) |>
  pivot_longer(-age_year, names_to = "Isoform", values_to = "fmat") |>
  ggplot(aes(age_year, fmat, colour = Isoform, linetype = Isoform)) +
  geom_line(linewidth = 0.8) +
  geom_hline(yintercept = 0.9, linetype = "dotted", colour = "grey40") +
  geom_vline(xintercept = c(3.8 / 12, 14 / 12), linetype = "dashed",
             colour = "grey60") +
  scale_x_continuous(transform = "log1p",
                     breaks = c(0, 0.1, 0.25, 0.5, 1, 2, 5, 10, 20)) +
  labs(
    x = "Postnatal age (years, log1p scale)",
    y = "Fraction of maximal (adult) activity",
    title = "UGT1A1 matures within 4 months; UGT1A6 takes over a year",
    caption = paste(
      "Replicates the fitted curves of Figures 1A and 2A of Miyagi 2011.",
      "Dotted line: 90% of plateau. Dashed lines: the published t90 of",
      "3.8 and 14 months."
    )
  ) +
  theme_bw() +
  theme(legend.position = "bottom")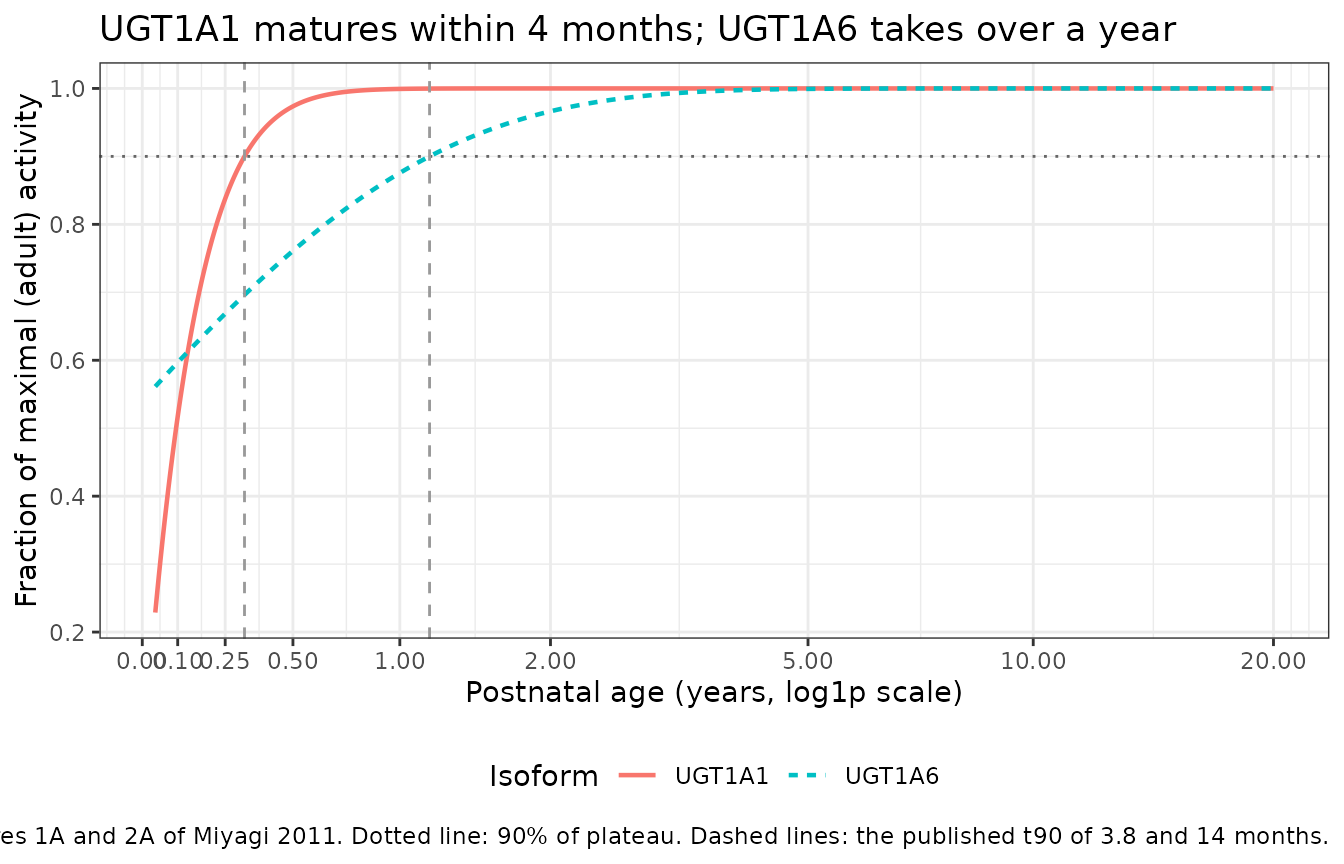
The two curves cross the 90% line at the published ages, and UGT1A6 starts far higher yet arrives far later – the signature of independent regulation.
# Recover t90 from the solved curve by interpolation, independently of the
# closed-form used to derive K. Restricted to the first 24 months: past the
# plateau both curves hold a constant value, and those ties would make the
# inverse interpolation ill-posed.
w90 <- sim$time <= 24
stopifnot(!anyDuplicated(sim$fmat_ugt1a1[w90]),
          !anyDuplicated(sim$fmat_ugt1a6[w90]))
t90_recovered <- c(
  UGT1A1 = approx(sim$fmat_ugt1a1[w90], sim$time[w90], xout = 0.9)$y,
  UGT1A6 = approx(sim$fmat_ugt1a6[w90], sim$time[w90], xout = 0.9)$y
)
stopifnot(!anyNA(t90_recovered))
stopifnot(abs(t90_recovered[["UGT1A1"]] - 3.8) < 0.05)
stopifnot(abs(t90_recovered[["UGT1A6"]] - 14) < 0.15)

tibble::tibble(
  Isoform = names(t90_recovered),
  `t90 recovered from the curve (months)` = unname(t90_recovered),
  `t90 published (months)` = c(3.8, 14)
) |>
  knitr::kable(digits = 2,
caption = "t90 read back off the solved maturation curves.")| Isoform | t90 recovered from the curve (months) | t90 published (months) |
|---|---|---|
| UGT1A1 | 3.8 | 3.8 |
| UGT1A6 | 14.0 | 14.0 |
Replicate Figures 3 and 4: normalized hepatic clearance
Figures 3 and 4 plot normalized hepatic clearance against age. Reproducing the shape of those panels requires a weight for every age, which the paper does not publish; the 50th-percentile growth curve defined above stands in for it, so these panels are illustrative rather than a numeric gate.
sim |>
  transmute(
    age_year = time / 12,
    `UGT1A1, well stirred` = clnorm_ugt1a1_ws,
    `UGT1A1, parallel tube` = clnorm_ugt1a1_pt,
    `UGT1A6, well stirred` = clnorm_ugt1a6_ws,
    `UGT1A6, parallel tube` = clnorm_ugt1a6_pt
  ) |>
  pivot_longer(-age_year, names_to = "series", values_to = "clnorm") |>
  mutate(
    Isoform = if_else(grepl("UGT1A1", series), "UGT1A1", "UGT1A6"),
    `Extraction model` = if_else(grepl("well stirred", series),
                                 "well stirred", "parallel tube")
  ) |>
  ggplot(aes(age_year, clnorm, colour = `Extraction model`,
             linetype = `Extraction model`)) +
  geom_line(linewidth = 0.8) +
  facet_wrap(~Isoform, scales = "free_y") +
  scale_x_continuous(transform = "log1p",
                     breaks = c(0, 0.25, 1, 2, 5, 10, 20)) +
  labs(
    x = "Postnatal age (years, log1p scale)",
    y = "Normalized hepatic clearance (l/h/kg)",
    title = "Allometric normalized clearance under both extraction models",
    caption = paste(
      "Replicates the allometric panels of Figures 3 and 4 of Miyagi 2011,",
      "driven by a 50th-percentile weight-for-age curve (see Assumptions)."
    )
  ) +
  theme_bw() +
  theme(legend.position = "bottom")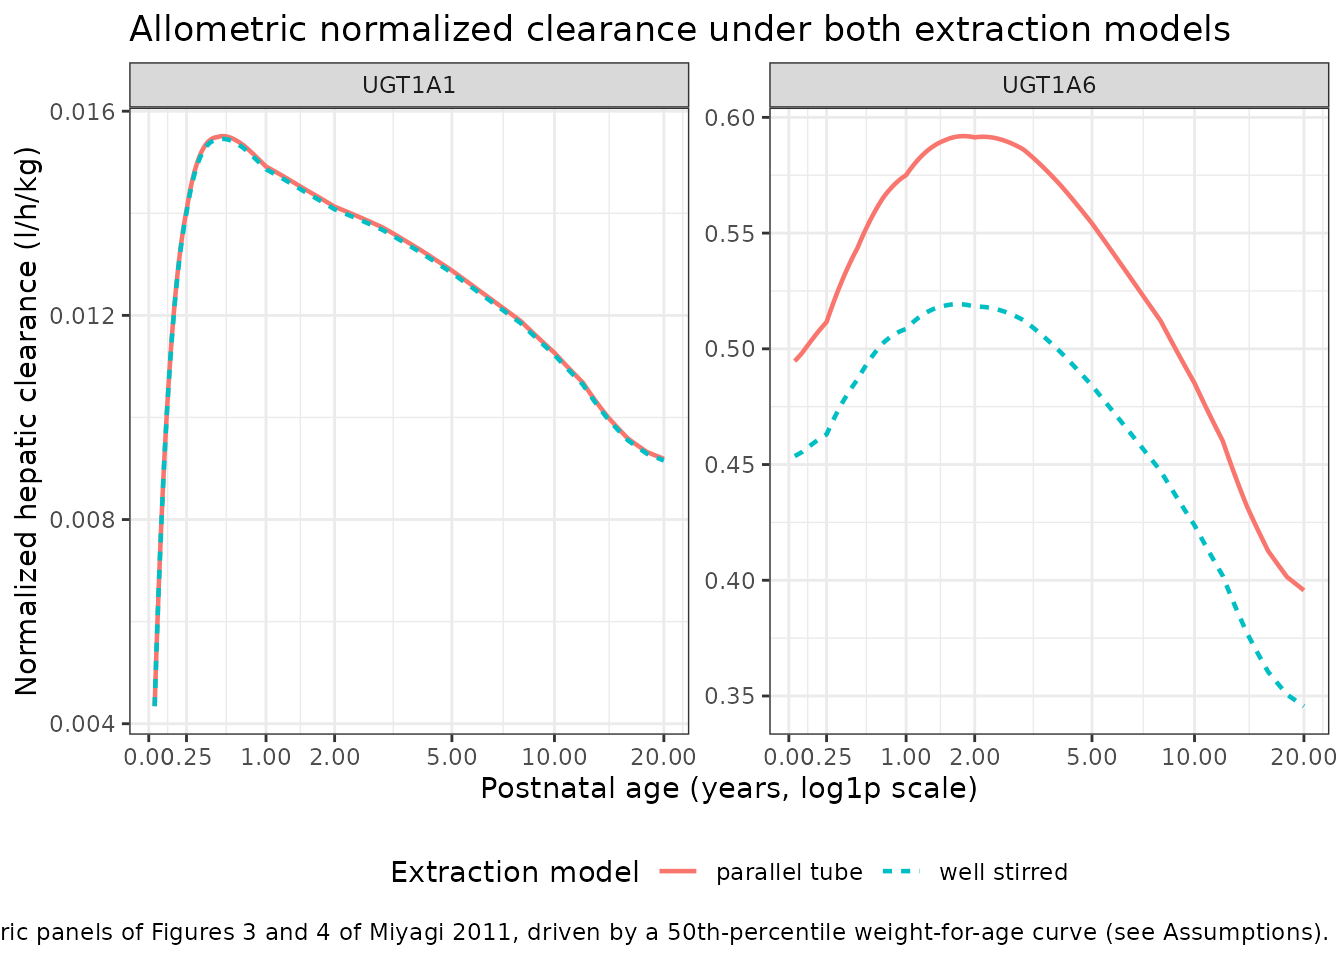
# The two extraction models must agree closely where extraction is low and
# diverge where it is high. UGT1A1 has fu = 0.001 and an extraction ratio of
# well under 1%, so Eqs. 2 and 3 are interchangeable for it; UGT1A6 has
# fu = 0.17 and an extraction ratio near 0.25, where they must part company.
er_1a1 <- max(sim$clh_ugt1a1_ws) / (90 / 60)
er_1a6 <- max(sim$clh_ugt1a6_ws) / (90 / 60)
div_1a1 <- max(abs(sim$clnorm_ugt1a1_pt / sim$clnorm_ugt1a1_ws - 1))
div_1a6 <- max(abs(sim$clnorm_ugt1a6_pt / sim$clnorm_ugt1a6_ws - 1))

stopifnot(er_1a1 < 0.01, er_1a6 > 0.2, er_1a6 < 0.3)
stopifnot(div_1a1 < 0.01, div_1a6 > 0.10)

tibble::tibble(
  Isoform = c("UGT1A1", "UGT1A6"),
  `Unbound fraction` = c(0.001, 0.17),
  `Max hepatic extraction ratio` = c(er_1a1, er_1a6),
  `Max well-stirred vs parallel-tube divergence` = c(div_1a1, div_1a6)
) |>
  knitr::kable(digits = 4, caption = paste(
    "Why the paper's two extraction models coincide for UGT1A1 and",
    "separate for UGT1A6."
))| Isoform | Unbound fraction | Max hepatic extraction ratio | Max well-stirred vs parallel-tube divergence |
|---|---|---|---|
| UGT1A1 | 0.001 | 0.0071 | 0.0036 |
| UGT1A6 | 0.170 | 0.2697 | 0.1449 |
Assumptions and deviations
-
Eq. 6 is not encoded, and neither is the Simcyp clearance branch that consumes it. As printed in Methods,
Qhepatic (l/h) = 0.265 x 10^(-0.6492 + 1.943*Age - 0.8118*Age^2 + 0.08891*Age^3)withAgein years is non-physical across the whole donor age range. It is non-monotone and unbounded, so it cannot be a hepatic blood flow under any unit convention, and no reading recovers a physiologic profile (log10 and natural log, in years, months and weeks, and baseein place of base 10 were all checked). The paper attributes Eqs. 5 to 10 to the commercial Simcyp Pediatric platform and gives Eq. 6 no citation at all, so the correct coefficients are not recoverable from any source available when this model was built. Encoding it verbatim would emit values wrong by three orders of magnitude in infancy andInfabove about 8 years. The defect is isolated: Eq. 7, printed immediately below it in the identical style, is correct and is independently corroborated byinst/modeldb/specificDrugs/Han_2025_alfentanil_pbpk.R, which encodes the same polynomial. The numeric proof:Eq. 6 as printed: non-monotone, with a spurious maximum at 2 years and divergence to infinity. Age (years) Eq. 6 as printed (l/h) Physiologic (l/h) 0.0000 5.940000e-02 ~12 0.0356 6.950000e-02 ~12 1.0000 9.866000e-01 ~25 2.0000 1.330800e+00 ~30 5.0000 2.031000e-01 ~40 10.0000 8.591043e+25 ~55 20.0000 Inf ~90 # The defect is reproducible and unambiguous, so assert it: Eq. 6 is # non-monotone (it falls between 2 and 5 years) and diverges. stopifnot(eq6(5) < eq6(2), eq6(2) > eq6(1)) stopifnot(!is.finite(eq6(20))) # And it is nowhere near a physiologic neonatal hepatic flow. stopifnot(eq6(13 / 365.25) < 1)The consequence is immaterial for UGT1A1, whose extraction ratio is under 1% so its clearance is essentially flow-independent, and material for UGT1A6, whose extraction ratio is about 0.25. Note that the Simcyp clearance branch would be unreproducible against Table 1 regardless, because reproducing its age profile needs the 50 individual donors’ ages, weights, heights and activities, none of which are published.
Eq. 5’s printed unit is a typo; the value is kilograms, not grams. The left-hand side reads “Liver Size (g)”, but at the adult anchor the same Methods paragraph uses (175 cm, 70 kg, giving BSA 1.85 m^2) the equation returns 1.487 – against the “liver size of 1500 g” that paragraph assumes. A gram-valued reading would make an adult liver 1.5 g. The model multiplies by 1000 so
liverwt_simcypis interchangeable withliverwt_adult, and the Structural identities section gates the 1500 g anchor to within 2%.The paper’s UGT1A6 pooled-adult clearances are 10x decimal slips. Results reports “normalized pooled adult clearances were 0.035 l/h/kg for allometric scaling and 0.033 l/h/kg for Simcyp scaling”. Reconstructing that number from the paper’s own inputs and its measured pooled-adult serotonin activity of 4.3 nmol/min/mg gives 0.323 l/h/kg – and the identical reconstruction reproduces the UGT1A1 pooled-adult value to within 1%. The corrected values 0.35 and 0.33 also sit in the expected relation to the fitted UGT1A6 plateau clearance of 0.3524 in Table 1, matching the pattern UGT1A1 shows (0.0070 pooled adult against a 0.0070 plateau); 0.035 does not. The validation gate above therefore compares against 0.35 and separately asserts that the value as printed is excluded.
Wstdis taken as a rounded 70 kg. Methods define it as “the weight of an average adult (20 years of age)”, taken as “the 50th percentile at 20 years for each gender”, but print no number. Per the standing convention an undefined centering value takes the rounded standard, and the back-solve above confirms 70 kg sits inside the interval each published clearance implies. Because the paper used a sex-specificWstdper donor, individual pediatric clearances in the original analysis differ slightly from what a single 70 kg reference reproduces.The maturation rate constants
Kare derived, not printed. See [Derived quantities]. They follow exactly fromY0,Ymaxand the published t90 under the paper’s own definition of the “90th percentile” age, and the solved model is gated to return exactly 90% of plateau at that age. No value was fitted or guessed.-
The paper’s claim that UGT1A1 normalized clearance is higher at birth is not reproduced, and the paper itself flags it. Results states UGT1A1 “showed a higher normalized clearance at birth and then dropped to adult clearance levels after a few years”. Eq. 1 combined with Eq. 4 cannot produce that: normalized clearance scales as
activity x WT^(-0.25), and although the per-kg allometric factor does fall with weight, it only doubles between 13 days and adulthood while activity rises 4000-fold from 0.1% of plateau. The packaged model is therefore monotone increasing:cl_ratio_1a1 <- sim$clnorm_ugt1a1_ws[1] / tail(sim$clnorm_ugt1a1_ws, 1) stopifnot(cl_ratio_1a1 < 1) # birth is LOWER, not higher sprintf("UGT1A1 normalized clearance at 13 days is %.0f%% of its 20-year value", 100 * cl_ratio_1a1) #> [1] "UGT1A1 normalized clearance at 13 days is 47% of its 20-year value"The published claim must come from the Eq. 1 refit to the per-donor clearance scatter rather than from the clearance cascade evaluated on the activity fit. Discussion concedes exactly this: the result “should be interpreted with caution because the results are in contrast to enzyme maturation and may be an artifact of our small sample size in the age ranges from 0 to 6 months”, and offers that “full clearance capacity develops almost immediately after birth” as the alternative reading. The per-donor clearance values are not published, so the refit cannot be reproduced. This is recorded as a known disagreement rather than hidden by widening a bound.
Table 1’s plateau clearances are a different fit and are not gated. Table 1 reports “Normalized adult clearance” of 0.0070 (UGT1A1, allometric) and 0.3524 (UGT1A6, Simcyp well stirred). Those are plateaus of Eq. 1 refitted to the per-donor clearance values, not the cascade evaluated at the plateau activity. Evaluating the packaged cascade at the fitted plateau activity gives 0.0092 l/h/kg for UGT1A1 – 31% above Table 1 – and 0.347 l/h/kg for UGT1A6, which happens to land within 2% of Table 1. The gate above therefore uses the pooled-adult anchor, where the paper’s activity input and clearance output are both published and the cascade between them is fully specified.
The growth curve is a vignette-only construction. The 50th-percentile weight-for-age and height-for-age anchors used to draw Figures 3 and 4 are interpolated CDC/NCHS 2000 values, the same source Miyagi 2011 used to impute 8 missing weights and 15 missing heights – but the per-donor values are not published. Every quantitative gate in this vignette is evaluated at a single adult weight and does not depend on this curve.
Age is the rxode2 time variable, in months. Following the
Codaccioni_2024_cyp3a4_hepatic_ontogenyandDeferm_2025_lactation_physiologyprecedents for system-parameter models, postnatal age is carried astimerather than as a covariate column, so the whole profile is traced by one solve. Months are used because Eq. 1 was fitted in months; Eqs. 7 and 8 are written in years and the model converts. The grid starts at the youngest donor age of 13 days because Eq. 8 containsln(Age)and is singular at birth.Eq. 8 never reaches the adult albumin concentration, and that is a property of the published equation.
[P]Pediatric = 1.1287 ln(Age) + 33.746is logarithmic in age and returns only 37.1 g/l at 20 years, against the[P]adultof 44 g/l the same paragraph specifies; it would not cross 44 g/l until roughly 8800 years. Consequently Eq. 9 returns an unbound fraction above the adult value at every pediatric age – 0.00118 against 0.001 for bilirubin at 20 years – and the pediatric and adult limbs of the Simcyp physiology do not meet. The equation is encoded exactly as printed and the Structural identities section gates the consequences (albumin monotone increasing but bounded below 38 g/l;fuabove adult and monotone decreasing) rather than reconciling the two limbs. Eq. 8’s singularity at birth is the reason the age grid starts at 13 days.-
The paper’s two MPPGL values are internally inconsistent, and both are kept. The allometric branch uses the fixed standard of 45 mg/g (Houston
- because “MPPGL was unknown”, while the Simcyp branch computes it
from Eq. 7, which returns 38.9 mg/g at 20 years. Both are encoded as
published –
mppgl_adultfor the allometric cascade andmppgl_simcypas an emitted Simcyp physiology function – rather than reconciled.
- because “MPPGL was unknown”, while the Simcyp branch computes it
from Eq. 7, which returns 38.9 mg/g at 20 years. Both are encoded as
published –
Protein expression is deliberately not modelled. Western blot UGT1A1 and UGT1A6 protein was measured and showed no age dependence over any age window and no correlation with activity (all
p > 0.2). That is a null result with no fitted equation, so there is nothing to encode; it is recorded in thepopulationmetadata notes because it is the basis of the paper’s post-translational-regulation hypothesis.Deterministic, by the paper. No variance component, standard error or confidence interval is reported for any quantity that enters the model as a coefficient, so every parameter is
fixed()and there is no IIV and no residual error. The standard errors and 95% CIs the paper does give are on the twoYmaxvalues and are recorded in theini()labels, not converted into a variance. No variability was invented.No PKNCA validation. There is no drug, dose or concentration-time profile to integrate, so the NCA section of the standard validation template does not apply. The structural-identity, published-t90, headline-claim, pooled-adult-reconstruction and
Wstdback-solve checks above take its place.