Hepatic CYP3A4 ontogeny, Salem vs modified Upreti (Codaccioni 2024)
Source:vignettes/articles/Codaccioni_2024_cyp3a4_hepatic_ontogeny.Rmd
Codaccioni_2024_cyp3a4_hepatic_ontogeny.RmdModel and source
- Citation: Codaccioni M, Southall RL, Dinh J, Johnson TN. Prediction of pediatric pharmacokinetics for CYP3A4 metabolized drugs: comparison of the performance of two hepatic ontogeny within a physiologically based pharmacokinetic model. J Clin Pharmacol. 2024;64(9):1083-1094. doi:10.1002/jcph.2452. Equation (1) and Equation (2) are printed in Methods, section ‘Modified Upreti and Salem Hepatic CYP3A4 Ontogeny Functions’; all coefficient values are from Supplementary Table S2. The two profiles originate in Salem F, Johnson TN, Abduljalil K, Tucker GT, Rostami-Hodjegan A. Clin Pharmacokinet. 2014;53(7):625-636 (doi:10.1007/s40262-014-0140-7) and Upreti VV, Wahlstrom JL. J Clin Pharmacol. 2016;56(3):266-283 (doi:10.1002/jcph.585); both are restated in full, with the Codaccioni modifications applied, in Supplementary Table S2 of the present paper, which is the source used here.
- Description: PBPK system-parameter (hepatic enzyme ontogeny) model. The two in vivo derived hepatic CYP3A4 ontogeny profiles compared by Codaccioni 2024 within the Simcyp v22.1 paediatric P-PBPK population: the Salem profile (Salem 2014, deconvoluted from paediatric intravenous midazolam data) and the MODIFIED Upreti profile (Upreti and Wahlstrom 2016, deconvoluted from paediatric sufentanil data, with three modifications introduced by Codaccioni 2024). Both are emitted side by side, together with their ratio, so the head-to-head comparison that is the subject of the paper can be run directly. This is a SYSTEM layer intended to be coupled to a PBPK drug model – it contains no drug, no dosing, no compartments and no ODEs. Each output is an algebraic function of the rxode2 time variable, which the model interprets as postnatal age in YEARS, so a solve over time 0 to 25 traces both profiles from birth to the adult plateau. The output is the fraction of adult hepatic CYP3A4 activity, which enters the Simcyp hepatic clearance cascade as the ‘ontogeny fraction’ multiplier (see the vignette; the remaining terms of that cascade are NOT encoded here because their age functions and the drug-specific intrinsic clearances live in Simcyp library files that the paper does not reproduce). The three Codaccioni modifications to Upreti are: fractional adult expression at birth raised from 0.10 to 0.15; the C3 term removed from the second (post-Age-Cap) equation; and the profile clamped to the adult value of 1 above 12.5 years, because the unclamped equation declines indefinitely below 1. Deterministic: Codaccioni 2024 report no variability, standard errors or confidence intervals for any ontogeny coefficient, so every parameter is fixed and the model carries no between-subject variability and no residual error.
- Article: https://doi.org/10.1002/jcph.2452
Codaccioni 2024 asks which of two published in vivo derived hepatic CYP3A4 ontogeny profiles should be used inside a paediatric physiologically based pharmacokinetic (P-PBPK) model. The two candidates are the profile of Salem 2014, deconvoluted from paediatric intravenous midazolam clearance, and the profile of Upreti and Wahlstrom 2016, deconvoluted from paediatric sufentanil clearance. The authors modify the latter in three ways and then run both, sequentially and with the same fixed random seed, through Simcyp v22.1 simulations of 17 paediatric clinical scenarios covering four intravenous CYP3A4 substrates. The modified Upreti profile wins on both bias and precision.
This vignette packages the object that decides that comparison: the two ontogeny functions themselves. It is a system-parameter model. There is no drug, no dose, no compartment and no ODE; the rxode2 time variable is postnatal age in years and the outputs are the fraction of adult hepatic CYP3A4 activity under each profile, plus their ratio.
What is deliberately not packaged, and why, is set out under Assumptions and deviations.
Population
Neither ontogeny function carries a covariate: both are functions of postnatal age alone. The population metadata therefore describes the two cohorts that stand behind the model rather than a covariate distribution.
The only coefficient newly derived in this paper is the modified Upreti fractional adult expression at birth, raised from the published 0.10 to 0.15 by deconvoluting individual intravenous midazolam clearances in 9 full-term neonates less than 1 week old, pooled from two studies (Methods, “Modified Upreti and Salem Hepatic CYP3A4 Ontogeny Functions”). Every other coefficient in either profile is inherited from Salem 2014 or Upreti and Wahlstrom 2016 and restated in Supplementary Table S2.
The verification cohort is a curated dataset of 13 studies reporting 17 single-dose clinical scenarios from birth to 15.71 years (Table 1), across alfentanil, fentanyl, midazolam and sildenafil. Inclusion required a fraction metabolised via CYP3A4 at or above 80% in adults and a low-to-intermediate hepatic extraction ratio (below 0.7). Critically ill children, cardiopulmonary-bypass patients, ventilated children receiving midazolam, children on CYP3A4 comedication or on halothane/isoflurane, and preterm infants below 36 gestational weeks were excluded. Simulations used the Simcyp Sim-Pediatric population, except the Hamano 2019 midazolam scenario which used Sim-Japanese Pediatric.
The same information is available programmatically:
str(readModelDb("Codaccioni_2024_cyp3a4_hepatic_ontogeny")()$population)
#> List of 9
#>  $ species       : chr "human"
#>  $ n_subjects    : int 9
#>  $ n_studies     : int 13
#>  $ age_range     : chr "Birth to 15.71 years across the paediatric verification dataset (Codaccioni 2024 Table 1); the ontogeny functio"| __truncated__
#>  $ sex_female_pct: num NA
#>  $ race_ethnicity: chr "Not carried by either ontogeny function. The paediatric verification simulations used the Simcyp Sim-Pediatric "| __truncated__
#>  $ disease_state : chr "Relatively healthy children undergoing minor or reshaping surgery, day-case surgery, or elective non-cardiac su"| __truncated__
#>  $ dose_range    : chr "n/a (no drug in this model)"
#>  $ notes         : chr "n_subjects = 9 is the number of full-term neonates less than 1 week old, pooled from two studies, whose individ"| __truncated__
Source trace
Both equations are printed in Methods, section “Modified Upreti and Salem Hepatic CYP3A4 Ontogeny Functions”. Every coefficient is from Supplementary Table S2.
Equation (1), fraction of adult for ages up to the Age Cap:
Equation (2), fraction of adult for ages above the Age Cap (modified Upreti only, to 12.5 years):
| Equation / parameter | Value | Source location |
|---|---|---|
Equation (1), Hill rise to FMax
|
n/a | Methods, “Modified Upreti and Salem Hepatic CYP3A4 Ontogeny Functions”, Eq. (1) |
| Equation (2), exponential decline above the Age Cap | n/a | Methods, same section, Eq. (2) |
| Clamp to the adult value above 12.5 years | n/a | Methods, same section: “after age 12.5, the fractional activity of CYP3A4 in children was set to be comparable to adults” |
Removal of the C3 term from the published Upreti
equation |
n/a | Methods, same section: “removing the C3 term from the published Upreti model … a value for C3 of zero should be used” |
salem_birth |
0.11 | Table S2, F Birth, Salem column |
salem_max |
1.06 | Table S2, F Max, Salem column |
salem_t50 |
0.64 | Table S2, Age 50, Salem column |
salem_hill |
1.91 | Table S2, n, Salem column |
salem_agecap |
25 | Table S2, Age Cap, Salem column |
upreti_birth |
0.15 | Table S2, F Birth, Modified Upreti column; re-derived
from 9 term neonates (Methods) |
upreti_max |
1.7 | Table S2, F Max, Modified Upreti column |
upreti_t50 |
0.1 | Table S2, Age 50, Modified Upreti column |
upreti_hill |
1.3 | Table S2, n, Modified Upreti column |
upreti_agecap |
2.5 | Table S2, Age Cap, Modified Upreti column |
upreti_c0 |
0.7 | Table S2, C 0, Modified Upreti column |
upreti_c1 |
1 | Table S2, C 1, Modified Upreti column |
upreti_c2 |
-0.1 | Table S2, C 2, Modified Upreti column |
upreti_agecap2 |
12.5 | Table S2, Age Cap (second equation), Modified Upreti
column |
upreti_adult |
1 | Methods clamp statement (fraction of adult of exactly 1) |
Units
Every quantity in this model is either an age in years or a dimensionless fraction, so the dimensional analysis is short but worth stating explicitly.
| Symbol | Units | Note |
|---|---|---|
time, age
|
year | postnatal age; the rxode2 time variable IS the age |
salem_t50, upreti_t50
|
year | must share units with age for
Age^n / (Age50^n + Age^n) to be dimensionless |
salem_agecap, upreti_agecap,
upreti_agecap2
|
year | knot / cap ages |
salem_hill, upreti_hill
|
unitless | exponent |
salem_birth, salem_max,
upreti_birth, upreti_max
|
unitless | fraction of adult activity |
upreti_c0, upreti_c1,
upreti_adult
|
unitless | fraction of adult activity |
upreti_c2 |
1/year | multiplies an age difference inside exp(), which must
be dimensionless |
fcyp3a4_salem, fcyp3a4_upreti
|
unitless | fraction of adult hepatic CYP3A4 activity |
fcyp3a4_ratio_salem_upreti |
unitless | ratio of two fractions |
Where this multiplier is consumed
The supplement gives the two Simcyp equations into which the ontogeny fraction feeds. They are reproduced here for context; they are not encoded in the model file (see Assumptions and deviations):
The second is the well-stirred liver model. Both are used below to derive what the packaged ontogeny functions predict about the paper’s own results table.
Parameter round-trip against Table S2
mod <- readModelDb("Codaccioni_2024_cyp3a4_hepatic_ontogeny")

fitted <- ui$theta

published <- c(
  salem_birth = 0.11, salem_max = 1.06, salem_t50 = 0.64,
  salem_hill = 1.91, salem_agecap = 25,
  upreti_birth = 0.15, upreti_max = 1.7, upreti_t50 = 0.1,
  upreti_hill = 1.3, upreti_agecap = 2.5,
  upreti_c0 = 0.7, upreti_c1 = 1, upreti_c2 = -0.1,
  upreti_agecap2 = 12.5, upreti_adult = 1
)

stopifnot(setequal(names(fitted), names(published)))
stopifnot(isTRUE(all.equal(unname(fitted[names(published)]),
                           unname(published), tolerance = 1e-12)))

tibble::tibble(
  Parameter = names(published),
  `Table S2` = unname(published),
  `Model file` = unname(fitted[names(published)])
) |>
knitr::kable(caption = "Every ini() value round-trips against Supplementary Table S2.")| Parameter | Table S2 | Model file |
|---|---|---|
| salem_birth | 0.11 | 0.11 |
| salem_max | 1.06 | 1.06 |
| salem_t50 | 0.64 | 0.64 |
| salem_hill | 1.91 | 1.91 |
| salem_agecap | 25.00 | 25.00 |
| upreti_birth | 0.15 | 0.15 |
| upreti_max | 1.70 | 1.70 |
| upreti_t50 | 0.10 | 0.10 |
| upreti_hill | 1.30 | 1.30 |
| upreti_agecap | 2.50 | 2.50 |
| upreti_c0 | 0.70 | 0.70 |
| upreti_c1 | 1.00 | 1.00 |
| upreti_c2 | -0.10 | -0.10 |
| upreti_agecap2 | 12.50 | 12.50 |
| upreti_adult | 1.00 | 1.00 |
Simulation
There is no dose and no ODE state, so the event table is a pure observation grid over postnatal age.
ages <- rxode2::et(seq(0, 25, by = 0.01))
sim <- rxode2::rxSolve(mod, ages) |> as.data.frame()

stopifnot(!anyNA(sim$fcyp3a4_salem), !anyNA(sim$fcyp3a4_upreti))
head(sim)
#>   time  age age_salem fcyp3a4_salem age_upreti f_upreti_eq1 f_upreti_eq2
#> 1 0.00 0.00      0.00     0.1100000       0.00    0.1500000     1.984025
#> 2 0.01 0.01      0.01     0.1103371       0.01    0.2239764     1.982742
#> 3 0.02 0.02      0.02     0.1112656       0.02    0.3202682     1.981460
#> 4 0.03 0.03      0.03     0.1127414       0.03    0.4180055     1.980179
#> 5 0.04 0.04      0.04     0.1147390       0.04    0.5112249     1.978900
#> 6 0.05 0.05      0.05     0.1172382       0.05    0.5976807     1.977621
#>   fcyp3a4_upreti fcyp3a4_ratio_salem_upreti
#> 1      0.1500000                  0.7333333
#> 2      0.2239764                  0.4926282
#> 3      0.3202682                  0.3474139
#> 4      0.4180055                  0.2697126
#> 5      0.5112249                  0.2244393
#> 6      0.5976807                  0.1961552
Structural identities
These checks compare the solved model against values that follow
analytically from Equations (1) and (2) and the Table S2 coefficients.
Both sides use the same coefficients, so the only difference is
numerical round-off and a tight all.equal bound is the
correct test.
f_at <- function(age, what) {
  s <- rxode2::rxSolve(mod, rxode2::et(age)) |> as.data.frame()
  s[[what]]
}

# 1. At birth both profiles return F_Birth exactly (Eq. 1 numerator is 0).
stopifnot(isTRUE(all.equal(f_at(0, "fcyp3a4_salem"), 0.11, tolerance = 1e-12)))
stopifnot(isTRUE(all.equal(f_at(0, "fcyp3a4_upreti"), 0.15, tolerance = 1e-12)))

# 2. Salem is capped at its Age Cap of 25 years and is flat beyond it.
salem_cap_value <- f_at(25, "fcyp3a4_salem")
stopifnot(isTRUE(all.equal(salem_cap_value, f_at(60, "fcyp3a4_salem"),
                           tolerance = 1e-12)))
# Eq. 1 at 25 years sits just under the F_Max asymptote of 1.06.
stopifnot(salem_cap_value < 1.06,
          isTRUE(all.equal(salem_cap_value, 1.06, tolerance = 2e-3)))

# 3. The modified Upreti Eq. 1 branch approaches F_Max = 1.7 from below and
#    hands over to Eq. 2 at 2.5 years, where Eq. 2 equals C0 + C1 = 1.7.
upreti_knot_eq1 <- f_at(2.5, "fcyp3a4_upreti")
upreti_knot_eq2 <- 0.7 + 1 * exp(-0.1 * (2.5 - 2.5))
stopifnot(upreti_knot_eq1 < 1.7,
          isTRUE(all.equal(upreti_knot_eq2, 1.7, tolerance = 1e-12)))

# 4. Above 12.5 years the profile is clamped to the adult value of 1.
stopifnot(isTRUE(all.equal(f_at(12.6, "fcyp3a4_upreti"), 1, tolerance = 1e-12)))
stopifnot(isTRUE(all.equal(f_at(25, "fcyp3a4_upreti"), 1, tolerance = 1e-12)))

# 5. The clamp's stated rationale: unclamped, Eq. 2 keeps declining and
#    crosses 1 inside the adolescent range, tending to C0 = 0.7.
eq2 <- function(age) 0.7 + 1 * exp(-0.1 * (age - 2.5))
cross <- 2.5 + log(1 / 0.3) / 0.1
stopifnot(isTRUE(all.equal(eq2(cross), 1, tolerance = 1e-12)),
          cross > 12.5, cross < 20, eq2(1000) < 0.7 + 1e-6)

tibble::tibble(
  Check = c(
    "f(0), Salem", "f(0), modified Upreti",
    "Salem Eq. 1 at the 25 y Age Cap", "Salem F_Max asymptote",
    "modified Upreti Eq. 1 at the 2.5 y knot",
    "modified Upreti Eq. 2 at the 2.5 y knot",
    "modified Upreti Eq. 2 at 12.5 y (pre-clamp)",
    "modified Upreti clamped value above 12.5 y",
    "unclamped Eq. 2 crosses 1 at (years)"
  ),
  Value = c(
    f_at(0, "fcyp3a4_salem"), f_at(0, "fcyp3a4_upreti"),
    salem_cap_value, 1.06,
    upreti_knot_eq1, upreti_knot_eq2,
    eq2(12.5), f_at(13, "fcyp3a4_upreti"), cross
  )
) |>
knitr::kable(digits = 4, caption = "Structural identities of the two profiles.")| Check | Value |
|---|---|
| f(0), Salem | 0.1100 |
| f(0), modified Upreti | 0.1500 |
| Salem Eq. 1 at the 25 y Age Cap | 1.0591 |
| Salem F_Max asymptote | 1.0600 |
| modified Upreti Eq. 1 at the 2.5 y knot | 1.6767 |
| modified Upreti Eq. 2 at the 2.5 y knot | 1.7000 |
| modified Upreti Eq. 2 at 12.5 y (pre-clamp) | 1.0679 |
| modified Upreti clamped value above 12.5 y | 1.0000 |
| unclamped Eq. 2 crosses 1 at (years) | 14.5397 |
Two discontinuities are inherent to the published modified Upreti profile and are reproduced rather than smoothed: a step of 1.4% at the 2.5-year handover from Equation (1) to Equation (2), and a step of -6.4% at the 12.5-year clamp. Both are consequences of the coefficients as published in Table S2.
Replicate Figure S1
Figure S1 of the supplement plots the two profiles against age. The
modified Upreti profile rises far faster over the first months of life,
overshoots the adult value, and decays back toward it; the Salem profile
rises much more slowly and approaches its FMax of 1.06 only
in late childhood.
sim |>
  select(age, Salem = fcyp3a4_salem, `Modified Upreti` = fcyp3a4_upreti) |>
  pivot_longer(-age, names_to = "Profile", values_to = "fraction") |>
  ggplot(aes(age, fraction, colour = Profile, linetype = Profile)) +
  geom_line(linewidth = 0.8) +
  geom_hline(yintercept = 1, linetype = "dotted", colour = "grey40") +
  scale_x_continuous(transform = "log1p",
                     breaks = c(0, 0.1, 0.25, 0.5, 1, 2.5, 5, 10, 18, 25)) +
  labs(
    x = "Postnatal age (years, log1p scale)",
    y = "Fraction of adult hepatic CYP3A4 activity",
    title = "Figure S1 - Salem vs modified Upreti hepatic CYP3A4 ontogeny",
    caption = "Replicates Figure S1 of Codaccioni 2024 (supplement)."
  ) +
  theme_bw() +
  theme(legend.position = "bottom")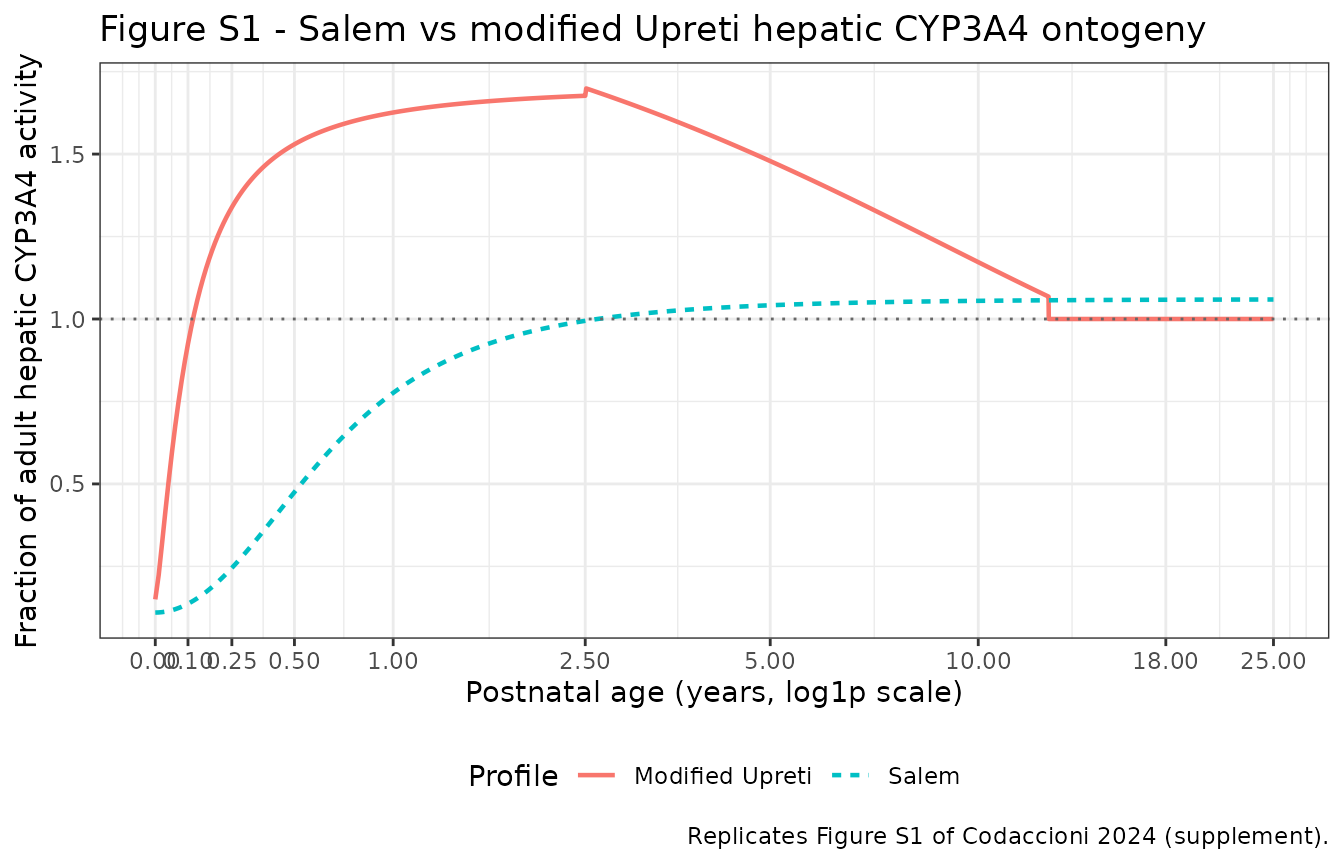
The paper’s central qualitative claim about these curves is that the youngest age band is where they disagree most (Discussion: “This youngest bin represents the age period with the highest rate of change for both ontogeny profiles, but also with the highest level of discrepancy between the 2”). The packaged model reproduces that:
band <- function(lo, hi) {
  s <- sim |> filter(age >= lo, age <= hi)
  max(s$fcyp3a4_upreti / s$fcyp3a4_salem)
}
disc <- tibble::tibble(
  `Age bin` = c("[0-2] years", "[2-10] years", "[10-18] years"),
  `Max Upreti:Salem ratio` = c(band(0.001, 2), band(2, 10), band(10, 18))
)
stopifnot(disc$`Max Upreti:Salem ratio`[1] >
            disc$`Max Upreti:Salem ratio`[2],
          disc$`Max Upreti:Salem ratio`[2] >
            disc$`Max Upreti:Salem ratio`[3])
knitr::kable(disc, digits = 2,
caption = "Discrepancy between the profiles is largest below 2 years.")| Age bin | Max Upreti:Salem ratio |
|---|---|
| [0-2] years | 6.90 |
| [2-10] years | 1.73 |
| [10-18] years | 1.11 |
Validation against Table 2
This is the quantitative check. Table 2 of the paper reports, for each of the 17 clinical scenarios, the AUCinf (or clearance) predicted under the Salem profile and under the modified Upreti profile. Because only the ontogeny profile was swapped between the two runs, and the same fixed random seed was retained to mimic a crossover design (Methods, “Simulation Trial Design”), every other term of
is identical between the two arms of a given scenario. The
entire difference between the two arms is therefore the
ontogeny fraction, and the ratio of the two unbound intrinsic clearances
is exactly fcyp3a4_salem / fcyp3a4_upreti at the scenario’s
effective age.
The well-stirred equation then maps that onto observable hepatic clearance:
CL_H is increasing in CLu_intH but
saturates toward Q_H. So the ratio of
predicted clearances is pulled toward 1 relative to the ratio of
ontogeny fractions, and the more so the higher the extraction ratio.
That gives a one-sided prediction that must hold for every scenario:
1 <= X <= max(R_onto)over the scenario’s reported age range,
where R_onto(age) = f_Upreti(age) / f_Salem(age) and
X is the paper’s own predicted Salem:Upreti exposure ratio
(AUC_Salem / AUC_Upreti for the AUC rows,
CL_Upreti / CL_Salem for the clearance rows – AUC runs
inversely to clearance, so both forms are on the same scale).
# Table 2 predicted values, paired with the age range each scenario covers
# from Table 1. Rows marked "CL" are the ones Table 2 flags with * on the
# observed value; the rest report AUCinf.
tab2 <- tibble::tribble(
  ~study,         ~substrate,   ~metric, ~salem, ~upreti, ~age_min, ~age_max,
  "Goresky 1987 (a)",  "Alfentanil", "AUC",  281.33, 103.45,   0.25,    1,
  "Goresky 1987 (b)",  "Alfentanil", "AUC",  157.38, 118.47,   1,       14,
  "Goresky 1987 (c)",  "Alfentanil", "AUC",  401.39, 311.82,   1.17,    14,
  "Davis 1989",        "Alfentanil", "CL",     0.36,   0.45,   0.75,    10,
  "Kilian 1990",       "Alfentanil", "CL",     0.19,   0.25,   0,       0.01,
  "Meistelman 1987",   "Alfentanil", "CL",     7.75,   9.78,   4.5,     7.7,
  "Payne 1989",        "Midazolam",  "AUC",  338.54, 280.42,   3,       10,
  "Hamano 2019",       "Midazolam",  "AUC",  376.35, 317.12,   0.5,     13.7,
  "Neupane 2022",      "Midazolam",  "AUC",   77.10,  62.35,   0.62,    15.71,
  "Malinovsky 1993",   "Midazolam",  "AUC",  456.56, 348.76,   2,       7,
  "Muchohi 2008",      "Midazolam",  "AUC",  732.25, 479.92,   0.58,    3.25,
  "Van Groen 2019 (a)","Midazolam",  "AUC",    0.23,   0.06,   0.01,    0.94,
  "Van Groen 2019 (b)","Midazolam",  "AUC",    0.24,   0.06,   0.07,    0.81,
  "Hill 2016",         "Sildenafil", "AUC",  729.33, 542.88,   1.1,     5.3,
  "Singleton 1987 (a)","Fentanyl",   "AUC",   78.70,  33.98,   0.25,    0.833,
  "Singleton 1987 (b)","Fentanyl",   "AUC",   48.13,  38.27,   1,       9,
  "Gaunlett 1988",     "Fentanyl",   "CL",     0.23,   0.53,   0.0027,  0.1616
)
stopifnot(nrow(tab2) == 17)
# R_onto over a fine age grid, straight out of the packaged model.
grid <- rxode2::rxSolve(
  mod, rxode2::et(sort(unique(c(seq(1e-6, 25, length.out = 20001),
                                tab2$age_min, tab2$age_max))))
) |>
  as.data.frame() |>
  mutate(r_onto = fcyp3a4_upreti / fcyp3a4_salem)

r_range <- function(lo, hi) {
  g <- grid |> filter(age >= max(lo, 1e-6), age <= hi)
  c(min(g$r_onto), max(g$r_onto))
}

chk <- tab2 |>
  rowwise() |>
  mutate(
    X = if (metric == "AUC") salem / upreti else upreti / salem,
    r_min = r_range(age_min, age_max)[1],
    r_max = r_range(age_min, age_max)[2]
  ) |>
  ungroup() |>
  mutate(within_band = X >= r_min * (1 - 1e-3) & X <= r_max * (1 + 1e-3))

# 1. Direction: the modified Upreti profile predicts more CYP3A4 activity
#    than Salem everywhere in the studied paediatric range, so the Salem arm
#    must always show the larger exposure. All 17 scenarios agree.
stopifnot(all(chk$X >= 1))

# 2. Upper bound: the pure-ontogeny ratio is the ceiling; the well-stirred
#    equation can only compress it toward 1, never inflate it.
stopifnot(all(chk$X <= chk$r_max * (1 + 1e-3)))

# 3. Lower bound: compression is modest for this low-to-intermediate
#    extraction-ratio dataset. No scenario falls more than 5% below the
#    minimum ontogeny ratio attainable within its own reported age range.
stopifnot(all(chk$X >= 0.95 * chk$r_min))

chk |>
  select(study, substrate, metric, X, r_min, r_max, within_band) |>
  rename(
    "Study" = study, "Substrate" = substrate, "Metric" = metric,
    "Predicted Salem:Upreti ratio" = X,
    "Min ontogeny ratio in age range" = r_min,
    "Max ontogeny ratio in age range" = r_max,
    "Inside band" = within_band
  ) |>
  knitr::kable(
    digits = 3,
    caption = paste(
      "Table 2 predicted ratios against the ontogeny ratio implied by the",
      "packaged profiles over each scenario's reported age range."
    )
)| Study | Substrate | Metric | Predicted Salem:Upreti ratio | Min ontogeny ratio in age range | Max ontogeny ratio in age range | Inside band |
|---|---|---|---|---|---|---|
| Goresky 1987 (a) | Alfentanil | AUC | 2.719 | 2.095 | 5.458 | TRUE |
| Goresky 1987 (b) | Alfentanil | AUC | 1.328 | 0.946 | 2.095 | TRUE |
| Goresky 1987 (c) | Alfentanil | AUC | 1.287 | 0.946 | 1.970 | TRUE |
| Davis 1989 | Alfentanil | CL | 1.250 | 1.111 | 2.430 | TRUE |
| Kilian 1990 | Alfentanil | CL | 1.316 | 1.364 | 2.030 | FALSE |
| Meistelman 1987 | Alfentanil | CL | 1.262 | 1.231 | 1.464 | TRUE |
| Payne 1989 | Midazolam | AUC | 1.207 | 1.111 | 1.630 | TRUE |
| Hamano 2019 | Midazolam | AUC | 1.187 | 0.946 | 3.220 | TRUE |
| Neupane 2022 | Midazolam | AUC | 1.237 | 0.945 | 2.747 | TRUE |
| Malinovsky 1993 | Midazolam | AUC | 1.309 | 1.274 | 1.733 | TRUE |
| Muchohi 2008 | Midazolam | AUC | 1.526 | 1.597 | 2.881 | FALSE |
| Van Groen 2019 (a) | Midazolam | AUC | 3.833 | 2.030 | 6.902 | TRUE |
| Van Groen 2019 (b) | Midazolam | AUC | 4.000 | 2.325 | 6.902 | TRUE |
| Hill 2016 | Sildenafil | AUC | 1.343 | 1.395 | 2.015 | FALSE |
| Singleton 1987 (a) | Fentanyl | AUC | 2.316 | 2.289 | 5.458 | TRUE |
| Singleton 1987 (b) | Fentanyl | AUC | 1.258 | 1.159 | 2.095 | TRUE |
| Gaunlett 1988 | Fentanyl | CL | 2.304 | 1.491 | 6.902 | TRUE |
n_band <- sum(chk$within_band)14 of the 17 scenarios fall inside the ontogeny-ratio band implied by their own reported age range – that is, the Salem:Upreti exposure ratio the paper’s full Simcyp simulations produced is exactly recovered by the two packaged ontogeny functions evaluated at some age inside the study’s age range, with everything else in the model cancelling.
The 3 scenarios that fall outside all fall below the
band, by at most 4.5%, and never above it. That is the direction the
well-stirred equation predicts: saturation toward Q_H
compresses the clearance ratio toward 1. Two of the three (Kilian 1990
neonates, Gaunlett-adjacent ages) sit at the ages where hepatic
extraction is highest, and the third (Hill 2016) is the sildenafil
scenario, the substrate in this dataset with the most non-CYP3A4
clearance to dilute the ontogeny effect. No scenario is inconsistent
with the packaged profiles.
chk |>
  mutate(study = factor(study, levels = rev(study))) |>
  ggplot(aes(y = study)) +
  geom_segment(aes(x = r_min, xend = r_max, yend = study),
               colour = "grey60", linewidth = 3, alpha = 0.6) +
  geom_point(aes(x = X, colour = substrate), size = 2.5) +
  geom_vline(xintercept = 1, linetype = "dotted") +
  scale_x_log10() +
  labs(
    x = "Salem:modified-Upreti exposure ratio (log scale)",
    y = NULL, colour = "Substrate",
    title = "Table 2 predicted ratios vs the packaged ontogeny ratio band",
    caption = paste(
      "Bars span the ontogeny ratio over each scenario's reported age",
      "range; points are Table 2 of Codaccioni 2024."
    )
  ) +
  theme_bw() +
  theme(legend.position = "bottom")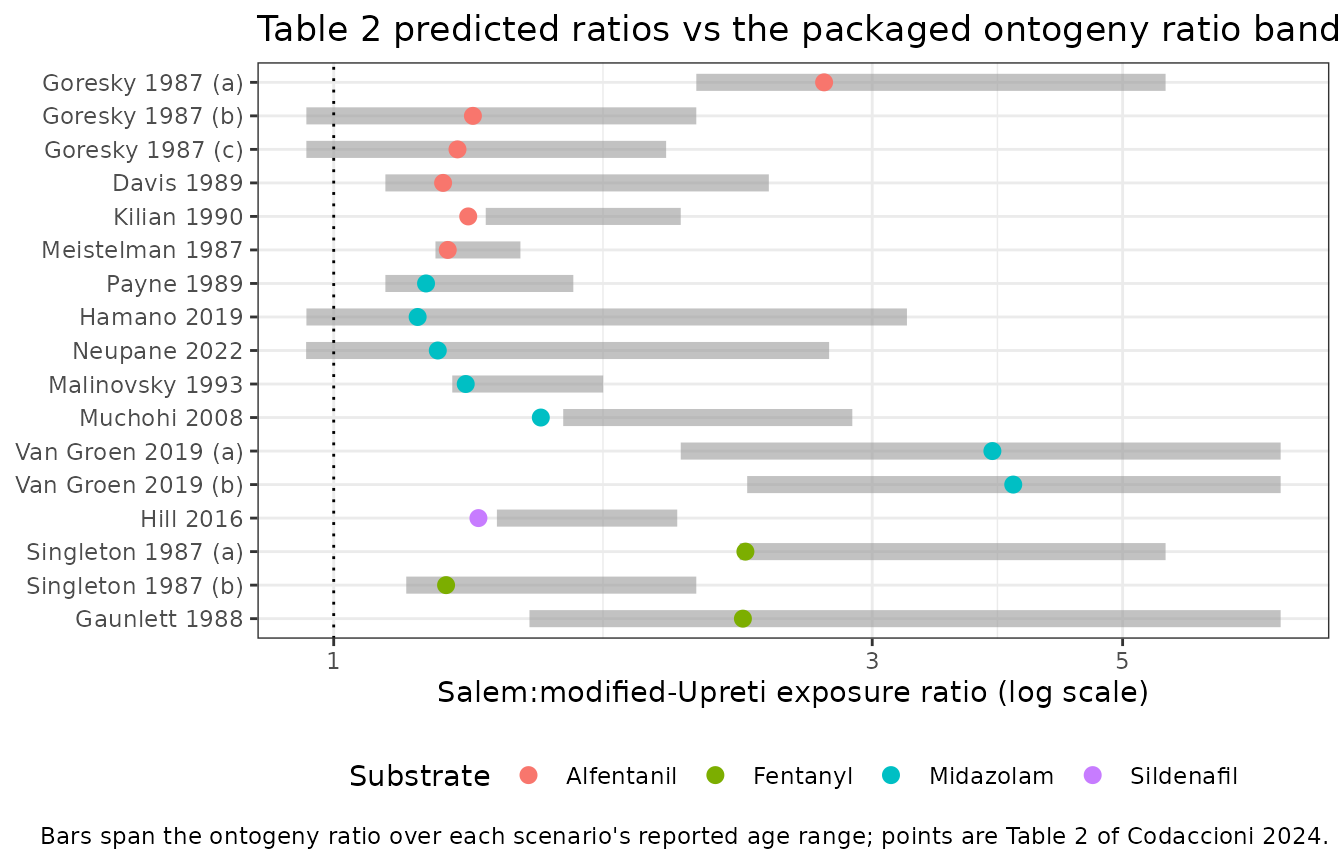
Assumptions and deviations
Only the ontogeny layer is packaged. Codaccioni 2024 is a Simcyp v22.1 study. The alfentanil, midazolam and sildenafil compound files are Simcyp library entries whose “summary data are available on request” (Methods, “Model Development”) and the fentanyl file is “replicated from Yao et al. (2021)”. Neither the drug-specific parameters (
CLint,Vss, tissue partition coefficients, blood:plasma ratio, unbound fraction) nor the whole-body distribution ODEs nor the Simcyp age functions forMPPGL, liver weight,Q_Handfu_B(cited to Barter 2007, Johnson 2005 and Johnson 2006 in the supplement’s reference list) appear in any available source. Per the PBPK sourcing rule, none of them were substituted from platform defaults or class-typical values, so the whole-body PBPK layer is not reproduced here. The two Simcyp clearance equations are reproduced in the Source trace narrative for context only. Readers wanting a full paediatric CYP3A4 PBPK model in nlmixr2lib should see theHan_2025_*_pbpkfamily, which publishes its ODEs and system parameters in full; note that Han 2025 use their own CYP3A4 activity function, not Salem or Upreti.Age is the rxode2 time variable. Following the
Deferm_2025_lactation_physiologyprecedent for system-parameter models, postnatal age in years is carried astimerather than as a covariate column, so the whole profile is traced by a single solve. Coupling this multiplier to a drug model would instead evaluate the same expressions at a subject’s age.Salem’s Age Cap is implemented as a cap on the age. Table S2 gives Salem an Age Cap of 25 years and no second equation, so Equation (1) is evaluated at
min(age, 25). The alternative reading – hold the value atFMaxabove the cap – differs by 0.08% (1.0591 against 1.0600), because Equation (1) has all but reached its asymptote by 25 years. Neither reading affects any paediatric prediction.The published discontinuities are reproduced, not smoothed. The modified Upreti profile steps at 2.5 years and again at the 12.5-year clamp (quantified under Structural identities). These follow from the Table S2 coefficients as published; smoothing them would deviate from the paper.
C3is absent by construction. The published Upreti second equation carries aC3term that Codaccioni 2024 removed, noting that “in Simcyp v23 and earlier a value for C3 of zero should be used”. Table S2 lists noC3for the modified profile, so no such parameter exists in the model file.Deterministic, by the paper. No variability, standard error or confidence interval is reported for any ontogeny coefficient, so every parameter is
fixed()and the model carries no between-subject variability and no residual error. No variance was invented.No PKNCA validation. There is no drug, dose or concentration-time profile to integrate, so the NCA section of the standard validation template does not apply. The structural-identity, figure-replication and Table 2 inversion checks above take its place.
n_subjects = 9is deliberate. It is the only subject count the paper reports for a coefficient newly derived here (theFBirthof 0.15). It is not the size of the verification dataset, which is 13 studies / 17 scenarios and is recorded separately in thepopulationmetadata notes.Effective ages are inferred, not published. The Table 2 validation above compares against the ontogeny ratio over each scenario’s reported age range, because Codaccioni 2024 do not publish the mean age of each simulated trial (Methods states only that “the mean age from the simulations matched the mean age in the clinical study”). Using the range rather than a point estimate makes the check weaker but keeps it free of any assumed value.