Trofinetide (Darwish 2025)
Source:vignettes/articles/Darwish_2025_trofinetide.Rmd
Darwish_2025_trofinetide.RmdModel and source
- Citation: Darwish M, Passarell J, Maxwell K, Youakim JM, Bradley H, Bishop KM. Population Pharmacokinetic Modeling to Support Trofinetide Dosing for the Treatment of Rett Syndrome. Advances in Therapy. 2025;42(2):1026-1043. doi:10.1007/s12325-024-03056-9
- Description: Population PK model for oral trofinetide in Rett syndrome (Darwish 2025): two-compartment with first-order absorption and linear elimination, pooled across healthy volunteers and patients with Rett syndrome, fragile X syndrome, or traumatic brain injury.
- Article: Adv Ther. 2025;42(2):1026-1043
Trofinetide is the first approved treatment for Rett syndrome (RTT). It is dosed orally twice daily using a body-weight-banded regimen. This vignette reproduces the updated population pharmacokinetic model that Acadia and Simulations Plus used to confirm that the weight-banded regimen employed in the phase 3 LAVENDER study delivers steady-state exposure inside the target range.
Population
The analysis dataset pooled 5595 trofinetide whole-blood concentrations from 442 subjects across 13 clinical studies: eight phase 1 studies (five in healthy volunteers), four phase 2 studies in RTT, fragile X syndrome (FXS), and traumatic brain injury (TBI), and the phase 3 LAVENDER study. The pooled cohort comprised 156 healthy adult volunteers, 185 patients with RTT (female only), 44 patients with FXS (male only), and 57 patients with TBI, aged 5-64 years (median 21) and weighing 13-140 kg (median 62.2). Trofinetide was given orally, by gastric tube, and intravenously; concentrations were measured by LC-MS/MS in lithium-heparinized whole blood with a lower limit of quantitation of 0.10 ug/mL.
The LAVENDER subset used for the exposure confirmation comprised 92 girls and women aged 5-20 years with RTT, whose median body weight was 30.1 kg. The target steady-state exposure window was an AUC over a 12 h dosing interval (AUC0-12) of 800-1200 ugh/mL, with a median target of 1000 ugh/mL.
The same information is available programmatically via the model’s
population metadata:
str(mod_meta$population)
#> List of 11
#>  $ species       : chr "human"
#>  $ n_subjects    : num 442
#>  $ n_observations: num 5595
#>  $ n_studies     : num 13
#>  $ age_range     : chr "5-64 years (median 21)"
#>  $ weight_range  : chr "13-140 kg (median 62.2)"
#>  $ gfr_reference : chr "124 mL/min/1.73 m^2 (analysis-population median)"
#>  $ disease_state : chr "Pooled analysis of 156 healthy adult volunteers, 185 patients with Rett syndrome (female only), 44 patients wit"| __truncated__
#>  $ dose_range    : chr "Oral, gastric-tube, and intravenous (bolus and infusion) trofinetide; oral doses spanned the 6-12 g therapeutic"| __truncated__
#>  $ regions       : chr "Not reported"
#>  $ notes         : chr "Darwish 2025 Results, 'Population Pharmacokinetic Model'. Pooled across eight phase 1 studies (five in healthy "| __truncated__
Source trace
Every value below is transcribed from Darwish 2025. Table 2 holds the final parameter estimates; the typical-value equations for F1, ka, CL, Vc, and Vp are printed in the Results section (“Population Pharmacokinetic Model”). The reference values 58 kg, 22.4 years, and 124 mL/min/1.73 m^2 are the analysis population medians, per the Table 2 footnote.
| Equation / parameter | Value | Source location |
|---|---|---|
lcl (CL) |
11.8 L/h | Table 2, “Central clearance” |
e_wt_cl |
0.443 | Table 2, “Exponent of (WTKG/58) for CL” |
e_crcl_cl |
0.273 | Table 2, “Exponent of (GFR/124) for CL” |
e_rett_cl |
-0.169 | Table 2, “Proportional shift in CL for Rett = 1” |
e_tbi_cl |
0.235 | Table 2, “Proportional shift in CL for TBI = 1” |
lvc (Vc) |
24.9 L | Table 2, “Central volume of distribution” |
e_age_vc |
0.549 | Table 2, “Exponent of (AGE/22.4) for Vc” |
e_fxs_vc |
1.15 | Table 2, “Proportional shift in Vc for FXS = 1” |
lq (Q) |
1.44 L/h | Table 2, “Intercompartmental clearance” |
lvp (Vp) |
35.3 L | Table 2, “Peripheral volume of distribution” |
e_rett_vp |
0.616 | Table 2, “Proportional shift in Vp for Rett = 1” |
e_tbi_vp |
-0.752 | Table 2, “Proportional shift in Vp for TBI = 1” |
lka (ka) |
0.391 1/h | Table 2, “First-order absorption rate constant” |
e_fed_ka |
-0.0949 | Table 2, “Shift in ka for FED” |
lfdepot (F1) |
0.828 | Table 2, “Oral bioavailability” |
e_fed_f |
-0.133 | Table 2, “Shift in F1 for FED” |
e_dose18g_f |
-0.132 | Table 2, “Shift in F1 for 18-g dose” |
e_dose24g_f |
-0.284 | Table 2, “Shift in F1 for 24-g dose” |
e_diarrhea_f |
-0.148 | Table 2, “Shift in F1 for Diarrhea” |
etalcl |
13.6 %CV | Table 2, IIV column for CL; omega^2 = log(1 + CV^2) per
Methods Eq. (1) |
etalvc |
30.8 %CV | Table 2, IIV column for Vc |
etalq |
64.4 %CV | Table 2, IIV column for Q |
etalvp |
28.2 %CV | Table 2, IIV column for Vp |
etalfdepot |
20.8 %CV | Table 2, IIV column for F1 |
expSdHealthy |
sqrt(0.0789) = 0.281 | Table 2, “Residual variability healthy subjects”; reported as 28.1 %CV |
expSdDisease |
sqrt(0.137) = 0.370 | Table 2, “Residual variability subjects with Rett syndrome, TBI, or FXS”; reported as 37.0 %CV |
| Structural model (2-cmt, first-order absorption, linear elimination) | n/a | Results, “Population Pharmacokinetic Model”, first paragraph |
Proportional-shift form (1 + theta * indicator)
|
n/a | Results typical-value equations for F1, ka, CL, Vc, Vp |
| Log/exponential residual error | n/a | Methods Eq. (2) |
Two transcription points are worth spelling out because the table alone is ambiguous.
The residual-error column holds variances, not standard
deviations. The Table 2 “Population mean” entries for residual
variability are 0.0789 and 0.137, while the adjacent column reports 28.1
%CV and 37.0 %CV. Since sqrt(0.0789) = 0.281 and
sqrt(0.137) = 0.370 reproduce those %CV values exactly, the
tabulated numbers are the NONMEM $SIGMA variances and the
%CV column is the log-scale SD. lnorm() takes an SD, so the
model file enters sqrt(0.0789) and
sqrt(0.137).
The IIV column uses the exponential-model %CV.
Methods Eq. (1) defines %CV = sqrt(exp(omega^2) - 1) * 100,
so the model file inverts it as omega^2 = log(1 + CV^2).
For Q this matters: 64.4 %CV gives omega = 0.589 rather
than 0.644.
ui <- mod_meta
ui$iniDf[, c("name", "est", "label")] |>
  dplyr::rename("Parameter" = name, "Estimate" = est, "Label" = label) |>
knitr::kable(digits = 4, caption = "Packaged model parameters.")| Parameter | Estimate | Label |
|---|---|---|
| lcl | 2.4681 | Clearance at the reference covariate values (L/h) |
| e_wt_cl | 0.4430 | Power exponent on (WT/58) for clearance (unitless) |
| e_crcl_cl | 0.2730 | Power exponent on (CRCL/124) for clearance (unitless) |
| e_rett_cl | -0.1690 | Proportional shift in clearance for Rett syndrome (fraction) |
| e_tbi_cl | 0.2350 | Proportional shift in clearance for traumatic brain injury (fraction) |
| lvc | 3.2149 | Central volume of distribution at the reference age (L) |
| e_age_vc | 0.5490 | Power exponent on (AGE/22.4) for central volume (unitless) |
| e_fxs_vc | 1.1500 | Proportional shift in central volume for fragile X syndrome (fraction) |
| lq | 0.3646 | Intercompartmental clearance (L/h) |
| lvp | 3.5639 | Peripheral volume of distribution (L) |
| e_rett_vp | 0.6160 | Proportional shift in peripheral volume for Rett syndrome (fraction) |
| e_tbi_vp | -0.7520 | Proportional shift in peripheral volume for traumatic brain injury (fraction) |
| lka | -0.9390 | First-order absorption rate constant in the fasted state (1/h) |
| e_fed_ka | -0.0949 | Proportional shift in ka for the fed state (fraction) |
| lfdepot | -0.1887 | Oral bioavailability in the fasted, therapeutic-dose, diarrhea-free reference state (fraction) |
| e_fed_f | -0.1330 | Proportional shift in bioavailability for the fed state (fraction) |
| e_dose18g_f | -0.1320 | Proportional shift in bioavailability for the 18 g dose level (fraction) |
| e_dose24g_f | -0.2840 | Proportional shift in bioavailability for the 24 g dose level (fraction) |
| e_diarrhea_f | -0.1480 | Proportional shift in bioavailability during diarrhea (fraction) |
| expSdHealthy | 0.2809 | Log-scale residual SD, healthy subjects (log units) |
| expSdDisease | 0.3701 | Log-scale residual SD, subjects with Rett syndrome, TBI, or FXS (log units) |
| etalcl | 0.0183 | Table 2: CL 13.6 %CV (RSE 17.4%; eta-shrinkage 37.1%) |
| etalvc | 0.0906 | Table 2: Vc 30.8 %CV (RSE 12.8%; eta-shrinkage 31.4%) |
| etalq | 0.3469 | Table 2: Q 64.4 %CV (RSE 18.5%; eta-shrinkage 9.5%) |
| etalvp | 0.0765 | Table 2: Vp 28.2 %CV (RSE 14.6%; eta-shrinkage 39.8%) |
| etalfdepot | 0.0424 | Table 2: F1 20.8 %CV (RSE 15.7%; eta-shrinkage 55.0%) |
Virtual cohort
Original observed data are not publicly available (Darwish 2025 Data Availability). The cohorts below approximate the LAVENDER population: girls and women aged 5-20 years with RTT, dosed twice daily on the four weight bands used in that study.
Darwish 2025 does not publish the joint distribution of weight, age, and GFR within each weight band, so the age-for-weight mapping below is an explicit assumption (documented under “Assumptions and deviations”). Following the paper’s own covariate simulations, all subjects are fasted, free of diarrhea, and on therapeutic (not supratherapeutic) doses.
tau <- 12 # h, BID dosing interval

bands <- tibble::tribble(
  ~band,          ~wt_lo, ~wt_hi, ~dose_g,
  "12-20 kg",       12,     20,      6,
  "20-35 kg",       20,     35,      8,
  "35-50 kg",       35,     50,     10,
  ">50 kg",         50,     80,     12
) |>
  dplyr::mutate(amt_mg = dose_g * 1000)

# Keep `band` a plain character column everywhere (rxSolve `keep=`, PKNCA
# grouping, and the joins below are all type-sensitive); apply the display
# ordering only at plotting time.
band_levels <- bands$band

# Assumed weight-to-age mapping for girls/women with RTT enrolled in LAVENDER
# (5-20 years). Monotone interpolation through plausible anchor points; see
# "Assumptions and deviations".
wt_to_age <- function(wt) {
  stats::approx(
    x = c(12, 20, 30, 40, 50, 80),
    y = c(5, 7, 10, 13, 16, 20),
    xout = wt, rule = 2
  )$y
}
set.seed(20250218)
n_per_band <- 100L # well under the 200/arm cap

make_cohort <- function(band_row, n, id_offset) {
  subj <- tibble::tibble(
    id = id_offset + seq_len(n),
    band = band_row$band,
    amt_mg = band_row$amt_mg,
    WT = stats::runif(n, band_row$wt_lo, band_row$wt_hi),
    CRCL = pmin(pmax(stats::rnorm(n, 124, 20), 80), 180),
    DIS_RETT = 1, DIS_TBI = 0, DIS_FXS = 0,
    FED = 0, AE_DIARRHEA = 0, DOSE_18G = 0, DOSE_24G = 0
  ) |>
    dplyr::mutate(AGE = wt_to_age(WT))

  # Steady-state dose record (ss = 1 with ii = tau establishes steady state
  # directly; trofinetide's terminal half-life is long relative to the 12 h
  # interval, so an explicit multiple-dose run would need ~2 weeks of doses).
  dosing <- subj |>
    dplyr::mutate(time = 0, amt = amt_mg, evid = 1L, cmt = "depot",
                  ii = tau, ss = 1L)

  obs <- subj |>
    tidyr::crossing(time = seq(0, tau, by = 0.25)) |>
    dplyr::mutate(amt = NA_real_, evid = 0L, cmt = "central",
                  ii = 0, ss = 0L)

  dplyr::bind_rows(dosing, obs) |>
    dplyr::arrange(id, time, dplyr::desc(evid))
}

events <- dplyr::bind_rows(
  lapply(seq_len(nrow(bands)), function(i) {
    make_cohort(bands[i, ], n_per_band, id_offset = (i - 1L) * n_per_band)
  })
)

stopifnot(!anyDuplicated(events[, c("id", "time", "evid")]))
stopifnot(nrow(dplyr::distinct(events, id)) == n_per_band * nrow(bands))
Simulation
mod <- readModelDb("Darwish_2025_trofinetide")

sim <- rxode2::rxSolve(
  mod,
  events = events,
  keep = c("band", "amt_mg")
) |>
  as.data.frame() |>
  # rxSolve returns observation records only (there is no `evid` column in the
  # output) and may return `band` as a factor; keep it character so the joins
  # against the PKNCA results below are type-stable.
  dplyr::mutate(band = as.character(band))
#> ℹ parameter labels from comments will be replaced by 'label()'

stopifnot(!anyNA(sim$Cc), nrow(sim) > 0)
Replicating Figure 4: steady-state concentration-time profiles
Figure 4 of Darwish 2025 overlays individual model-based steady-state
profiles against the average curves corresponding to the 800, 1000, and
1200 ug*h/mL target exposures. Those reference curves are, by
construction, flat average concentrations of
AUC0-12 / 12.
target_lines <- tibble::tibble(
  label = c("AUC0-12 = 800", "AUC0-12 = 1000", "AUC0-12 = 1200"),
  cav = c(800, 1000, 1200) / tau
)

sim |>
  dplyr::mutate(band = factor(band, levels = band_levels)) |>
  dplyr::group_by(band, time) |>
  dplyr::summarise(
    Q05 = stats::quantile(Cc, 0.05, na.rm = TRUE),
    Q50 = stats::quantile(Cc, 0.50, na.rm = TRUE),
    Q95 = stats::quantile(Cc, 0.95, na.rm = TRUE),
    .groups = "drop"
  ) |>
  ggplot(aes(time, Q50)) +
  geom_ribbon(aes(ymin = Q05, ymax = Q95), alpha = 0.25) +
  geom_line(linewidth = 0.8) +
  geom_hline(data = target_lines, aes(yintercept = cav, colour = label),
             linetype = "dashed") +
  facet_wrap(~band) +
  labs(
    x = "Time since dose (h)", y = "Trofinetide whole blood (ug/mL)",
    colour = NULL,
    title = "Steady-state profiles by LAVENDER weight band",
    caption = "Replicates Figure 4 of Darwish 2025 (median with 5th-95th percentile band)."
  ) +
  theme(legend.position = "bottom")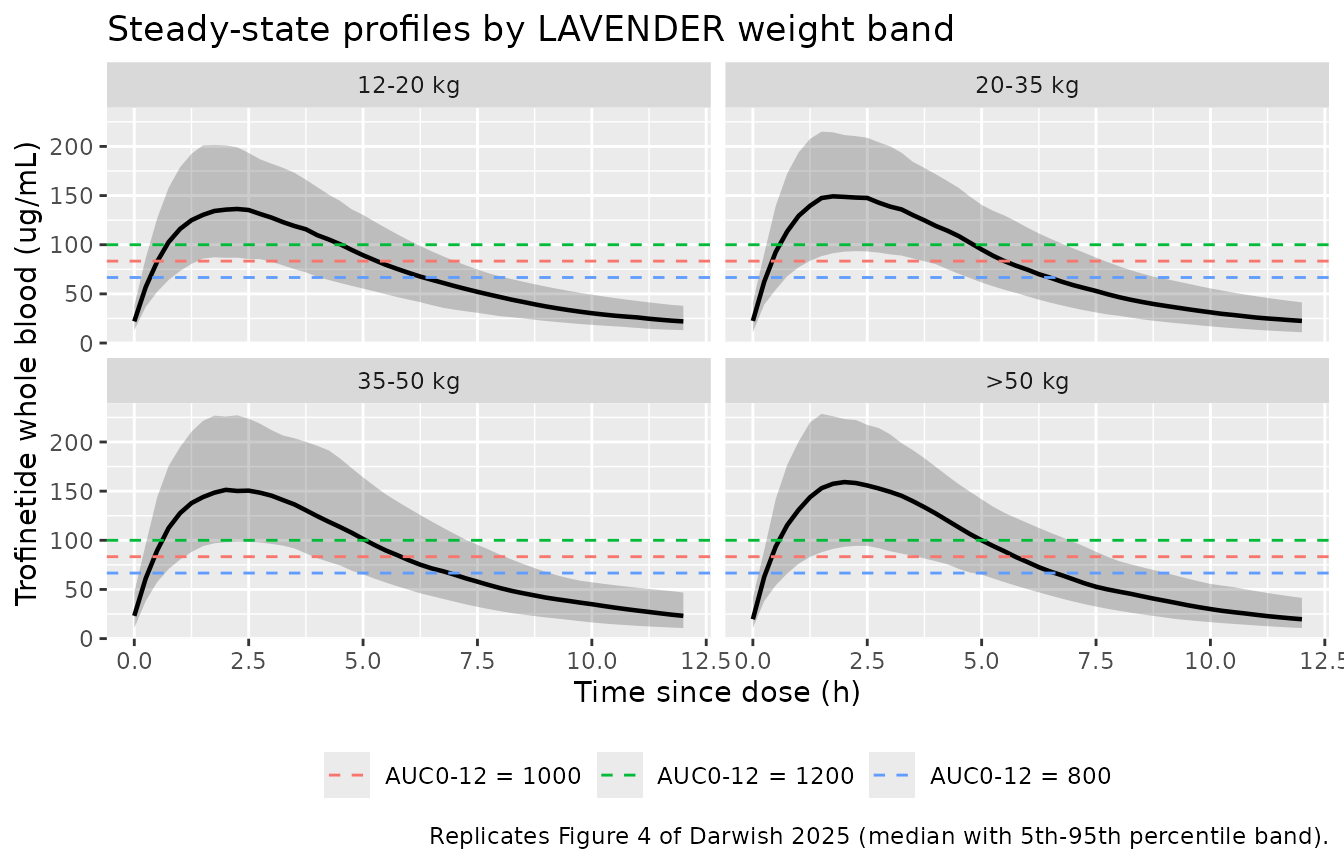
PKNCA validation
sim_nca <- sim |>
  dplyr::filter(!is.na(Cc)) |>
  dplyr::select(id, time, Cc, band)

# Guarantee a time = 0 record per (id, band). The ss = 1 dose means the
# time = 0 concentration is the steady-state trough, which the solve already
# produces; this bind_rows is a defensive no-op that `distinct()` collapses.
sim_nca <- dplyr::bind_rows(
  sim_nca,
  sim_nca |> dplyr::distinct(id, band) |> dplyr::mutate(time = 0, Cc = 0)
) |>
  dplyr::distinct(id, band, time, .keep_all = TRUE) |>
  dplyr::arrange(id, band, time)

conc_obj <- PKNCA::PKNCAconc(
  sim_nca, Cc ~ time | band + id,
  concu = "ug/mL", timeu = "h"
)

dose_df <- events |>
  dplyr::filter(evid == 1) |>
  dplyr::select(id, time, amt, band)

dose_obj <- PKNCA::PKNCAdose(dose_df, amt ~ time | band + id, doseu = "mg")

intervals <- data.frame(
  start = 0, end = tau,
  cmax = TRUE, tmax = TRUE, cmin = TRUE, auclast = TRUE, cav = TRUE
)

nca_res <- PKNCA::pk.nca(PKNCA::PKNCAdata(conc_obj, dose_obj, intervals = intervals))
Comparison against the published steady-state exposures
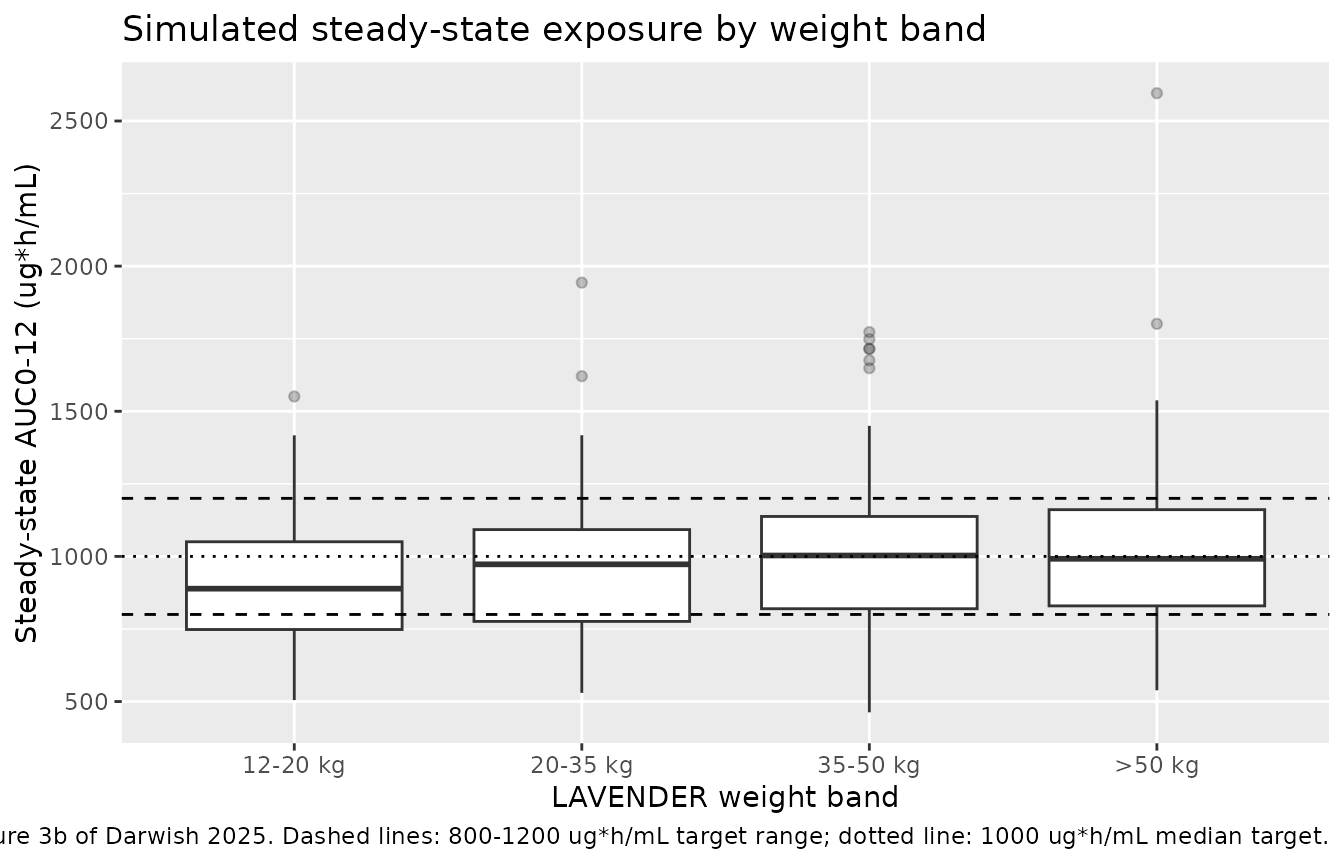
Darwish 2025 reports median steady-state AUC0-12 values of 968.8, 889.0, 850.7, and 839.6 ug*h/mL for the four weight bands (Results, “Exposure Estimation”). Those are medians of individual empiric Bayesian estimates from the observed LAVENDER data, so they carry the study’s actual weight distribution, diarrhea occurrence, and dosing-interval variability, none of which are published.
published <- tibble::tribble(
  ~band,        ~auclast,
  "12-20 kg",   968.8,
  "20-35 kg",   889.0,
  "35-50 kg",   850.7,
  ">50 kg",     839.6
)

cmp <- nlmixr2lib::ncaComparisonTable(
  simulated = nca_res,
  reference = published,
  by = "band",
  units = c(auclast = "ug*h/mL"),
  tolerance_pct = 20
)

knitr::kable(
  cmp,
  caption = "Simulated median steady-state AUC0-12 vs. Darwish 2025 Results. * differs from reference by >20%.",
  align = c("l", "l", "r", "r", "r")
)| NCA parameter | band | Reference | Simulated | % diff |
|---|---|---|---|---|
| AUClast (ug*h/mL) | 12-20 kg | 969 | 889 | -8.3% |
| AUClast (ug*h/mL) | 20-35 kg | 889 | 973 | +9.4% |
| AUClast (ug*h/mL) | 35-50 kg | 851 | 1000 | +17.9% |
| AUClast (ug*h/mL) | >50 kg | 840 | 992 | +18.1% |
attr(cmp, "footnote")
#> NULL
Closed-form clearance gate
At steady state the exposure over a dosing interval reduces to
AUC0-tau = F1 * Dose / CL, independent of the distribution
parameters. This is a strong structural check: it exercises the weight
and disease-state covariate terms on CL and the bioavailability chain,
and it must agree with the numerically integrated PKNCA result.
th <- setNames(ui$iniDf$est, ui$iniDf$name)

cl_typical <- function(WT, CRCL, DIS_RETT = 1, DIS_TBI = 0) {
  exp(th[["lcl"]]) * (WT / 58)^th[["e_wt_cl"]] * (CRCL / 124)^th[["e_crcl_cl"]] *
    (1 + th[["e_tbi_cl"]] * DIS_TBI) * (1 + th[["e_rett_cl"]] * DIS_RETT)
}

per_subject <- sim |>
  dplyr::distinct(id, band, WT, CRCL, amt_mg) |>
  dplyr::mutate(
    cl = cl_typical(WT, CRCL),
    auc_closed_form = exp(th[["lfdepot"]]) * amt_mg / cl
  )

nca_auc <- as.data.frame(nca_res) |>
  dplyr::filter(PPTESTCD == "auclast") |>
  dplyr::select(id, band, auc_pknca = PPORRES) |>
  dplyr::mutate(band = as.character(band))
stopifnot(nrow(nca_auc) == n_per_band * nrow(bands))

gate <- per_subject |>
  dplyr::inner_join(nca_auc, by = c("id", "band")) |>
  dplyr::group_by(band) |>
  dplyr::summarise(
    `Closed form F1*Dose/CL` = stats::median(auc_closed_form),
    `PKNCA AUC0-12` = stats::median(auc_pknca),
    .groups = "drop"
  ) |>
  dplyr::mutate(`% diff` = 100 * (`PKNCA AUC0-12` - `Closed form F1*Dose/CL`) /
                  `Closed form F1*Dose/CL`)

knitr::kable(gate, digits = 1,
caption = "Median closed-form vs. numerically integrated steady-state AUC0-12.")| band | Closed form F1*Dose/CL | PKNCA AUC0-12 | % diff |
|---|---|---|---|
| 12-20 kg | 884.6 | 888.9 | 0.5 |
| 20-35 kg | 954.9 | 972.7 | 1.9 |
| 35-50 kg | 981.5 | 1003.1 | 2.2 |
| >50 kg | 960.1 | 991.7 | 3.3 |
# The closed-form identity is exact for the typical-value CL; the simulated
# subjects additionally carry IIV on CL and F1, so medians agree closely but
# not exactly. A discrepancy beyond 10% would indicate a structural error.
stopifnot(nrow(gate) == nrow(bands))
stopifnot(all(abs(gate$`% diff`) < 10))
Replicating Figure 3: distribution against the target window
auc_by_subject <- nca_auc |>
  dplyr::mutate(band = factor(band, levels = band_levels))

ggplot(auc_by_subject, aes(band, auc_pknca)) +
  geom_boxplot(outlier.alpha = 0.3) +
  geom_hline(yintercept = c(800, 1200), linetype = "dashed") +
  geom_hline(yintercept = 1000, linetype = "dotted") +
  labs(
    x = "LAVENDER weight band", y = "Steady-state AUC0-12 (ug*h/mL)",
    title = "Simulated steady-state exposure by weight band",
    caption = "Replicates Figure 3b of Darwish 2025. Dashed lines: 800-1200 ug*h/mL target range; dotted line: 1000 ug*h/mL median target."
  )
auc_by_subject |>
  dplyr::group_by(band) |>
  dplyr::summarise(
    N = dplyr::n(),
    `Median AUC0-12` = stats::median(auc_pknca),
    `Q1` = stats::quantile(auc_pknca, 0.25),
    `Q3` = stats::quantile(auc_pknca, 0.75),
    `% within 800-1200` = 100 * mean(auc_pknca >= 800 & auc_pknca <= 1200),
    .groups = "drop"
  ) |>
  knitr::kable(digits = 1,
caption = "Simulated steady-state AUC0-12 by weight band.")| band | N | Median AUC0-12 | Q1 | Q3 | % within 800-1200 |
|---|---|---|---|---|---|
| 12-20 kg | 100 | 888.9 | 748.1 | 1050.4 | 56 |
| 20-35 kg | 100 | 972.7 | 776.1 | 1092.3 | 54 |
| 35-50 kg | 100 | 1003.1 | 819.8 | 1137.6 | 58 |
| >50 kg | 100 | 991.7 | 829.6 | 1161.0 | 60 |
Covariate impact (Figure 5)
Figure 5 of Darwish 2025 presents geometric mean ratios of steady-state exposure for GFR, disease indication, age, body weight, and diarrhea occurrence, and concludes that none of them is clinically meaningful because every 90% CI falls inside the 0.8-1.25 bioequivalence bounds.
Because steady-state AUC over a dosing interval depends only on
F1 and CL, the model-implied point estimates
for the AUC geometric mean ratios are available in closed form. The
check below confirms each one lands inside the bioequivalence window,
reproducing the paper’s conclusion.
gmr <- tibble::tribble(
  ~Covariate,                            ~`GMR (AUC0-12)`,
  "Rett syndrome vs. healthy",           1 / (1 + th[["e_rett_cl"]]),
  "TBI vs. healthy",                     1 / (1 + th[["e_tbi_cl"]]),
  "Fragile X syndrome vs. healthy",      1,
  "Diarrhea vs. none",                   1 + th[["e_diarrhea_f"]],
  "Fed vs. fasted",                      1 + th[["e_fed_f"]],
  "GFR 80 vs. 124 mL/min/1.73 m^2",      (80 / 124)^-th[["e_crcl_cl"]],
  "GFR 160 vs. 124 mL/min/1.73 m^2",     (160 / 124)^-th[["e_crcl_cl"]]
) |>
  dplyr::mutate(`Within 0.8-1.25` = ifelse(
    `GMR (AUC0-12)` >= 0.8 & `GMR (AUC0-12)` <= 1.25, "yes", "NO"))

knitr::kable(gmr, digits = 3,
caption = "Model-implied steady-state AUC0-12 geometric mean ratios. Replicates the point estimates underlying Figure 5 of Darwish 2025.")| Covariate | GMR (AUC0-12) | Within 0.8-1.25 |
|---|---|---|
| Rett syndrome vs. healthy | 1.203 | yes |
| TBI vs. healthy | 0.810 | yes |
| Fragile X syndrome vs. healthy | 1.000 | yes |
| Diarrhea vs. none | 0.852 | yes |
| Fed vs. fasted | 0.867 | yes |
| GFR 80 vs. 124 mL/min/1.73 m^2 | 1.127 | yes |
| GFR 160 vs. 124 mL/min/1.73 m^2 | 0.933 | yes |
# Darwish 2025 Results / Discussion: no covariate had a clinically meaningful
# impact, i.e. every geometric mean ratio sat inside the 0.8-1.25 bounds.
stopifnot(nrow(gmr) == 7L)
stopifnot(all(gmr$`Within 0.8-1.25` == "yes"))
Fragile X syndrome scales only the central volume, so it leaves steady-state AUC untouched and moves Cmax alone; the paper likewise shows an AUC ratio of essentially 1 for FXS in Figure 5b.
Assumptions and deviations
- Age-for-weight mapping. Darwish 2025 reports each covariate’s marginal distribution but not the joint weight/age/GFR distribution within a weight band. The virtual cohort maps weight to age by monotone interpolation through (12 kg, 5 y), (20, 7), (30, 10), (40, 13), (50, 16), (80, 20), chosen to span the LAVENDER eligibility window of 5-20 years while placing the RTT median weight of 30.1 kg near age 10. Age enters only the central volume, so this assumption affects Cmax and the shape of the profile but not steady-state AUC.
- GFR distribution. Simulated as Normal(124, 20) truncated to 80-180 mL/min/1.73 m^2, centered on the analysis-population median of 124. The paper reports GFR only as quintiles in the Figure 5a forest plot.
- Weight within a band. Sampled uniformly across the band. The open-ended “>50 kg” band is capped at 80 kg for simulation. Real LAVENDER weights are unlikely to be uniform, and this is the main reason the simulated per-band medians do not reproduce the paper’s ordering (see below).
- Trend across weight bands. The paper’s per-band medians decrease slightly with increasing weight (968.8 to 839.6 ug*h/mL), whereas the model applied to uniformly distributed within-band weights yields a mild increase. Both patterns are small and sit inside the same 20% window. The published medians are medians of individual empiric Bayesian estimates carrying the study’s real weight distribution, diarrhea occurrence (52.4% of RTT subjects experienced diarrhea at some point, reducing F1 by 14.8% while present), missed doses, and dosing intervals shorter or longer than 12 h. None of those are published, so they cannot be reproduced here. No parameter was tuned to close the gap.
-
Fasted, diarrhea-free, therapeutic dose. All
simulated subjects have
FED = 0,AE_DIARRHEA = 0,DOSE_18G = 0, andDOSE_24G = 0, matching the paper’s own covariate simulations, which “assumed a fasted state and no occurrence of diarrhea”. -
Steady state via
ss = 1. The dosing records usess = 1withii = 12rather than an explicit multi-week dosing history. Trofinetide’s terminal half-life is long relative to the 12 h interval, so the explicit route would need roughly two weeks of simulated doses for no additional fidelity. -
Residual error is not applied to the figures. The
plots and NCA use
Cc(the individual prediction) rather than a residual-error-perturbed observation, so they correspond to the paper’s model-predicted profiles rather than to observed concentrations. -
Both residual-error magnitudes are packaged. The
model carries
expSdHealthyandexpSdDiseaseand selects between them with the disease indicators, replicating the paper’s two separate exponential error models. The RTT cohort simulated here exercises only the disease branch. - Bioavailability may exceed 1 for some simulated subjects. F1 has a typical value of 0.828 with 20.8 %CV log-normal IIV, so the upper tail crosses 1. That is a property of the published parameterization, not of this implementation.
- All parameter values come from the paper’s text and tables. No value was digitized from a figure, obtained by correspondence, or carried from an upstream model.