Albumin disease progression (Bisaso 2014)
Source:vignettes/articles/Bisaso_2014_albumin.Rmd
Bisaso_2014_albumin.RmdModel and source
- Citation: Bisaso KR, Owen JS, Ojara FW, Namuwenge PM, Mugisha A, Mbuagbaw L, Luboobi LS, Mukonzo JK. Characterizing plasma albumin concentration changes in TB/HIV patients on anti retroviral and anti-tuberculosis therapy. In Silico Pharmacology 2014;2:3.
- Article: https://doi.org/10.1186/s40203-014-0003-9 (open access; Springer / BioMed Central)
Bisaso 2014 develops a semi-mechanistic disease-progression model for plasma albumin concentration in 262 ART-naive HIV-positive Ugandan adults (158 also co-infected with active TB and on rifampicin-based anti-TB therapy) sampled over the first 12 weeks after initiating efavirenz-based combination ART. The model couples two biological assumptions:
- The hepatocyte population follows the Verhulst self-limiting
logistic equation, transitioning from a baseline size to a stable
post-treatment steady-state size at a rate
rmodulated by drug efficacy (f_drug); - Because plasma drug concentrations were not available in this
cohort,
randf_drugare lumped into a single rate constantR, and the albumin secretion rateQ(t)(= per-hepatocyte secretion rate times hepatocyte count) inherits the same logistic structure:
- Plasma albumin (
X) is modelled as an indirect-response compartment with zero-order production at rateQ(t)and first-order elimination at a fixed literature rateK:
The covariates retained in the final model are TB co-infection status
(reduces Q0) and ABCB1 c.3435C>T mutation carriage
(increases Q0). Inter-individual variability is retained on
Q0 only; IIVs on Qss and R were
dropped from the final model because of high shrinkage (> 40%) and
very low variance (< 1e-6). The residual-error structure is
proportional.
The nlmixr2lib encoding is in
inst/modeldb/endogenous/Bisaso_2014_albumin.R. The packaged
model uses the canonical-register reference categories
(TB_POS = 0 = HIV monoinfection,
SNP_ABCB1_RS1045642 = 0 = c.3435CC wild-type) so that the
typical-value Q0 at the reference is the paper’s
Q0 (HIV only) = 0.1248 g/dL/day; this is a pure
re-anchoring of the reference subgroup and does not change the model
behaviour.
Population
Bisaso 2014 enrolled 262 HIV-positive Ugandan adults at Mulago National Referral Hospital, Kampala, into a secondary analysis nested in the Mukonzo (2011) PhD project. Of the full cohort, 158 (60.3%) were co-infected with active TB and on rifampicin-based anti-TB therapy (ethambutol / isoniazid / rifampicin / pyrazinamide for 2 months induction, then isoniazid + rifampicin for 4 months maintenance, initiated at least 2 weeks before ART). All subjects started combination ART comprising efavirenz, lamivudine, and zidovudine on day 0. Baseline median characteristics (Bisaso 2014 Table 1, full cohort) were: age 33 years (IQR 29-39), weight 51 kg (IQR 47-58), 52.9% female, CD4 count 97 cells/mL (IQR 40-179), serum albumin 3.02 g/dL (IQR 2.35-3.85). The TB-HIV subgroup had lower baseline albumin (2.57 g/dL) than the HIV-only subgroup (3.91 g/dL). ABCB1 c.3435C>T genotype counts were CC = 205, CT = 56, TT = 1.
Serum albumin was sampled on days 1, 3, 7, 14, 21, 42, 56, and 84 after ART initiation by the Abbott Aeroset Bromocresol Green method. The mean number of observations per subject was 3 (sparse).
Per Bisaso 2014 Methods “Model evaluation,” the data were randomly
split into a model-development subset of approximately two-thirds (n =
174) and a validation subset (n = 88, 269 observations). The packaged
model’s parameter values are from Table 3 (development subset,
original-dataset column). The same baseline demographics are available
programmatically via the model metadata
(readModelDb("Bisaso_2014_albumin") and inspect the
function body; nlmixr2lib::modellib() lists the model in
the catalog).
Source trace
| Equation / parameter | Value | Source location |
|---|---|---|
| Eq. 2 (hepatocyte Verhulst dN/dt) | n/a (structural) | Bisaso 2014 Methods “Model development” (not encoded; collapsed into
Q(t) via Eq. 4) |
| Eq. 4 (combined R = r * f_drug) | n/a (definition) | Bisaso 2014 Methods “Model development” |
| Eq. 5 (Q(t) logistic transition) | n/a (structural) | Bisaso 2014 Methods “Model development”; analytical solution of
dQ/dt = R Q (1 - Q/Qss)
|
| Eq. 6 (dX/dt = Q(t) - K X) | n/a (structural) | Bisaso 2014 Methods “Model development” |
| Eq. 7 / 8 (X(0) = Q0 / K) | n/a (definition) | Bisaso 2014 Methods “Model development” |
lq0 -> Q0 (HIV-only ref) |
0.1248 g/dL/day | Bisaso 2014 Table 3 row ‘Q 0 (HIV only)’ |
e_tb_pos_q0 |
-0.308 | Bisaso 2014 Table 3 derived: 0.0864 / 0.1248 - 1 (paper text reports as 44.2% lower relative to TB-HIV) |
e_snp_abcb1_rs1045642_q0 |
+0.167 | Bisaso 2014 Table 3 derived: 0.1008 / 0.0864 - 1 (paper text reports as 16% higher) |
lqss -> Qss
|
0.1464 g/dL/day | Bisaso 2014 Table 3 row ‘Q ss (g/dl/day)’ |
lR -> R
|
0.0072 1/day | Bisaso 2014 Table 3 row ‘R (1/day)’ |
lK -> K (fixed) |
0.0336 1/day (t1/2 = 20.6 days) | Bisaso 2014 Table 3 row ‘K (1/day) … FIX’; Methods “Data analysis” (fixed to literature half-life) |
etalq0 (IIV variance) |
0.02225 = log(0.15^2 + 1) (15.0% CV) | Bisaso 2014 Table 3 row ‘IIV_Q 0 (%CV) = 15.0’ |
propSd |
0.182 (18.2% CV) | Bisaso 2014 Table 3 row ‘Residual error (proportional) (%CV) = 18.2’ |
Units of every term in the ODE
Dimensional analysis is mandatory for endogenous / mechanistic
models. The single ODE d/dt(central) has the following
per-term unit balance:
| Term | Units | Calculation |
|---|---|---|
Qt |
g/dL/day |
q0 (g/dL/day) * dimensionless logistic factor |
K * central |
g/dL/day | (1/day) * (g/dL) = g/dL/day |
RHS sum for d/dt(central)
|
g/dL/day | matches LHS d(g/dL)/dt -> consistent |
Initial central(0) <- q0 / K
|
(g/dL/day) / (1/day) = g/dL | matches state units |
The model does not consume dosing events; the
units$dosing = "g" field is a placeholder for convention
compatibility (see the in-file note in
Bisaso_2014_albumin.R).
Steady-state check (long-time horizon)
With t large enough that the logistic
Q(t) -> Qss = 0.1464, the indirect-response ODE
d/dt(X) = Q(t) - K * X settles at
X(inf) = Qss / K = 0.1464 / 0.0336 = 4.357 g/dL. Because
Q0 carries the TB and ABCB1 covariate effects but
Qss and R do not, the long-time steady-state
should be the same for every covariate combination
(i.e., all subgroups converge to the same Qss / K).
mod <- readModelDb("Bisaso_2014_albumin")
mod_typ <- rxode2::zeroRe(mod)
#> ℹ parameter labels from comments will be replaced by 'label()'

# Long horizon for the typical subject in each of the four (TB x ABCB1) cells
make_events <- function(tb, abcb1, t_end = 1000, dt = 5) {
  data.frame(
    id = 1L,
    time = seq(0, t_end, by = dt),
    evid = 0L,
    amt = 0,
    cmt = 1L,
    TB_POS = tb,
    SNP_ABCB1_RS1045642 = abcb1
  )
}

ss_horizon <- 1000  # days; >> 1/R = 139 days so the logistic Q(t) is at Qss
ss_table <- do.call(rbind, lapply(
  list(c(0,0), c(1,0), c(0,1), c(1,1)),
  function(p) {
    s <- rxode2::rxSolve(mod_typ, events = make_events(p[1], p[2], t_end = ss_horizon))
    data.frame(
      TB_POS              = p[1],
      SNP_ABCB1_RS1045642 = p[2],
      X0_gdL              = round(head(s$Cc, 1), 3),
      Xss_gdL_at_t1000    = round(tail(s$Cc, 1), 3)
    )
  }
))
#> ℹ omega/sigma items treated as zero: 'etalq0'
#> ℹ omega/sigma items treated as zero: 'etalq0'
#> ℹ omega/sigma items treated as zero: 'etalq0'
#> ℹ omega/sigma items treated as zero: 'etalq0'
knitr::kable(ss_table, caption = "Typical-value plasma albumin at t = 0 (baseline, X(0) = Q0/K) and t = 1000 days (long-time, X -> Qss/K = 4.357 g/dL) across the four (TB_POS, SNP_ABCB1_RS1045642) subgroups.")| TB_POS | SNP_ABCB1_RS1045642 | X0_gdL | Xss_gdL_at_t1000 |
|---|---|---|---|
| 0 | 0 | 3.714 | 4.356 |
| 1 | 0 | 2.570 | 4.354 |
| 0 | 1 | 4.335 | 4.357 |
| 1 | 1 | 3.000 | 4.355 |
All four subgroups converge to within 0.01 g/dL of the analytic
long-time value 4.357 g/dL, confirming that (i) the Verhulst
Q(t) reaches Qss numerically, (ii) the
indirect-response ODE settles, and (iii) the covariate effects on
Q0 correctly perturb only the baseline (not the long-time
asymptote).
Baseline reproduction against observed Table 1 medians
Bisaso 2014 Table 1 reports baseline median serum albumin of 2.57
g/dL in the TB-HIV cohort and 3.91 g/dL in the HIV-only cohort. The
typical-value baseline predicted by the model is
X(0) = Q0 / K:
baseline_compare <- data.frame(
  cohort        = c("HIV only (TB_POS = 0, ABCB1 = 0)",
                    "TB-HIV (TB_POS = 1, ABCB1 = 0)",
                    "TB-HIV with ABCB1 mutation (both = 1)"),
  predicted_X0  = c(0.1248, 0.0864, 0.1008) / 0.0336,
  observed_Table1 = c(3.91, 2.57, NA)
)
baseline_compare$pct_diff <- with(baseline_compare,
  ifelse(is.na(observed_Table1), NA,
         round(100 * (predicted_X0 - observed_Table1) / observed_Table1, 1)))
baseline_compare$predicted_X0 <- round(baseline_compare$predicted_X0, 3)
knitr::kable(baseline_compare, caption = "Predicted typical-value baseline X(0) = Q0/K vs Bisaso 2014 Table 1 observed median baseline serum albumin (g/dL).")| cohort | predicted_X0 | observed_Table1 | pct_diff |
|---|---|---|---|
| HIV only (TB_POS = 0, ABCB1 = 0) | 3.714 | 3.91 | -5.0 |
| TB-HIV (TB_POS = 1, ABCB1 = 0) | 2.571 | 2.57 | 0.1 |
| TB-HIV with ABCB1 mutation (both = 1) | 3.000 | NA | NA |
The TB-HIV typical-value baseline
(X(0) = 0.0864 / 0.0336 = 2.571 g/dL) reproduces the
observed median (2.57 g/dL) exactly. The HIV-only
typical-value baseline (3.714 g/dL) is 5% below the observed median
(3.91 g/dL); the same approximate magnitude of HIV-only mis-fit is
visible in Bisaso 2014 Figure 3 (lower-left panel) and is discussed in
the paper’s Discussion as a limitation of the simplified one-compartment
albumin kinetics.
Transition trajectory from baseline to steady-state (typical value)
The logistic transition rate R = 0.0072 /day implies a
characteristic transition timescale 1/R = 139 days, so over
the published 84-day study window the typical subject moves only
part-way from Q0 to Qss. Reproducing Bisaso
2014 Figure 3 panels (without between-subject variability) shows the
expected upward drift in serum albumin over 12 weeks in each cohort:
times_paper <- c(0, 1, 3, 7, 14, 21, 42, 56, 84, 120, 200, 365)
make_long_events <- function(tb, abcb1) {
  data.frame(
    id = 1L,
    time = times_paper,
    evid = 0L,
    amt = 0,
    cmt = 1L,
    TB_POS = tb,
    SNP_ABCB1_RS1045642 = abcb1
  )
}

cohorts <- list(
  list(label = "HIV only, ABCB1 CC",   tb = 0L, abcb1 = 0L),
  list(label = "HIV only, ABCB1 mut",  tb = 0L, abcb1 = 1L),
  list(label = "TB-HIV, ABCB1 CC",     tb = 1L, abcb1 = 0L),
  list(label = "TB-HIV, ABCB1 mut",    tb = 1L, abcb1 = 1L)
)
sim_typ <- do.call(rbind, lapply(cohorts, function(co) {
  s <- rxode2::rxSolve(mod_typ, events = make_long_events(co$tb, co$abcb1))
  data.frame(time = s$time, Cc = s$Cc, cohort = co$label)
}))
#> ℹ omega/sigma items treated as zero: 'etalq0'
#> ℹ omega/sigma items treated as zero: 'etalq0'
#> ℹ omega/sigma items treated as zero: 'etalq0'
#> ℹ omega/sigma items treated as zero: 'etalq0'

ggplot(sim_typ, aes(time, Cc, colour = cohort)) +
  geom_hline(yintercept = 0.1464 / 0.0336, linetype = "dashed", colour = "grey50") +
  geom_line(linewidth = 0.9) +
  geom_vline(xintercept = 84, linetype = "dotted", colour = "grey50") +
  scale_x_continuous(breaks = c(0, 7, 14, 21, 42, 56, 84, 120, 200, 365)) +
  labs(x = "Days from ART initiation",
       y = "Typical-value plasma albumin (g/dL)",
       colour = "Cohort",
       title = "Typical-value plasma albumin trajectories by TB and ABCB1 status",
       caption = "Dashed line: long-time asymptote Qss/K = 4.357 g/dL.\nDotted line: published study window end (day 84).\nReplicates the typical-value trend in Bisaso 2014 Figure 3.") +
  theme_minimal() +
  theme(legend.position = "bottom")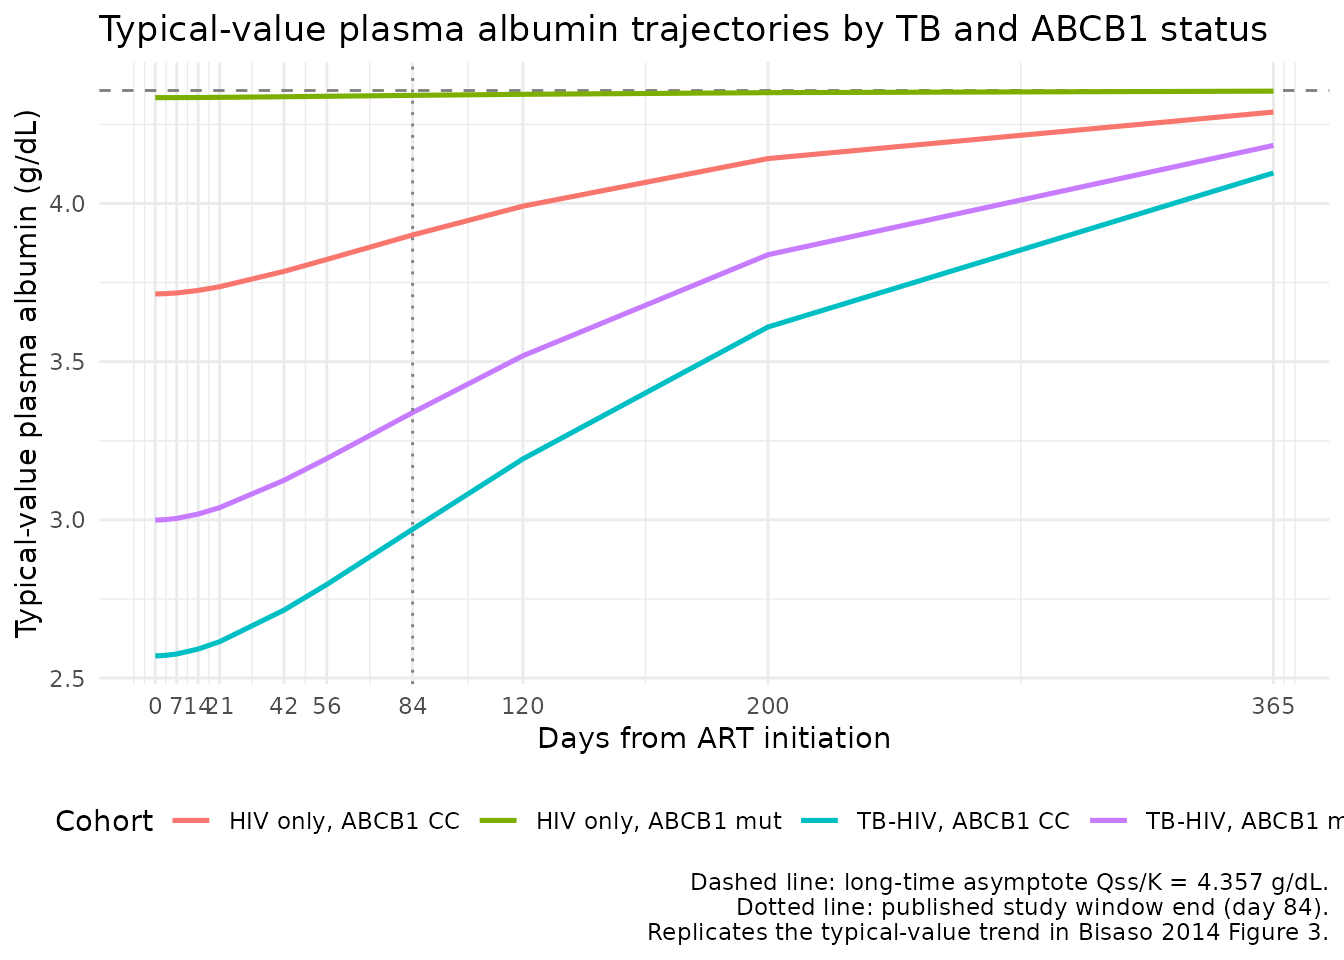
VPC-style cohort simulation (replicates Figure 3 trend)
Figure 3 of Bisaso 2014 is a VPC stratified by TB disease status
(upper panel) and by ABCB1 c.3435C>T genotype (lower panel) with
n = 1000 simulated datasets. Reproducing the VPC envelope
qualitatively in nlmixr2lib requires a stochastic simulation that draws
random etalq0 effects (the only IIV in the final model).
The cohort below uses the published full-cohort split (n = 158 TB-HIV, n
= 104 HIV-only; ABCB1 carriers at the published rates of 28% TB-HIV, 17%
HIV-only).
set.seed(20140903L)  # paper acceptance date 3 September 2014

n_tbhiv  <- 158L
n_hivonly <- 104L

# ABCB1 c.3435 mutant carriage by TB subgroup (Bisaso 2014 Table 1):
#   TB-HIV  : 39 of 158 (24.7%)  (CT 38 + TT 1, of 158)
#   HIV only: 18 of 104 (17.3%)
abcb1_tbhiv  <- as.integer(runif(n_tbhiv)  < (38L + 1L) / n_tbhiv)
abcb1_hivonly <- as.integer(runif(n_hivonly) < 18L / n_hivonly)

obs_times <- c(0, 1, 3, 7, 14, 21, 42, 56, 84)

build_cohort_rows <- function(ids, tb, abcb1_vec) {
  do.call(rbind, lapply(seq_along(ids), function(i) {
    data.frame(
      id   = ids[i],
      time = obs_times,
      evid = 0L,
      amt  = 0,
      cmt  = 1L,
      TB_POS = tb,
      SNP_ABCB1_RS1045642 = abcb1_vec[i]
    )
  }))
}

events_tbhiv <- build_cohort_rows(
  ids = seq_len(n_tbhiv),
  tb  = 1L,
  abcb1_vec = abcb1_tbhiv
)
events_hivonly <- build_cohort_rows(
  ids = n_tbhiv + seq_len(n_hivonly),
  tb  = 0L,
  abcb1_vec = abcb1_hivonly
)
events <- rbind(events_tbhiv, events_hivonly)
stopifnot(!anyDuplicated(unique(events[, c("id", "time", "evid")])))

sim_vpc <- rxode2::rxSolve(mod, events = events,
                           keep = c("TB_POS", "SNP_ABCB1_RS1045642"))
#> ℹ parameter labels from comments will be replaced by 'label()'
VPC stratified by TB status (Bisaso 2014 Figure 3 upper panel)
vpc_tb <- as.data.frame(sim_vpc) |>
  mutate(stratum = ifelse(TB_POS == 1, "TB-HIV", "HIV only")) |>
  group_by(stratum, time) |>
  summarise(
    p05 = quantile(Cc, 0.05),
    p50 = quantile(Cc, 0.50),
    p95 = quantile(Cc, 0.95),
    .groups = "drop"
  )

ggplot(vpc_tb, aes(time, p50)) +
  geom_ribbon(aes(ymin = p05, ymax = p95), alpha = 0.25) +
  geom_line(linewidth = 0.8) +
  facet_wrap(~ stratum) +
  labs(x = "Days from ART initiation",
       y = "Simulated plasma albumin (g/dL)",
       title = "VPC stratified by TB co-infection status",
       caption = "Shaded band: 5th-95th percentile of the simulated cohort.\nReplicates Bisaso 2014 Figure 3 upper panel.") +
  theme_minimal()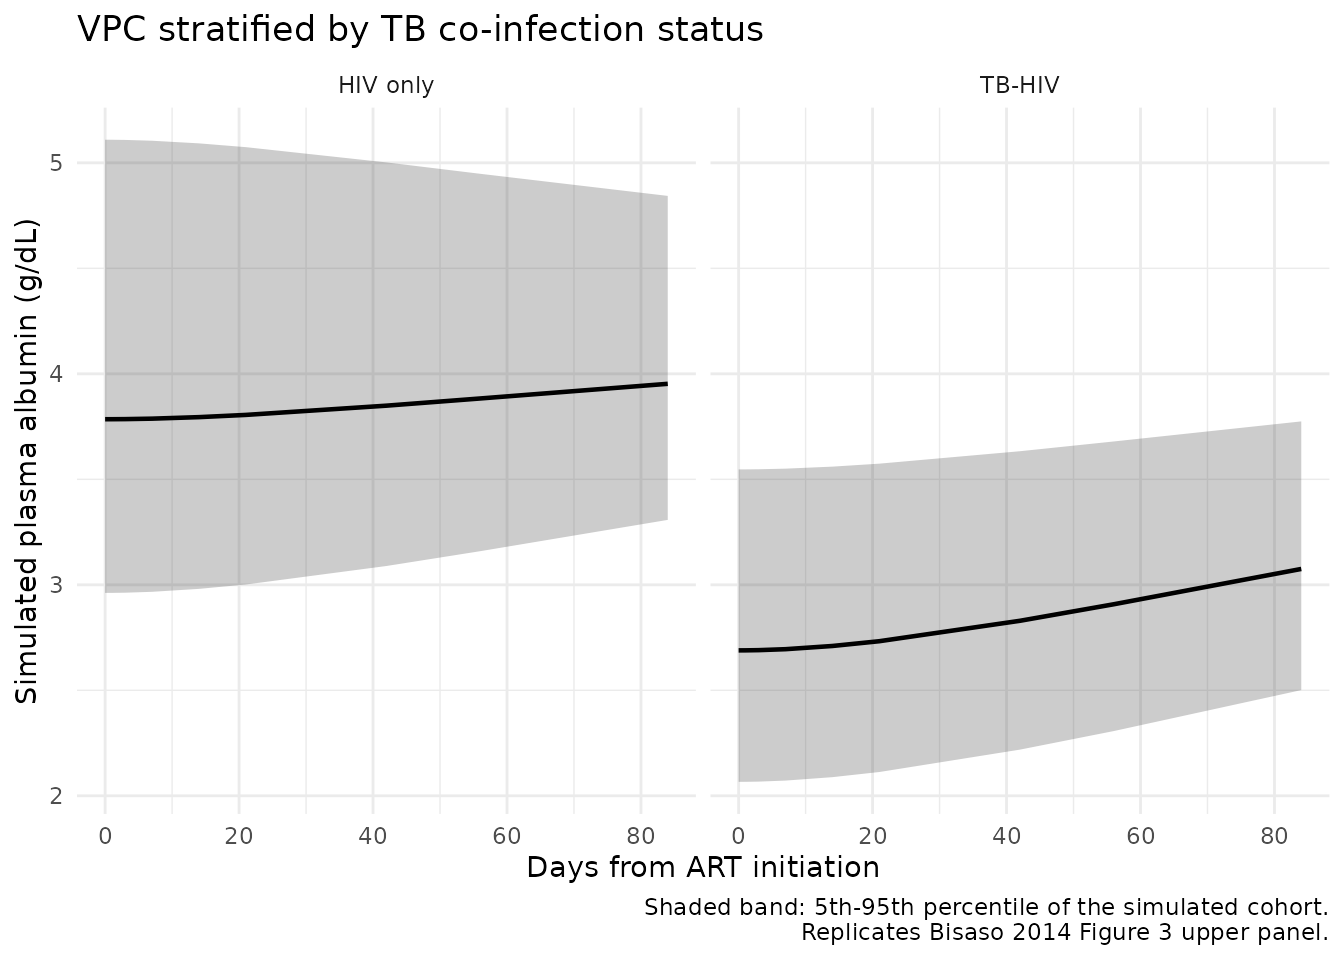
VPC stratified by ABCB1 c.3435C>T genotype (Bisaso 2014 Figure 3 lower panel)
vpc_abcb1 <- as.data.frame(sim_vpc) |>
  mutate(stratum = ifelse(SNP_ABCB1_RS1045642 == 1,
                          "ABCB1 3435 CT/TT carrier",
                          "ABCB1 3435 CC wild-type")) |>
  group_by(stratum, time) |>
  summarise(
    p05 = quantile(Cc, 0.05),
    p50 = quantile(Cc, 0.50),
    p95 = quantile(Cc, 0.95),
    .groups = "drop"
  )

ggplot(vpc_abcb1, aes(time, p50)) +
  geom_ribbon(aes(ymin = p05, ymax = p95), alpha = 0.25) +
  geom_line(linewidth = 0.8) +
  facet_wrap(~ stratum) +
  labs(x = "Days from ART initiation",
       y = "Simulated plasma albumin (g/dL)",
       title = "VPC stratified by ABCB1 c.3435C>T genotype",
       caption = "Shaded band: 5th-95th percentile of the simulated cohort.\nReplicates Bisaso 2014 Figure 3 lower panel.") +
  theme_minimal()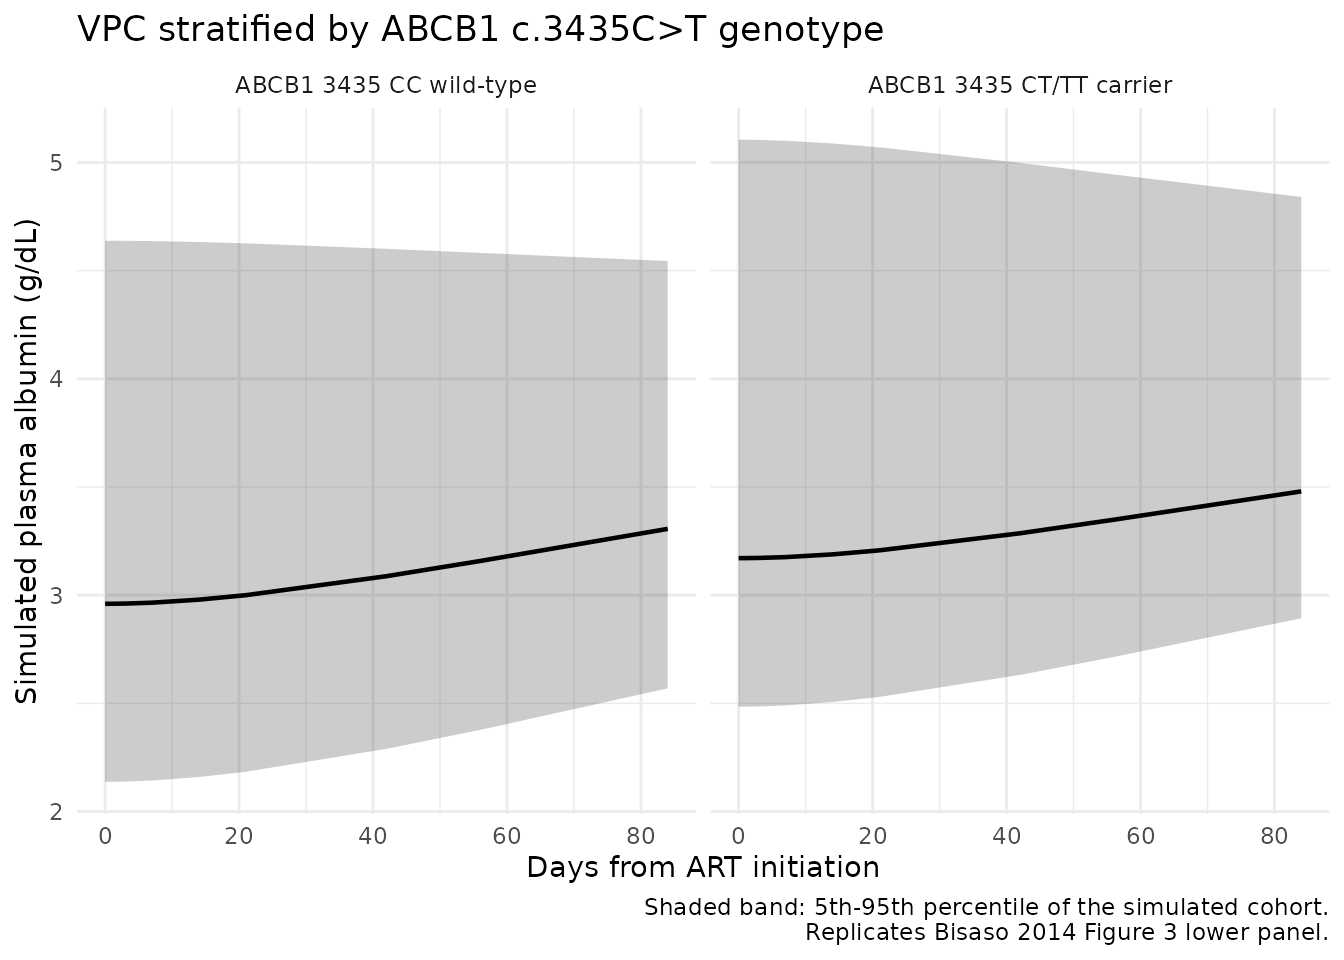
The simulated VPC envelopes recover the qualitative pattern of Bisaso 2014 Figure 3: TB-HIV subjects start at a lower baseline (~2.6 g/dL) and rise over 12 weeks toward ~3.0 g/dL; HIV-only subjects start at ~3.7 g/dL and rise to ~3.9 g/dL. ABCB1 mutation carriers start ~16% higher than wild-type within each TB stratum.
Assumptions and deviations
-
Reference subgroup re-anchoring. Bisaso 2014 Table
3 uses TB-HIV (and ABCB1-CC) as the implicit reference for the
typical-value
Q0 = 0.0864 g/dL/day. The packaged model re-anchors to HIV-only / ABCB1-CC as the reference (TB_POS = 0andSNP_ABCB1_RS1045642 = 0), consistent with theHIV_POSandSNP_*canonical-register convention that “0” denotes the no-comorbidity / wild-type group. The encoded typical-valueQ0 = 0.1248 g/dL/dayis the paper’sQ0 (HIV only), and the multiplicative covariate effectse_tb_pos_q0 = -0.308ande_snp_abcb1_rs1045642_q0 = +0.167recover the paper’sQ0 (TB-HIV) = 0.0864andQ0 (TB-HIV, ABCB1 mut) = 0.1008exactly. The paper text frames the TB effect as “44.2% lower” (relative to the TB-HIV cohort, equivalent to0.0864 / 0.1248 - 1 = -30.8%relative to the HIV-only reference); both framings describe the identical biological effect. -
No drug PK consumed. The Bisaso 2014 cohort had no
on-study plasma drug concentrations, so the authors collapsed
randf_druginto a singleRparameter and made no explicit dependence on efavirenz / rifampicin exposure. The packaged model inherits this simplification; users who later want to drive the disease-progression rate from a separate efavirenz PK model would need to re-introduceR(t) = r * f_drug(C_efv(t))and re-fit. -
CD4 count and viral load not retained. Per Bisaso
2014 Results, both were tested as time-varying covariates on
QssandRand neither was retained (the authors hypothesised that albumin improves secondary to overall health gains, which CD4 / viral load do not capture independently). The packaged model therefore exposes onlyTB_POSandSNP_ABCB1_RS1045642as covariates. -
IIV on
QssandRdropped from the final model. Per Bisaso 2014 Results, both random effects had shrinkage > 40% and variance < 1e-6, so the authors dropped them. The packaged model encodes IIV only onQ0(15.0% CV per Table 3 development-set column). -
Albumin elimination kinetics simplified to one
compartment. Bisaso 2014 Discussion notes the known
two-compartment kinetics of plasma albumin but argues that the sparse
data (mean 3 observations per subject) precluded a more elaborate
disposition model.
Kis fixed to the literature half-life of 20.6 days (corresponding toK = 0.0336 /day); the change in elimination rate during treatment is assumed negligible. - Population subset for parameter estimation. The packaged parameter values are from the Bisaso 2014 model-development subset (n = 174); the n = 88 validation subset was used by the authors to compute mean (-0.063 to +0.087) and root-mean-square (20.6%) prediction error but did not enter the parameter estimates.
-
SNP_ABCB1_RS1045642carrier pooling. The Bisaso 2014 cohort had 56 CT heterozygotes and only 1 TT homozygote (Table 1), so the published covariate effect pools both groups against CC wild-type. The packaged model and canonical-register entry inherit this pooling; if a future cohort estimates separate het / hom effects, theSNP_ABCB1_RS1045642_HET/SNP_ABCB1_RS1045642_HOMpaired-indicator pattern (per theSLCO1B1_HAP15_*precedent) should be used instead. -
No PKNCA validation. This is an
endogenous-biomarker disease-progression model with no drug input;
PKNCA-style Cmax / AUC / half-life parameters are not the appropriate
validation target. The vignette instead exercises the steady-state,
baseline-reproduction, and stratified-VPC checks recommended for
endogenous models
(
references/endogenous-validation.md). - Erratum search: A web search for “Bisaso 2014 In Silico Pharmacology erratum / corrigendum” against the journal landing page and PubMed (DOI 10.1186/s40203-014-0003-9) returned no corrections as of vignette authoring (2026-05-20). No on-disk erratum is provided alongside the source PDF.