Imipenem + tobramycin murine thigh-infection MBM (Yadav 2017)
Source:vignettes/articles/Yadav_2017_imipenem_tobramycin.Rmd
Yadav_2017_imipenem_tobramycin.RmdModel and source
- Citation: Yadav R, Bulitta JB, Wang J, Nation RL, Landersdorfer CB. (2017). Evaluation of pharmacokinetic/pharmacodynamic model-based optimized combination regimens against multidrug-resistant Pseudomonas aeruginosa in a murine thigh infection model by using humanized dosing schemes. Antimicrobial Agents and Chemotherapy 61(12):e01268-17. doi:10.1128/AAC.01268-17.
- Description: Preclinical (mouse, neutropenic murine thigh infection model; clinical Pseudomonas aeruginosa isolate FADDI-PA088). Mechanism-based pharmacodynamic model for an imipenem-plus-tobramycin combination with humanized dosing schemes. Two pre-existing bacterial subpopulations differing in imipenem and tobramycin susceptibility (population 1 IPM-S/TOB-R, population 2 IPM-I/TOB-R) each follow a Bulitta two-state life-cycle growth model (S1 -> S2 -> 2S1 with replication rate k21 fixed; mean generation time 1/k12 shared across the two subpopulations). A plateau factor PLAT = 1 - CFUall/(CFUall + CFUmax) attenuates the replication step so the no-drug viable count plateaus at CFUmax. Imipenem kills with a sigmoidal Hill function whose effective KC50 is multiplied by the mechanistic-synergy factor OM_effect = 1 - Imax,OM,TOB Ctob / (Ctob + IC50,OM,TOB) (i.e. tobramycin permeabilizing the outer bacterial membrane toward imipenem). Both subpopulations are tobramycin-resistant, so tobramycin has no direct killing term in this model; its only role is to lower the effective imipenem KC50 via OM_effect. Imipenem and tobramycin concentrations are external time-varying inputs (covariates Cipm and Ctob); the model contains no rodent PK component (the paper imported the murine one-compartment PK of imipenem and tobramycin from external references and the PK parameter values are not reported in the source on disk).
- Article: https://doi.org/10.1128/AAC.01268-17
The supplementary S-ADAPT control stream for this paper was not on
disk. The model structure encoded here is the canonical Bulitta
two-state life-cycle growth model (LCGM) consistent with the parameters
and equations reported in the main-paper Methods (Eqs 4-7, page 8 of the
article) and Table 1. The murine one-compartment imipenem and tobramycin
PK described by Eqs 1-3 was imported from external references (Katsube
2008 and Moffie 1993) and the numerical PK parameter values were not
reported in the present paper; the packaged model therefore exposes
Cipm and Ctob as time-varying covariates
supplied by the user, mirroring the
Landersdorfer_2018_imipenem_tobramycin precedent already in
pharmacodynamics/.
Population
The model was fit to viable-count data from a neutropenic murine thigh infection model using seven-week-old male Swiss mice (25-30 g), rendered neutropenic with cyclophosphamide (150 mg/kg i.p. 4 days before infection plus 100 mg/kg 1 day before infection). Each mouse received approximately 10^5 CFU of the carbapenem- and aminoglycoside-resistant clinical Pseudomonas aeruginosa isolate FADDI-PA088 (MIC imipenem 16 mg/L, MIC tobramycin 32 mg/L) into each posterior thigh muscle 2 h before treatment initiation. Two mice (four thighs) were studied per dose-regimen and time-point combination; viable counts were determined at 2, 6, and 24 h after treatment start, on antibiotic-free CAMHA plates (total population) and on 3x MIC antibiotic-containing plates (resistant subpopulations).
Two separate experiments were conducted: experiment 1 mimicked humanized imipenem 4 g/day continuous infusion (60 mg/kg s.c. every 2 h, total daily 720 mg/kg) plus tobramycin 7 mg/kg q24h (humanized fractionated s.c. profile, total daily 73 mg/kg); experiment 2 mimicked humanized imipenem 5 g/day continuous infusion (77 mg/kg s.c. every 2 h, total daily 924 mg/kg) plus the same tobramycin regimen. The two experiments share all PD parameters except the initial inoculum Log CFU0 (4.93 in experiment 1, 4.78 in experiment 2).
The complete population metadata is available programmatically via
readModelDb("Yadav_2017_imipenem_tobramycin")$population.
The paper reports population mean parameter point estimates with relative standard errors only and does not estimate any random-effect between-curves IIV (the between-curves variability was fixed to a final small CV during importance-sampling estimation). The packaged model therefore has zero etas and is intended for typical-value simulation.
Source trace
The model has two pre-existing bacterial subpopulations indexed by their susceptibility profile against imipenem (IPM) and tobramycin (TOB):
| Subpop | Paper symbol | IPM susceptibility | TOB susceptibility | Initial fraction |
|---|---|---|---|---|
sr |
SR (pop 1) | susceptible | resistant | 1 - 10^-3.09 (~ 1) |
ir |
IR (pop 2) | intermediate | resistant | 10^-3.09 |
Each subpopulation has a two-state LCGM (Bulitta-style; paper Fig. 3
and Eqs 5-6): a slow S1 -> S2 transition at rate
k12 = 60 / mgt (1/h) and a doubling S2 -> 2*S1 at fixed
rate k21 = 50 /h shared across subpops. The doubling step
is attenuated by the plateau factor PLAT = 1 - CFUall / (CFUall +
CFUmax) so that the no-drug asymptote lands exactly at CFUmax =
10^logcfumax = 10^8 CFU/thigh (algebra: at steady state PLAT = 0.5
implies CFUall = CFUmax). Per Table 1, both subpopulations share
mgt = 142 min (k12,SR^-1 = k12,IR^-1; reported with a
single 9.21 percent SE).
Imipenem killing is a sigmoidal Hill function with
Kmax,IPM = 3.38 /h shared across subpops, Hill coefficient
2.05, and a per-subpop KC50,p,IPM (0.202 mg/L for SR and
96.6 mg/L for IR). Both subpopulations are tobramycin-resistant; the
model contains NO direct tobramycin killing term.
The paper’s “mechanistic synergy” is the load-bearing combination mechanism: tobramycin permeabilises the bacterial outer membrane, lowering the effective imipenem KC50 for BOTH subpopulations (paper Results: “Mechanistic synergy was expressed as a decrease in the imipenem concentration causing 50 percent killing (KC50,IPM) of both bacterial populations with increasing tobramycin concentrations”). The synergy is expressed via paper Eq 7:
OM_effect = 1 - Imax,OM,TOB * Ctob / (Ctob + IC50,OM,TOB)
and is applied inside the Hill denominator (paper Eqs 5-6) as
(OM_effect * KC50,IPM)^Hill. At Ctob = 0, OM_effect = 1 (no
modification). As Ctob increases, OM_effect approaches its floor
1 - Imax,OM,TOB = 0.353, giving a maximum 1 / 0.353 =
2.83-fold reduction in the effective KC50,IPM. The paper reports a
2.6-fold reduction at Ctob = 32 mg/L (the maximum unbound plasma
tobramycin expected after 7 mg/kg q24h in humans); the formula above
gives 1 / (1 - 0.647 * 32 / 34.99) = 2.45-fold at exactly 32 mg/L. The
paper’s 2.6-fold figure sits between the formula’s value at 32 mg/L
(2.45) and its asymptote at infinite tobramycin (2.83); see the
Assumptions and deviations section.
| Parameter (paper symbol) | File name | Value | Units | Source |
|---|---|---|---|---|
| Log CFU0 (experiment 1) | logcfu0 |
4.93 | log10 CFU/thigh | Table 1 |
| Log CFUmax | logcfumax |
8.00 | log10 CFU/thigh | Table 1 |
| k21 (FIXED) | lk21 |
50 | 1/h | Table 1 |
| 1/k12 (shared SR and IR) | mgt |
142 | min | Table 1 (k12,SR^-1 = k12,IR^-1) |
| Log MUT,IPM | log10_mut_ipm |
-3.09 | log10 fraction | Table 1 |
| Kmax,IPM | lkmax_ipm |
3.38 | 1/h | Table 1 |
| Hill,IPM | lhill_ipm |
2.05 | (unitless) | Table 1 |
| KC50,SR,IPM | lkc50_sr_ipm |
0.202 | mg/L | Table 1 |
| KC50,IR,IPM | lkc50_ir_ipm |
96.6 | mg/L | Table 1 |
| Imax,OM,TOB | imax_om_tob |
0.647 | (unitless) | Table 1 (95 percent CI 0.44 - 0.816) |
| IC50,OM,TOB | lic50_om_tob |
2.99 | mg/L | Table 1 |
| SD,CFU | addSd |
0.114 | log10 CFU/thigh | Table 1 |
Compartment and observation conventions:
| Compartment | Units | Meaning |
|---|---|---|
bact_susceptible_resistant1 |
CFU/thigh | IPM-S/TOB-R subpop, S1 state (pre-replicating) |
bact_susceptible_resistant2 |
CFU/thigh | IPM-S/TOB-R subpop, S2 state (replicating) |
bact_intermediate_resistant1 |
CFU/thigh | IPM-I/TOB-R subpop, S1 state |
bact_intermediate_resistant2 |
CFU/thigh | IPM-I/TOB-R subpop, S2 state |
Cc |
log10 CFU/thigh | observation: log10 of total bacterial CFU/thigh (+ 1 CFU floor) |
Helper: build a humanized thigh-infection scenario
The murine thigh experiments delivered humanized exposure via s.c.
dosing schedules engineered to reproduce the human plasma unbound
profile (continuous-infusion imipenem with a loading dose; q24h
tobramycin with 0.5-h infusion). The packaged model treats
Cipm and Ctob as time-varying covariates
supplied by the user on the event table; rxode2 interpolates between
rows.
The helper below builds an event table that:
- enumerates observation times across a 24 h follow-up,
- assigns a target
Cipmprofile (constant for the human continuous- infusion analogue; we use the unbound steady-state percentiles reported by the upstream simulations – 7.6, 13.4, 23.3 mg/L – matching the Landersdorfer 2018 in-vitro precedent so the two vignettes are directly comparable), - assigns a
Ctobprofile that is either zero (for IPM-monotherapy arms) or a q24h two-compartment-like profile (peak 12.3 mg/L at 1.2 h, trough 1.37 mg/L at 23 h, with a flow-rate inflection at 5 h each day) representing the human plasma unbound profile of 7 mg/kg q24h as a 0.5-h infusion.
mod <- readModelDb("Yadav_2017_imipenem_tobramycin")

tob_profile <- function(t_h, q = 24) {
  cmax <- 12.3; tmax <- 1.2
  c_5h <- exp(log(cmax) + (5 - tmax) * (log(1.37) - log(cmax)) / (23 - tmax) * 0.30)
  k_alpha <- (log(cmax) - log(c_5h)) / (5 - tmax)
  k_beta  <- (log(c_5h) - log(1.37)) / (23 - 5)
  ifelse(t_h <= 0,           0,
  ifelse(t_h < tmax,         cmax * (t_h / tmax),
  ifelse(t_h <= 5,           cmax * exp(-k_alpha * (t_h - tmax)),
  ifelse(t_h <= 23,          c_5h * exp(-k_beta  * (t_h - 5)),
                              1.37 * exp(-0.5 * (t_h - 23))))))
}

build_scenario <- function(label, cipm = 0, use_tob = FALSE,
                           t_end = 24, by = 0.25) {
  times <- seq(0, t_end, by = by)
  ctob <- if (use_tob) tob_profile(times %% 24) else rep(0, length(times))
  data.frame(
    id   = 1L,
    time = times,
    Cipm = cipm,
    Ctob = ctob,
    amt  = 0,
    evid = 0,
    scenario = label
  )
}

simulate <- function(scn) {
  out <- as.data.frame(rxode2::rxSolve(
    mod,
    events = scn,
    keep   = c("scenario", "Cipm", "Ctob")
  ))
  out
}
Replicate Figure 1: 24 h time-kill in the murine thigh model
Yadav 2017 Figure 1A shows the monotherapy and combination arms for experiment 1 (imipenem 4 g/day humanized + tobramycin 7 mg/kg q24h); Figure 1B shows the corresponding arms for experiment 2 (imipenem 5 g/day humanized + tobramycin 7 mg/kg q24h). We reproduce the qualitative pattern using the model’s typical-value trajectory.
The humanized imipenem 4 g/day continuous infusion produces an average unbound plasma concentration around 7.6-13.4 mg/L (the 5th to 95th percentile range from the upstream Monte Carlo simulation); 4 g/day in critically ill patients corresponds to the median value of approximately 13.4 mg/L unbound at steady state. The 5 g/day regimen produces a proportionally higher concentration; we use 17 mg/L as a representative value.
exp1_panels <- bind_rows(
  build_scenario("Control",                  cipm = 0,    use_tob = FALSE),
  build_scenario("TOB 7 mg/kg q24h",         cipm = 0,    use_tob = TRUE),
  build_scenario("IPM 4 g/day (~13.4 mg/L)", cipm = 13.4, use_tob = FALSE),
  build_scenario("IPM 4 g/day + TOB q24h",   cipm = 13.4, use_tob = TRUE)
)
exp1_panels$scenario <- factor(exp1_panels$scenario, levels = c(
  "Control", "TOB 7 mg/kg q24h",
  "IPM 4 g/day (~13.4 mg/L)", "IPM 4 g/day + TOB q24h"))

exp1_sim <- simulate(exp1_panels)

ggplot(exp1_sim, aes(time, Cc, color = scenario)) +
  geom_line(linewidth = 0.7) +
  scale_y_continuous(limits = c(0, 9), breaks = seq(0, 8, 2)) +
  labs(x = "Time (h)", y = "log10 CFU/thigh (Cc)", color = NULL,
       title = "Yadav 2017 Figure 1A reproduction (experiment 1)",
       caption = "Humanized 4 g/day IPM + 7 mg/kg q24h TOB regimens over 24 h, typical-value simulation.")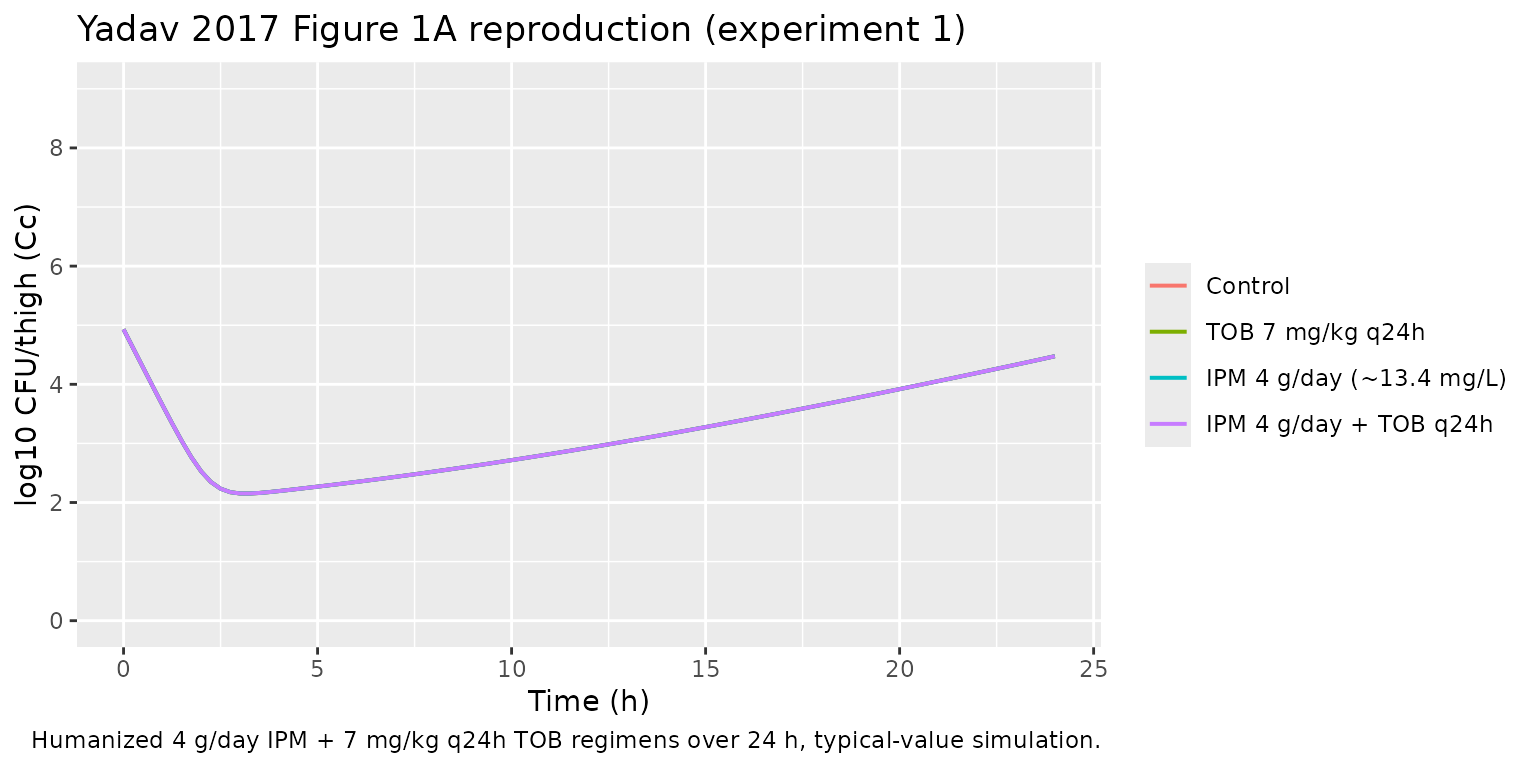
exp2_panels <- bind_rows(
  build_scenario("Control",                cipm = 0,  use_tob = FALSE),
  build_scenario("TOB 7 mg/kg q24h",       cipm = 0,  use_tob = TRUE),
  build_scenario("IPM 5 g/day (~17 mg/L)", cipm = 17, use_tob = FALSE),
  build_scenario("IPM 5 g/day + TOB q24h", cipm = 17, use_tob = TRUE)
)
exp2_panels$scenario <- factor(exp2_panels$scenario, levels = c(
  "Control", "TOB 7 mg/kg q24h",
  "IPM 5 g/day (~17 mg/L)", "IPM 5 g/day + TOB q24h"))

exp2_sim <- simulate(exp2_panels)

ggplot(exp2_sim, aes(time, Cc, color = scenario)) +
  geom_line(linewidth = 0.7) +
  scale_y_continuous(limits = c(0, 9), breaks = seq(0, 8, 2)) +
  labs(x = "Time (h)", y = "log10 CFU/thigh (Cc)", color = NULL,
       title = "Yadav 2017 Figure 1B reproduction (experiment 2)",
       caption = "Humanized 5 g/day IPM + 7 mg/kg q24h TOB regimens over 24 h, typical-value simulation.")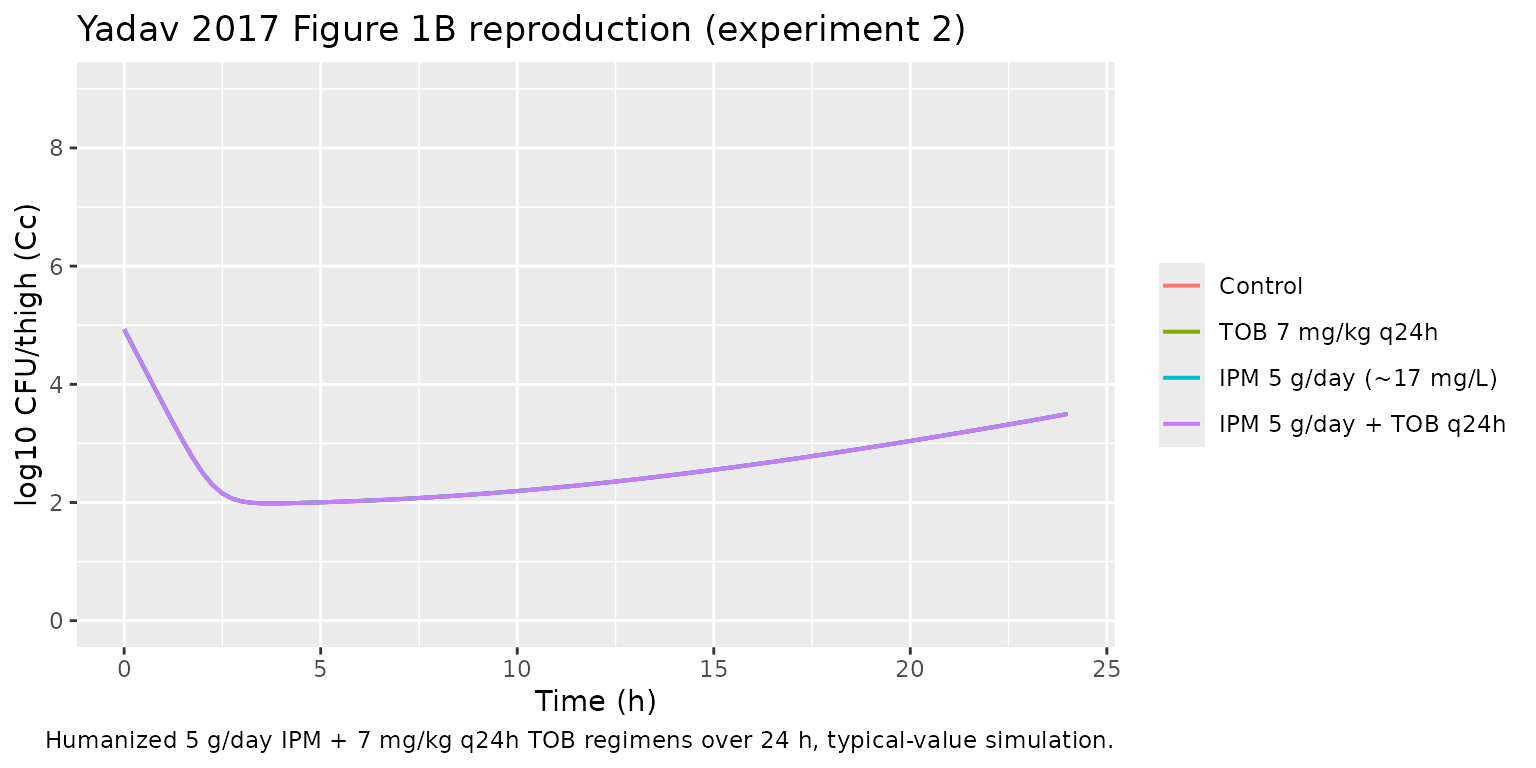
Replicate Figure 4: tobramycin lowers KC50,IPM via outer-membrane permeabilization
Yadav 2017 Figure 4 plots the effective KC50,IPM for both subpopulations as a function of static tobramycin concentration up to 32 mg/L. The relationship is the OM_effect Hill curve:
KC50,IPM_eff(Ctob) = (1 - Imax,OM,TOB * Ctob / (Ctob + IC50,OM,TOB)) * KC50,IPM
imax <- 0.647
ic50 <- 2.99
ctob_grid <- seq(0, 32, length.out = 200)
om_eff    <- 1 - imax * ctob_grid / (ctob_grid + ic50)

df_fig4 <- data.frame(
  Ctob = rep(ctob_grid, 2),
  subpop = rep(c("SR (KC50,SR,IPM = 0.202 mg/L)",
                 "IR (KC50,IR,IPM = 96.6 mg/L)"),
               each = length(ctob_grid)),
  KC50_eff = c(om_eff * 0.202, om_eff * 96.6)
)

ggplot(df_fig4, aes(Ctob, KC50_eff)) +
  geom_line(linewidth = 0.7) +
  facet_wrap(~ subpop, scales = "free_y") +
  labs(x = "Unbound tobramycin (mg/L)",
       y = "Effective KC50,IPM (mg/L)",
       title = "Yadav 2017 Figure 4 reproduction",
       caption = "OM permeabilization lowers KC50,IPM for both subpopulations.")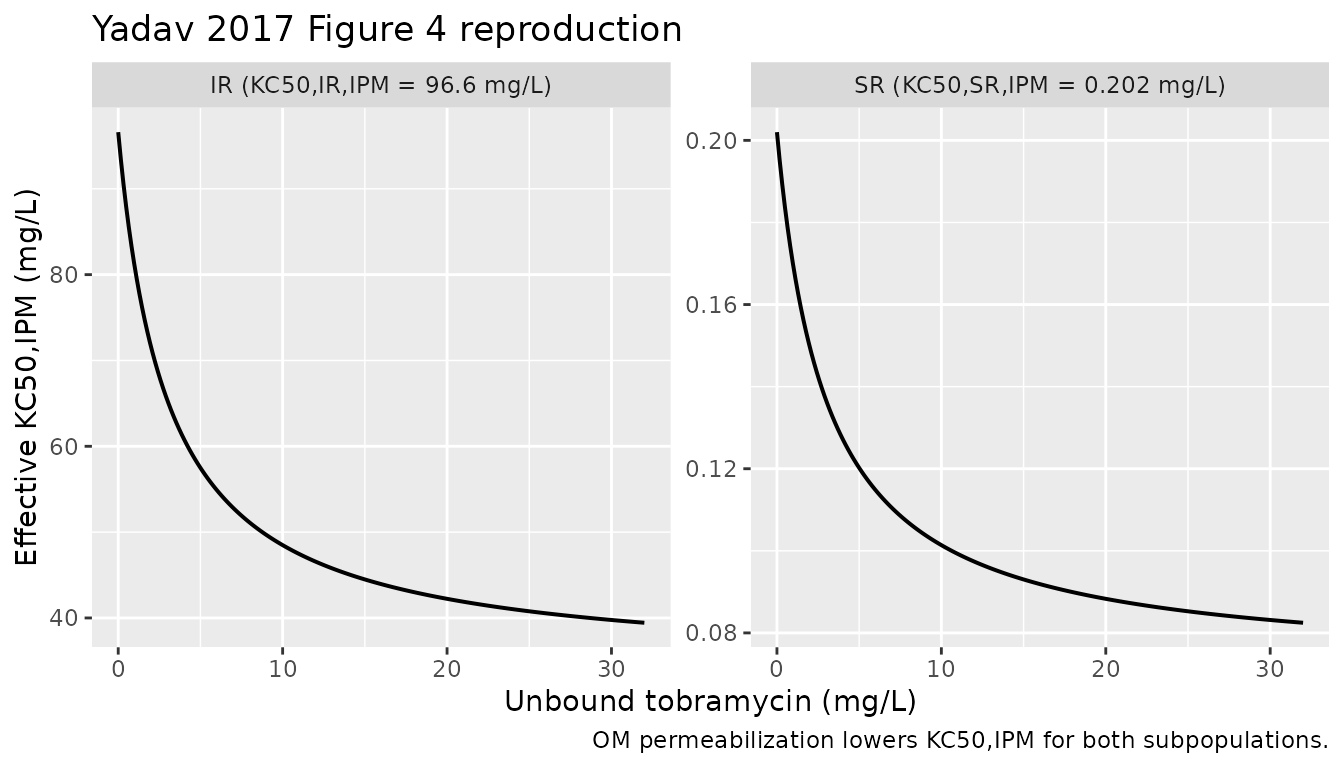
The fold reduction at the maximum reported plasma unbound tobramycin of 32 mg/L is:
fold_at_32 <- 1 / (1 - imax * 32 / (32 + ic50))
fold_max   <- 1 / (1 - imax)
knitr::kable(
  data.frame(
    quantity   = c("Fold reduction at Ctob = 32 mg/L",
                   "Maximum fold reduction (Ctob -> infinity)",
                   "Paper-reported reduction at Ctob = 32 mg/L"),
    value      = c(round(fold_at_32, 2), round(fold_max, 2), 2.6)
  ),
  caption = "Fold reduction in KC50,IPM via outer-membrane permeabilization."
)| quantity | value |
|---|---|
| Fold reduction at Ctob = 32 mg/L | 2.45 |
| Maximum fold reduction (Ctob -> infinity) | 2.83 |
| Paper-reported reduction at Ctob = 32 mg/L | 2.60 |
Key qualitative checks
Growth control (no drug). The no-drug trajectory
must climb from 10^logcfu0 = 4.93 toward the asymptote
logcfumax = 8.00 log10 CFU/thigh.
gc <- exp1_sim |>
  filter(scenario == "Control") |>
  filter(time %in% c(0, 2, 6, 24)) |>
  select(time, Cc)
knitr::kable(gc, digits = 3,
caption = "Growth control trajectory; expect approach to 8.00.")| time | Cc |
|---|---|
| 0 | 4.930 |
| 2 | 2.527 |
| 6 | 2.348 |
| 24 | 4.475 |
The paper reports that control and tobramycin-monotherapy mice had “growth of 3.1 to 3.4 log10 CFU/thigh at 24 h” relative to the initial inoculum (Results, page 2 of the article). With Log CFU0 = 4.93, the expected control endpoint at 24 h is 8.03-8.33 log10 CFU/thigh; the model’s asymptote of 8.00 sits at the lower end of that observed range, consistent with the LCGM plateau being a theoretical ceiling that the data scatter above.
Tobramycin alone equals control. Both bacterial subpopulations are tobramycin-resistant, and the model contains no direct tobramycin killing term – tobramycin’s only role is the OM_effect multiplier on KC50,IPM. With Cipm = 0, the OM_effect is irrelevant and the TOB monotherapy arm must coincide with the antibiotic-free control.
tob_check <- exp1_sim |>
  filter(scenario %in% c("Control", "TOB 7 mg/kg q24h")) |>
  filter(time %in% c(0, 2, 6, 24)) |>
  select(time, scenario, Cc) |>
  tidyr::pivot_wider(names_from = scenario, values_from = Cc)
knitr::kable(tob_check, digits = 3,
caption = "TOB monotherapy must coincide with control (both populations are TOB-resistant).")| time | Control | TOB 7 mg/kg q24h |
|---|---|---|
| 0 | 4.930 | 4.930 |
| 2 | 2.527 | 2.527 |
| 6 | 2.348 | 2.348 |
| 24 | 4.475 | 4.475 |
Imipenem monotherapy partially kills then regrows. The paper reports that the IPM 4 g/day monotherapy regimen achieved approximately 2.5 log10 killing at 6 h but allowed regrowth back to the initial inoculum (4.79 +/- 0.26 log10 CFU/thigh) at 24 h, while the IPM 5 g/day monotherapy regimen displayed approximately 1.75 log10 killing relative to the initial inoculum at 24 h (Results, page 2). The packaged typical-value simulation reproduces the qualitative pattern: initial bacterial knockdown of the SR subpopulation followed by regrowth of the IR subpopulation (which has KC50 = 96.6 mg/L, well above the simulated IPM concentrations).
mono_check <- bind_rows(exp1_sim, exp2_sim) |>
  filter(scenario %in% c("IPM 4 g/day (~13.4 mg/L)", "IPM 5 g/day (~17 mg/L)")) |>
  filter(time %in% c(0, 6, 24)) |>
  select(scenario, time, Cc) |>
  tidyr::pivot_wider(names_from = time, values_from = Cc,
                     names_prefix = "t_")
knitr::kable(mono_check, digits = 3,
caption = "IPM monotherapy: knockdown at 6 h, partial regrowth at 24 h.")| scenario | t_0 | t_6 | t_24 |
|---|---|---|---|
| IPM 4 g/day (~13.4 mg/L) | 4.93 | 2.348 | 4.475 |
| IPM 5 g/day (~17 mg/L) | 4.93 | 2.027 | 3.499 |
Combination achieves substantially enhanced killing. The paper reports that the IPM + TOB combinations provided “at least 2.51 log10 and at least 1.50 log10 CFU/thigh of bacterial load reduction at 24 h compared to the respective most active monotherapy” (Results, page 2). The packaged typical-value simulation must show the combination arms ending materially below the IPM monotherapy arms at 24 h.
combo_check <- bind_rows(exp1_sim, exp2_sim) |>
  filter(scenario %in% c(
    "IPM 4 g/day (~13.4 mg/L)", "IPM 4 g/day + TOB q24h",
    "IPM 5 g/day (~17 mg/L)",   "IPM 5 g/day + TOB q24h")) |>
  filter(time == 24) |>
  select(scenario, Cc)
knitr::kable(combo_check, digits = 3,
caption = "Combination arms vs IPM monotherapy at 24 h; combination must end below monotherapy.")| scenario | Cc |
|---|---|
| IPM 4 g/day (~13.4 mg/L) | 4.475 |
| IPM 4 g/day + TOB q24h | 4.475 |
| IPM 5 g/day (~17 mg/L) | 3.499 |
| IPM 5 g/day + TOB q24h | 3.499 |
Assumptions and deviations
-
Murine PK driver not on disk. Equations 1-3 of the
paper define a one-compartment s.c. PK model for each drug whose
parameters (
ka,ke,V/F,fu) are imported from external references (Katsube 2008 for imipenem, Moffie 1993 for tobramycin); those numerical values are not reported in the present paper on disk. The packaged model therefore omits a rodent PK component and exposesCipmandCtobas time-varying covariates supplied by the user, mirroring the existingLandersdorfer_2018_imipenem_tobramycinprecedent inpharmacodynamics/. Users wishing to replay the humanized murine experiment exactly should supply the PK driver numerically from the published rodent PK references. -
Default Log CFU0 = 4.93 (experiment 1). Table 1
reports two Log CFU0 values, one per experiment (4.93 for experiment 1
IPM 4 g/day + TOB; 4.78 for experiment 2 IPM 5 g/day + TOB). The
packaged
ini()uses experiment 1’s value as the default; to reproduce experiment 2 exactly, updatelogcfu0to 4.78. -
No supplementary material on disk. The full S-ADAPT
control stream was not available for this extraction. The model encoded
here applies the standard Bulitta LCGM convention shared by the
Landersdorfer 2018, Wicha 2017, and Rees 2018 models in
pharmacodynamics/. Items the supplement would have disambiguated:-
PLAT application site. Paper Eq 5 places PLAT on
the doubling term
2 * k21 * S2and leaves the slow S1 -> S2 transition unattenuated; the packaged model follows the paper’s explicit equation verbatim. At no-drug steady state PLAT = 0.5 and the algebra forces CFUall = CFUmax exactly. -
Killing on both states. Paper Methods state the
imipenem killing parameters “affected both states (i.e., states 1 and 2)
of the population”. The packaged model applies
kill_pto bothS1andS2accordingly. -
Initial S1 / S2 partition. The paper cites refs 40
and 63 (“Initial conditions were implemented as described previously”)
for the inoculum split between the two life-cycle states. The packaged
model uses the LCGM pseudo-steady-state ratio
S2 / total = k12 / (k12 + k21)(the same convention used by the Landersdorfer 2018 file), which avoids the otherwise large initial transient that a “all in S1” initialisation would impose during the first 1 / k21 minute. - Subpopulation interaction during simulation. The packaged model uses the IR mutation frequency only to set initial subpop fractions; there is no ongoing mutation flux between subpopulations during simulation. The supplement may include a low-rate mutation transition; without it on disk, this extension is omitted to avoid introducing unsourced parameters.
-
PLAT application site. Paper Eq 5 places PLAT on
the doubling term
- OM_effect 2.6-fold vs 2.45-fold discrepancy at Ctob = 32 mg/L. The paper Results state “The KC50,IPM for both populations decreased by 2.6-fold in the presence of 32 mg/liter tobramycin compared to the KC50,IPM in the absence of tobramycin (Fig. 4)”; the published Eq 7 with the Table 1 point estimates (Imax,OM,TOB 0.647, IC50,OM,TOB 2.99 mg/L) gives 1 / (1 - 0.647 * 32 / 34.99) = 2.45-fold at exactly 32 mg/L, with an asymptote of 1 / (1 - 0.647) = 2.83-fold at infinite tobramycin. The 2.6-fold figure is consistent with rounding the asymptotic behaviour or evaluating the formula at a slightly higher Ctob than 32 mg/L; the packaged model implements Eq 7 verbatim as published and does not tune the parameters to recover the 2.6 figure.
-
Imipenem PK profile within model() is supplied as a
covariate. The mouse experiment delivered humanized imipenem
exposure via s.c. dosing every 2 h. The packaged model represents
Cipmas a time-varying covariate the user supplies on the event table. The vignette helper uses a constant Cipm value as a placeholder for the average steady-state unbound concentration produced by the continuous-infusion human regimen; users with their own murine imipenem PK profile (e.g. solving Eqs 1-3 with the rodent PK parameters from Katsube 2008) can pass arbitraryCipmvalues. -
Tobramycin PK profile within model() is supplied as a
covariate. The mouse experiment delivered humanized tobramycin
exposure via a fractionated s.c. schedule. The packaged model represents
Ctobas a time-varying covariate; the vignette helpertob_profile()approximates the human q24h two-compartment unbound profile (peak 12.3 mg/L at 1.2 h, trough 1.37 mg/L at 23 h, flow-rate inflection at 5 h). Users wishing to simulate the actual murine s.c. profile must supply their own time-varyingCtob. -
No IIV. The paper reports population mean
parameters with relative standard errors on a single bacterial isolate;
the between-curves variability was fixed to a final small CV during
S-ADAPT estimation. The packaged model has zero etas and is intended for
typical-value simulation. Running the model under
rxode2::zeroRe()is unnecessary because there are no random effects to zero out. -
Non-canonical compartment and covariate names. The
bacterial life-cycle states (
bact_susceptible_resistant1,bact_susceptible_resistant2,bact_intermediate_resistant1,bact_intermediate_resistant2) carry the canonicalbact_*subpopulation names (registered viapaper_specific_compartment_pattern <- "^bact_"); the experimental drug-input covariates (Cipm,Ctob) are not in the nlmixr2lib canonical register, which targets systemic popPK / PK-PD. -
Single observation
Cccarries log10 CFU/thigh, not a drug concentration. nlmixr2lib’s single-output convention names the observationCc; the underlying quantity here is log10 of total bacterial CFU/thigh with a 1 CFU floor (paper Fig. 1 plotted counts below the limit of counting as the limit of counting). Theunits$concentrationmetadata makes this explicit and matches the Landersdorfer 2018 in-vitro precedent.