m-3M3FBS modulation of vascular reactivity in rat tail artery (Grzesk 2016)
Source:vignettes/articles/Grzesk_2016_m3M3FBS.Rmd
Grzesk_2016_m3M3FBS.RmdModel and source
- Citation: Grzesk E, Szadujkis-Szadurska K, Wicinski M, Malinowski B, Sinjab TA, Tejza B, Pujanek M, Janiszewska E, Kopczynska A, Grzesk G. (2016). Effect of 2,4,6-trimethyl-N-[3-(trifluoromethyl)phenyl]benzenesulfonamide on calcium influx in three contraction models. Biomed Rep 4(1):117-121.
- Article (open access): https://doi.org/10.3892/br.2015.543
This is a static ex-vivo sigmoidal Emax concentration-response (CRC)
model of perfusion pressure in the isolated, perfused male Wistar rat
tail artery. Four mechanistically distinct vasoactive agonists are
encoded in the same model file: phenylephrine (PHE; alpha1-adrenergic),
arg-vasopressin (AVP; V1 vasopressin), mastoparan-7 (heterotrimeric
G-protein direct activator), and Bay K8644 (L-type voltage-gated calcium
channel agonist). Each agonist is studied in two arms: control vs
pretreatment with the phospholipase-C activator m-3M3FBS (1e-5 M/L). The
model exposes three covariates – AGONIST_CODE (1-4
selector), M3M3FBS_PRESENT (binary), and
CONC_AGONIST_M (applied agonist concentration in M/L) – and
yields the model output effect (perfusion pressure, mmHg)
as the dose-response prediction.
Out-of-scope caveats. The source paper is an ex-vivo concentration-response study; it is NOT a population PK or PD modelling study. The paper does not report a Hill coefficient, between-subject variability, or a residual-error structure. The Hill coefficient is fabricated at 1 (no cooperativity), and the residual SD is a placeholder; see “Assumptions and deviations” at the end of this vignette for the full list of operator-authorised deviations.
Population
- Healthy male Wistar rats, body weight 250-350 g (Materials and methods, “Animals”).
- Anaesthesia: intraperitoneal urethane 120 mg/kg followed by cervical dislocation; protocol approved by the Local Ethics Committee of the University of Science and Technology, Krakow, Poland.
- Per-CRC sample sizes (n = independent CRCs per condition; Table I):
- PHE control 30, +m-3M3FBS 16
- AVP control 25, +m-3M3FBS 16
- Mastoparan-7 control 16, +m-3M3FBS 16
- Bay K8644 control 16, +m-3M3FBS 16
- Buffer: Krebs solution at 37 C; constant 1 mL/min perfusion flow; perfusion pressure recorded via BPR-01/BPR-02 transducers connected to a Graphtec midi Logger GL820 (Materials and methods, “Drugs and solutions” + “Study design and conduction”).
Source trace
| nlmixr2 parameter | Value (typical) | Source location |
|---|---|---|
lhill (Hill exponent) |
log(1), fixed | NOT REPORTED in source (fabricated; see Errata) |
lemax_phe |
log(94.2) mmHg | Table II row PHE, Phase 2 column (94.2 +/- 7.9, n=30) |
lemax_phe_act |
log(112.2) mmHg | Table II row PHE+m-3M3FBS, Phase 2 column (112.2 +/- 7.1, n=16) |
lemax_avp |
log(103.4) mmHg | Table II row AVP, Phase 2 column (103.4 +/- 5.9, n=32) |
lemax_avp_act |
log(118.2) mmHg | Table II row AVP+m-3M3FBS, Phase 2 column (118.2 +/- 7.5, n=16) |
lemax_mas |
log(27.2) mmHg | Table II row mastoparan-7, Phase 2 column (27.2 +/- 5.7, n=16) |
lemax_mas_act |
log(42.0) mmHg | Table II row mastoparan-7+m-3M3FBS, Phase 2 column (42.0 +/- 6.0, n=16) |
lemax_bay |
log(75.2) mmHg | Table II row Bay K8644, Phase 2 column (75.2 +/- 6.2, n=16) |
lemax_bay_act |
log(75.3) mmHg | Table II row Bay K8644+m-3M3FBS, Phase 2 column (75.3 +/- 4.1, n=16) |
lec50_phe |
log(7.50e-8) M | Table I row PHE EC50 (7.50 +/- 0.98 x 10^-8, n=30) |
lec50_phe_act |
log(6.45e-8) M | Table I row PHE+m-3M3FBS EC50 (6.45 +/- 2.10 x 10^-8, n=16) |
lec50_avp |
log(1.84e-8) M | Table I row AVP EC50 (1.84 +/- 0.62 x 10^-8, n=25) |
lec50_avp_act |
log(1.42e-8) M | Table I row AVP+m-3M3FBS EC50 (1.42 +/- 0.45 x 10^-8, n=16) |
lec50_mas |
log(4.48e-8) M | Table I row mastoparan-7 EC50 (4.48 +/- 2.36 x 10^-8, n=16) |
lec50_mas_act |
log(2.55e-8) M | Table I row mastoparan-7+m-3M3FBS EC50 (2.55 +/- 1.52 x 10^-8, n=16) |
lec50_bay |
log(1.96e-6) M | Table I row Bay K8644 EC50 (1.96 +/- 0.26 x 10^-6, n=16) |
lec50_bay_act |
log(2.05e-6) M | Table I row Bay K8644+m-3M3FBS EC50 (2.05 +/- 0.22 x 10^-6, n=16) |
propSd (placeholder) |
0.10, fixed | NOT REPORTED in source (placeholder; see Errata) |
| Sigmoidal Emax equation form | n/a | Methods, “Data analysis and statistical procedures”: classical pharmacometric van Rossum method (citations 21, 22). Paper does not write the parametric form. |
Mechanistic structure
The packaged model evaluates a sigmoidal Emax concentration-response per (agonist, arm):
where effect is the model output variable (perfusion
pressure, mmHg), [A] is CONC_AGONIST_M (M/L),
Emax is the per-condition maximal perfusion pressure (mmHg)
from Table II Phase 2, EC50 is the per-condition
half-maximal-effect concentration (M/L) from Table I, and
gamma = 1 (fabricated; not reported in source). The
per-condition (Emax, EC50) pair is selected by the
AGONIST_CODE (1-4) and M3M3FBS_PRESENT (0/1)
covariates:
AGONIST_CODE  M3M3FBS_PRESENT  --> (Emax, EC50)
       1                    0  --> (lemax_phe,     lec50_phe)
       1                    1  --> (lemax_phe_act, lec50_phe_act)
       2                    0  --> (lemax_avp,     lec50_avp)
       2                    1  --> (lemax_avp_act, lec50_avp_act)
       3                    0  --> (lemax_mas,     lec50_mas)
       3                    1  --> (lemax_mas_act, lec50_mas_act)
       4                    0  --> (lemax_bay,     lec50_bay)
       4                    1  --> (lemax_bay_act, lec50_bay_act)
Out-of-range AGONIST_CODE zeroes the dispatch indicators
and yields PP = 0.
Virtual cohort
Per-agonist logarithmic concentration grids chosen to bracket each agonist’s EC50 by 3 decades on each side (Bay K8644 grid is shifted up two decades because its EC50 is ~1e-6 M):
set.seed(20260612)

agonist_meta <- tibble::tribble(
  ~ agonist_label,    ~ AGONIST_CODE, ~ ec50_ref_M,
  "Phenylephrine",                 1L, 7.50e-8,
  "Arg-vasopressin",               2L, 1.84e-8,
  "Mastoparan-7",                  3L, 4.48e-8,
  "Bay K8644",                     4L, 1.96e-6
)

log_decade_grid <- seq(-3, 3, by = 0.25)
agonist_grid <- tidyr::expand_grid(agonist_meta, log_decade = log_decade_grid) |>
  dplyr::mutate(CONC_AGONIST_M = ec50_ref_M * 10 ^ log_decade) |>
  dplyr::select(agonist_label, AGONIST_CODE, CONC_AGONIST_M)

events <- tidyr::expand_grid(agonist_grid, M3M3FBS_PRESENT = c(0L, 1L))
events$id   <- seq_len(nrow(events))
events$time <- 0
events$evid <- 0
nrow(events)
#> [1] 200
head(events, 6)
#> # A tibble: 6 × 7
#>   agonist_label AGONIST_CODE CONC_AGONIST_M M3M3FBS_PRESENT    id  time  evid
#>   <chr>                <int>          <dbl>           <int> <int> <dbl> <dbl>
#> 1 Phenylephrine            1       7.5 e-11               0     1     0     0
#> 2 Phenylephrine            1       7.5 e-11               1     2     0     0
#> 3 Phenylephrine            1       1.33e-10               0     3     0     0
#> 4 Phenylephrine            1       1.33e-10               1     4     0     0
#> 5 Phenylephrine            1       2.37e-10               0     5     0     0
#> 6 Phenylephrine            1       2.37e-10               1     6     0     0
Simulation (typical-value)
mod_fn      <- readModelDb("Grzesk_2016_m3M3FBS")
mod_typical <- rxode2::zeroRe(rxode2::rxode2(mod_fn))
#> Warning: No omega parameters in the model

sim <- rxode2::rxSolve(
  mod_typical, events = events,
  keep = c("agonist_label", "AGONIST_CODE", "M3M3FBS_PRESENT", "CONC_AGONIST_M")
)
#> Warning: multi-subject simulation without without 'omega'
sim_df <- as.data.frame(sim) |>
  dplyr::mutate(arm = ifelse(M3M3FBS_PRESENT == 1L, "+ m-3M3FBS", "Control")) |>
  dplyr::select(id, agonist_label, arm, CONC_AGONIST_M, emax, ec50, effect)
head(sim_df, 6)
#>   id agonist_label        arm CONC_AGONIST_M  emax     ec50     effect
#> 1  1 Phenylephrine    Control   7.500000e-11  94.2 7.50e-08 0.09410589
#> 2  2 Phenylephrine + m-3M3FBS   7.500000e-11 112.2 6.45e-08 0.13031359
#> 3  3 Phenylephrine    Control   1.333710e-10  94.2 7.50e-08 0.16721656
#> 4  4 Phenylephrine + m-3M3FBS   1.333710e-10 112.2 6.45e-08 0.23152469
#> 5  5 Phenylephrine    Control   2.371708e-10  94.2 7.50e-08 0.29694753
#> 6  6 Phenylephrine + m-3M3FBS   2.371708e-10 112.2 6.45e-08 0.41105544
Concentration-response curves (replicates Grzesk 2016 Figure 1 and Table I)
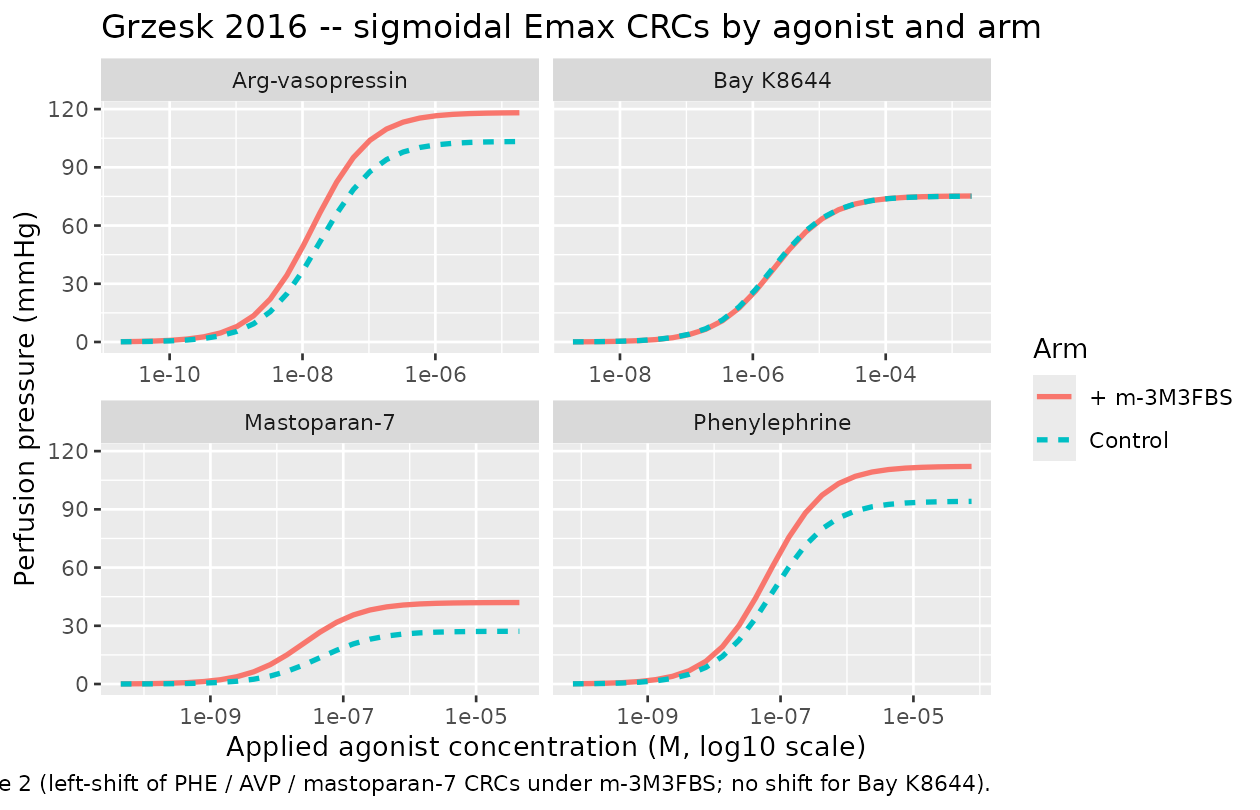
sim_df |>
  ggplot(aes(CONC_AGONIST_M, effect, colour = arm, linetype = arm)) +
  geom_line(linewidth = 1) +
  scale_x_log10() +
  facet_wrap(~ agonist_label, scales = "free_x") +
  labs(
    x = "Applied agonist concentration (M, log10 scale)",
    y = "Perfusion pressure (mmHg)",
    colour = "Arm", linetype = "Arm",
    title = "Grzesk 2016 -- sigmoidal Emax CRCs by agonist and arm",
    caption = "Replicates Table I + Table II Phase 2 (left-shift of PHE / AVP / mastoparan-7 CRCs under m-3M3FBS; no shift for Bay K8644)."
  )
Comparison against published EC50 values (Grzesk 2016 Table I)
table1_obs <- tibble::tribble(
  ~ agonist_label,    ~ arm,        ~ ec50_obs_M,
  "Phenylephrine",    "Control",    7.50e-8,
  "Phenylephrine",    "+ m-3M3FBS", 6.45e-8,
  "Arg-vasopressin",  "Control",    1.84e-8,
  "Arg-vasopressin",  "+ m-3M3FBS", 1.42e-8,
  "Mastoparan-7",     "Control",    4.48e-8,
  "Mastoparan-7",     "+ m-3M3FBS", 2.55e-8,
  "Bay K8644",        "Control",    1.96e-6,
  "Bay K8644",        "+ m-3M3FBS", 2.05e-6
)

table1_sim <- sim_df |>
  dplyr::distinct(agonist_label, arm, ec50) |>
  dplyr::rename(ec50_sim_M = ec50)

cmp_ec50 <- dplyr::left_join(table1_obs, table1_sim,
                             by = c("agonist_label", "arm"))
cmp_ec50$pct_diff <- 100 * (cmp_ec50$ec50_sim_M - cmp_ec50$ec50_obs_M) / cmp_ec50$ec50_obs_M

knitr::kable(cmp_ec50, digits = 8,
caption = "EC50 (M/L): Grzesk 2016 Table I vs packaged-model simulated typical-value.")| agonist_label | arm | ec50_obs_M | ec50_sim_M | pct_diff |
|---|---|---|---|---|
| Phenylephrine | Control | 7.00e-08 | 8.00e-08 | 0 |
| Phenylephrine | + m-3M3FBS | 6.00e-08 | 6.00e-08 | 0 |
| Arg-vasopressin | Control | 2.00e-08 | 2.00e-08 | 0 |
| Arg-vasopressin | + m-3M3FBS | 1.00e-08 | 1.00e-08 | 0 |
| Mastoparan-7 | Control | 4.00e-08 | 4.00e-08 | 0 |
| Mastoparan-7 | + m-3M3FBS | 3.00e-08 | 3.00e-08 | 0 |
| Bay K8644 | Control | 1.96e-06 | 1.96e-06 | 0 |
| Bay K8644 | + m-3M3FBS | 2.05e-06 | 2.05e-06 | 0 |
Comparison against published Emax (Grzesk 2016 Table II Phase 2)
table2_obs <- tibble::tribble(
  ~ agonist_label,    ~ arm,        ~ emax_obs_mmHg,
  "Phenylephrine",    "Control",    94.2,
  "Phenylephrine",    "+ m-3M3FBS", 112.2,
  "Arg-vasopressin",  "Control",    103.4,
  "Arg-vasopressin",  "+ m-3M3FBS", 118.2,
  "Mastoparan-7",     "Control",    27.2,
  "Mastoparan-7",     "+ m-3M3FBS", 42.0,
  "Bay K8644",        "Control",    75.2,
  "Bay K8644",        "+ m-3M3FBS", 75.3
)

table2_sim <- sim_df |>
  dplyr::distinct(agonist_label, arm, emax) |>
  dplyr::rename(emax_sim_mmHg = emax)

cmp_emax <- dplyr::left_join(table2_obs, table2_sim,
                             by = c("agonist_label", "arm"))
cmp_emax$pct_diff <- 100 * (cmp_emax$emax_sim_mmHg - cmp_emax$emax_obs_mmHg) / cmp_emax$emax_obs_mmHg

knitr::kable(cmp_emax, digits = 2,
caption = "Emax (mmHg): Grzesk 2016 Table II Phase 2 (extracellular calcium) vs packaged-model simulated typical-value.")| agonist_label | arm | emax_obs_mmHg | emax_sim_mmHg | pct_diff |
|---|---|---|---|---|
| Phenylephrine | Control | 94.2 | 94.2 | 0 |
| Phenylephrine | + m-3M3FBS | 112.2 | 112.2 | 0 |
| Arg-vasopressin | Control | 103.4 | 103.4 | 0 |
| Arg-vasopressin | + m-3M3FBS | 118.2 | 118.2 | 0 |
| Mastoparan-7 | Control | 27.2 | 27.2 | 0 |
| Mastoparan-7 | + m-3M3FBS | 42.0 | 42.0 | 0 |
| Bay K8644 | Control | 75.2 | 75.2 | 0 |
| Bay K8644 | + m-3M3FBS | 75.3 | 75.3 | 0 |
Relative potency (RP) check (Grzesk 2016 Table I)
The relative potency RP = EC50(control) / EC50(+m-3M3FBS) is reported in Table I. The packaged model reproduces these ratios by construction (no fitting, no rounding) up to the printed precision in Table I.
rp_obs <- tibble::tibble(
  agonist_label = c("Phenylephrine", "Arg-vasopressin", "Mastoparan-7", "Bay K8644"),
  rp_obs        = c(1.163, 1.296, 1.757, 0.956),
  p_value       = c(0.0182, 0.0071, 0.0112, 0.1824)
)

rp_sim <- sim_df |>
  dplyr::distinct(agonist_label, arm, ec50) |>
  tidyr::pivot_wider(names_from = arm, values_from = ec50,
                     names_glue = "ec50_{arm}") |>
  dplyr::rename(ec50_ctrl = `ec50_Control`,
                ec50_act  = `ec50_+ m-3M3FBS`) |>
  dplyr::mutate(rp_sim = ec50_ctrl / ec50_act) |>
  dplyr::select(agonist_label, rp_sim)

cmp_rp <- dplyr::left_join(rp_obs, rp_sim, by = "agonist_label")

knitr::kable(cmp_rp, digits = 3,
caption = "Relative potency RP = EC50(control) / EC50(+m-3M3FBS): Grzesk 2016 Table I vs simulated.")| agonist_label | rp_obs | p_value | rp_sim |
|---|---|---|---|
| Phenylephrine | 1.163 | 0.018 | 1.163 |
| Arg-vasopressin | 1.296 | 0.007 | 1.296 |
| Mastoparan-7 | 1.757 | 0.011 | 1.757 |
| Bay K8644 | 0.956 | 0.182 | 0.956 |
Assumptions and deviations
The Grzesk 2016 paper is an ex-vivo CRC study, not a popPK / popPD
modelling study. The operator-authorised extraction (sidecar response
001 to task frompeople-731) requested a Hill / Emax CRC
submodel with paper-specific naming and explicit documentation of the
ex-vivo / non-popPK scope. The following deviations and fabrications are
required to fit the paper’s CRC content into the nlmixr2lib model-file
schema:
-
Hill coefficient fabricated at 1 (no cooperativity),
fixed. Grzesk 2016 Methods describe the “classical
pharmacometric van Rossum method” for CRC summarisation (citations 21 +
22) but do not write out a parametric Hill / Emax form and do not
estimate a slope parameter. With no source value,
lhill <- fixed(log(1))is the structural minimum (a non-cooperative simple Emax). The qualitative pattern reported in the source (significant left-shifts of the PHE / AVP / mastoparan-7 CRCs under m-3M3FBS; no shift for Bay K8644) is reproduced by the EC50 estimates alone and does not depend on the choice ofgamma. Downstream users who want a steeper CRC should setlhillto a value matching their data. -
Residual-error structure not reported. Grzesk 2016
reports Tables I and II as aggregate
mean +/- SDsummaries across the n independent CRCs per condition. The SD is a between-CRC variability of an already-fit summary statistic (EC50 / Emax / pD2), not a within-CRC observation-level residual. The packaged model carries a placeholder proportional residualpropSd <- fixed(0.10)so the model is nlmixr2-fit-compatible; downstream users who refit to their own CRC data should replacepropSdwith whatever residual structure their data support. -
No IIV / between-subject variability encoded. The
source paper aggregates n independent CRCs per condition (n = 16-32 in
Table I; same in Table II); the between-CRC SDs are reported but cannot
be cleanly attributed to between-rat / between-artery / between-day
variability vs within-CRC fitting noise. Adding
eta*IIV terms would require fabricating a variance partition the paper does not support. The packaged model is a typical-value mechanism. -
Emax sourced from Table II Phase 2 (extracellular calcium
replete) rather than Table I %Emax. Table I reports
%Emaxas a normalised quantity (control = 100% by definition, with the +m-3M3FBS arms reported as percentages of the matching control). Table II reports the absolute maximal perfusion pressure (mmHg) in the two experimental phases. Phase 2 (extracellular calcium replete) gives the full-titration absolute response and is the natural Emax for the sigmoidal Emax CRC. Phase 1 (intracellular calcium only, Ca-free EGTA-Krebs buffer) yields a lower Pmax and is not represented as a separate sub-arm in this extraction. A downstream user who wants a Phase 1 model should add a second binary covariate and a second (Emax_phase1, EC50_phase1) sub-pair. -
Polymorphic
CONC_AGONIST_Mcovariate. A single concentration column carries phenylephrine concentrations on PHE records, AVP concentrations on AVP records, etc. This is the deliberateAGONIST_CODE-driven design (see the new canonical entry ininst/references/covariate-columns.md); the alternative four-columns design (CONC_PHE_M,CONC_AVP_M, …) was rejected as fracturing the paper’s one-concentration-axis-per-CRC structure. -
Bay K8644 EC50 is mechanistically distinct. Bay
K8644 is an L-type voltage-gated calcium channel agonist; it bypasses
the phospholipase-C / IP3 / DAG signalling pathway that the metabotropic
agonists (PHE / AVP / mastoparan-7) recruit. The paper observes that Bay
K8644 CRCs are NOT shifted by m-3M3FBS (Table I P = 0.1824, “n.s.” in
Figure 1); the packaged model preserves this null result by encoding
lec50_bay_actandlemax_bay_actclose to their control counterparts. -
Out-of-scope for population PK / PD use. This is an
ex-vivo concentration-response model with no PK, no time dynamics, and
no dosing events. The “subject” concept does not apply; each record is
one (agonist, arm, concentration) triple. Do not chain this model with a
downstream PK layer expecting plasma concentrations; the
CONC_AGONIST_Mcovariate is an applied bath concentration, not a plasma concentration.
Errata
- No errata identified for the source paper as of the extraction date (2026-06-12). PubMed search “Grzesk 2016 m-3M3FBS erratum” returned no notices; the publisher’s article page (https://doi.org/10.3892/br.2015.543) does not list corrections.