Model and source
- Citation: Cao Y, Balthasar JP, Jusko WJ. Second-generation minimal physiologically-based pharmacokinetic model for monoclonal antibodies. J Pharmacokinet Pharmacodyn. 2013 Oct;40(5):597-607.
- Article: https://doi.org/10.1007/s10928-013-9332-2
- Source data: Abuqayyas L, Balthasar JP. Int J Pharm. 2012;439(1-2):8-16 (PMID 23018115).
This is the mab8C2 preclinical mouse entry from the
12-fit Cao 2013 mAb cohort. 8C2 is a murine IgG1 anti-topotecan mAb used
by Abuqayyas & Balthasar as a non-binding carrier antibody. The
function name is mab8C2 because R identifiers cannot start
with a digit; the antibody is referred to as 8C2 in the source
publications.
Population
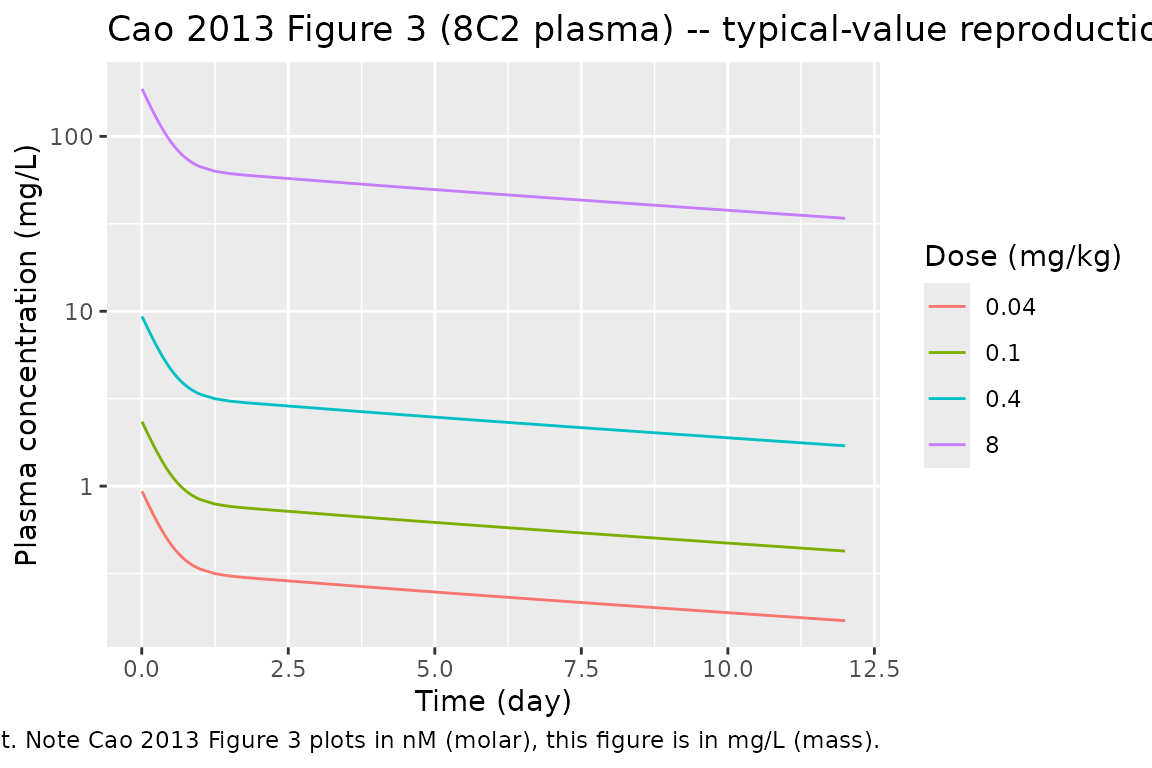
Cao et al. fit the mPBPK model to plasma profiles of 8C2 in mice from Abuqayyas & Balthasar (2012). The mouse system parameters Cao 2013 used for fitting are: V_p = 0.85 mL, ISF = 4.35 mL, total lymph flow = 0.12 mL/hr (= 2.88 mL/day), assumed body weight 20 g, K_p = 0.8 (native IgG1), sigma_L = 0.2. Cao 2013 Figure 3 shows the fitted plasma profiles at four single IV doses: 0.04, 0.1, 0.4, and 8 mg/kg.
Source trace
| Equation / parameter | Value | Source location |
|---|---|---|
| 4-compartment mPBPK ODE system | – | Cao 2013 Eqs 1-4 (Model A) |
sigma1 (vascular reflection coefficient, tight
tissues) |
0.943 | Cao 2013 Table 1 (8C2 Model A; CV 30.7%) |
sigma2 (vascular reflection coefficient, leaky
tissues) |
0.378 | Cao 2013 Table 1 (8C2 Model A; CV 34.2%) |
CLp (plasma clearance) |
0.525e-5 L/hr = 1.260e-4 L/day | Cao 2013 Table 1 (8C2 Model A; CV 46.5%) |
Mouse Vplasma
|
0.85 mL = 0.00085 L | Cao 2013 Table 1 footnote |
| Mouse total ISF volume | 4.35 mL = 0.00435 L | Cao 2013 Table 1 footnote |
| Mouse total lymph flow | 0.12 mL/hr = 2.88 mL/day | Cao 2013 Table 1 footnote |
Virtual cohort
obs_times <- sort(unique(c(seq(0, 1/24, by = 1/240),
                            seq(1/24, 1, by = 1/24),
                            seq(1, 12, by = 0.25))))

# Doses in mg per 20 g mouse: 0.04, 0.1, 0.4, 8 mg/kg -> 0.0008, 0.002, 0.008, 0.16 mg
make_panel <- function(dose_kg, id) {
  rxode2::et(amt = dose_kg * 0.020, cmt = "plasma", id = id) |>
    rxode2::et(time = obs_times, id = id)
}

events <- dplyr::bind_rows(
  as.data.frame(make_panel(0.04, id = 1L)) |> dplyr::mutate(dose_mg_per_kg = 0.04),
  as.data.frame(make_panel(0.1,  id = 2L)) |> dplyr::mutate(dose_mg_per_kg = 0.1),
  as.data.frame(make_panel(0.4,  id = 3L)) |> dplyr::mutate(dose_mg_per_kg = 0.4),
  as.data.frame(make_panel(8,    id = 4L)) |> dplyr::mutate(dose_mg_per_kg = 8)
)
stopifnot(!anyDuplicated(unique(events[, c("id", "time", "evid")])))
Simulation
mod <- readModelDb("Cao_2013_mab8C2")
sim <- rxode2::rxSolve(rxode2::rxode2(mod), events = events,
                       keep = "dose_mg_per_kg") |>
  as.data.frame()
Replicate Figure 3 (8C2 in mice)
sim |>
  dplyr::filter(time > 0) |>
  ggplot2::ggplot(ggplot2::aes(time, Cc, colour = factor(dose_mg_per_kg))) +
  ggplot2::geom_line() +
  ggplot2::scale_y_log10() +
  ggplot2::labs(
    x = "Time (day)", y = "Plasma concentration (mg/L)",
    colour = "Dose (mg/kg)",
    title = "Cao 2013 Figure 3 (8C2 plasma) -- typical-value reproduction",
    caption = "Replicates the dose-escalation plasma panel of 8C2 in mice using the packaged Model A mPBPK fit. Note Cao 2013 Figure 3 plots in nM (molar), this figure is in mg/L (mass)."
  )
PKNCA validation
sim_nca <- sim |>
  dplyr::filter(!is.na(Cc)) |>
  dplyr::transmute(id = id, time = time, conc = Cc,
                   dose_mg_per_kg = dose_mg_per_kg)
dose_df <- events |>
  dplyr::filter(evid == 1) |>
  dplyr::transmute(id = id, time = time, amt = amt,
                   dose_mg_per_kg = dose_mg_per_kg)
conc_obj <- PKNCA::PKNCAconc(sim_nca, conc ~ time | dose_mg_per_kg + id)
dose_obj <- PKNCA::PKNCAdose(dose_df, amt ~ time | dose_mg_per_kg + id)
intervals <- data.frame(start = 0, end = Inf,
                        cmax = TRUE, tmax = TRUE,
                        aucinf.obs = TRUE, half.life = TRUE)
nca <- PKNCA::pk.nca(PKNCA::PKNCAdata(conc_obj, dose_obj, intervals = intervals))
knitr::kable(summary(nca),
caption = "Simulated NCA parameters for Cao 2013 mab8C2 (Model A typical-value fit; single IV in 20 g mouse).")| start | end | dose_mg_per_kg | N | cmax | tmax | half.life | aucinf.obs |
|---|---|---|---|---|---|---|---|
| 0 | Inf | 0.04 | 1 | 0.941 | 0.000 | 12.9 | 6.25 |
| 0 | Inf | 0.10 | 1 | 2.35 | 0.000 | 12.9 | 15.6 |
| 0 | Inf | 0.40 | 1 | 9.41 | 0.000 | 12.9 | 62.5 |
| 0 | Inf | 8.00 | 1 | 188 | 0.000 | 12.9 | 1250 |
Assumptions and deviations
-
Preclinical-only entry. Filed under
inst/modeldb/pharmacokinetics/rather thanspecificDrugs/because nlmixr2lib’sspecificDrugstier is reserved for human drugs. -
No IIV, no residual error. The packaged model is a
structural typical-value mPBPK fit. Cao 2013’s variance model
V_i = (intercept + slope * Y_hat)^2(Eq 9) has its parameter values un-reported, and there is no biological-variability layer over a single mean profile. -
Compartment names deviate from the canonical set
(
plasma,tight,leaky,lymph);checkModelConventions()raises four warnings (one per compartment) and no errors. -
Concentration unit. The packaged model returns
Ccin mg/L. Cao 2013 Figure 3 plots 8C2 in nM (molar units following the original Abuqayyas 2012 measurements). Conversion: nM = (mg/L) / MW(mAb) * 1e6 with MW(mAb) ~ 1.5e5 g/mol (so 1 mg/L ~ 6.67 nM for a typical 150 kDa IgG1). - Mouse system parameters are hard-coded for a 20 g body weight (V_p = 0.85 mL, ISF = 4.35 mL, lymph flow = 2.88 mL/day). These are the values Cao 2013 used during fitting; rescaling for different mouse strains or weights requires recomputing all four physiological constants.
- CV% on fitted parameters is high (30.7% for sigma1, 34.2% for sigma2, 46.5% for CLp) – consistent with Cao 2013’s note that 8C2 had a higher objective-function value (Obj = 772053 vs 5057 for 7E3) reflecting the dose-range data and per-dose precision.