Fluconazole and caspofungin against Candida albicans (Venisse 2008)
Source:vignettes/articles/Venisse_2008_candida_albicans.Rmd
Venisse_2008_candida_albicans.RmdModel and source
Venisse et al. (2008) developed two mechanism-based PK-PD models on the same in vitro Candida albicans (ATCC 3153) preparation, fitted simultaneously in a single NONMEM run:
-
modellib("Venisse_2008_fluconazole")– fluconazole, fungistatic (growth inhibition Imax model). -
modellib("Venisse_2008_caspofungin")– caspofungin, fungicidal (death stimulation Emax model).
The Candida-population parameters (Kg, Kd,
Nmax) are shared across drugs and reproduced identically in
both files; the drug-specific PD parameters (IC50,
Imax; EC50, Emax) are
different.
- Article: https://doi.org/10.1128/AAC.01030-07
Population
The experimental population is an in vitro Candida albicans culture (ATCC 3153 reference strain, NCCLS-susceptible). Six experiments were performed (three fluconazole, three caspofungin), each comprising a drug-free growth control plus three drug arms with different initial concentrations (Table 1 of the paper). The growth medium was RPMI 1640 supplemented with 2% sorbitol; incubation at 37 C in a 400 mL glass flask under continuous magnetic stirring with peristaltic-pump broth renewal calibrated to a 3 h elimination half-life. The starting Candida inoculum was 5 x 10^3 CFU/mL, introduced 4 h before the drug.
The MICs measured for this isolate were:
- Fluconazole MIC = 1.56 ug/mL (NCCLS-susceptible).
- Caspofungin MIC = 0.015 ug/mL (typical of susceptible C. albicans).
The same information is available programmatically via each model’s
population metadata.
Source trace
| Component | Value or form | Source |
|---|---|---|
| Drug PK: 1-compartment IV | d/dt(central) = -kel * central |
Methods, PK-PD analysis |
CL |
1.54 mL/min = 0.0924 L/h (fixed) | Methods, PK-PD analysis |
V |
0.4 L (fixed, bulk flask volume) | Methods, PK-PD analysis |
kel derived |
CL/V = 0.231 1/h (drug t1/2 = 3 h) |
Methods |
| Candida natural growth + death | Eq. 1: dN/dt = (Kg - Kd) * N
|
Page 938, Eq. 1 |
| Saturable growth (Mouton) | Eq. 2: dN/dt = Kg * (1 - N/Nmax) * N - Kd * N
|
Page 938, Eq. 2 |
| With broth renewal | Eq. 3:
dN/dt = Kg * (1 - N/Nmax) * N - Kd * N - Ke * N
|
Page 938, Eq. 3 |
| Fluconazole growth inhibition | Eq. 4:
dN/dt = Kg * (1 - N/Nmax) * (1 - Imax*C/(IC50 + C)) * N - Kd*N - Ke*N
|
Page 938, Eq. 4 |
| Caspofungin death stimulation | Eq. 5:
dN/dt = Kg * (1 - N/Nmax) * N - Emax*C/(EC50 + C) * N - Kd*N - Ke*N
|
Page 938, Eq. 5 |
Kg = 0.864 1/h |
growth rate, SE 0.0321 | Table 2 |
Kd = 0.0414 1/h |
natural death rate, SE 0.0245 | Table 2 |
Nmax = 1.48e6 CFU/mL |
maximum carrying capacity, SE 5.54e5 | Table 2 |
Ke = 0.231 1/h |
broth renewal rate, fixed | Methods, page 938 |
IC50 = 0.0929 ug/mL |
fluconazole IC50, SE 0.0567 | Table 2 |
Imax = 0.675 |
fluconazole maximum fractional inhibition, SE 0.0342 (< 1; see Discussion) | Table 2 |
EC50 = 2.51e-4 ug/mL |
caspofungin EC50, SE 4.62e-5 | Table 2 |
Emax = 0.804 1/h |
caspofungin maximum killing rate, SE 0.0511 | Table 2 |
eta(Nmax) = 225% CV exp. |
omega^2 = log(2.25^2 + 1) = 1.802 (natural-log scale) | Table 2 |
eta(Emax) = 65% CV exp. |
omega^2 = log(0.65^2 + 1) = 0.353 (caspofungin only) | Table 2 |
epsilon flu = 197% CV exp. |
sigma_ln = sqrt(log(1.97^2 + 1)) = 1.259 (additive on log CFU/mL) | Table 2 |
epsilon casp = 96% CV exp. |
sigma_ln = sqrt(log(0.96^2 + 1)) = 0.808 (additive on log CFU/mL) | Table 2 |
Validation strategy
Because the source data are CFU/mL counts under a fixed drug-PK
kernel and the paper does not report NCA-style metrics, PKNCA is not the
appropriate validation target (see
references/endogenous-validation.md in the skill for the
rationale). Instead the vignette walks the typical-value trajectories
under three scenarios:
- Natural growth control (no drug) – confirms the saturable-growth + broth-renewal balance yields the in vitro carrying capacity reported in the paper (~ 1.0e6 CFU/mL – see below for the analytic steady state).
- Figure 3A replication – fluconazole at the six C0 values shown in the paper’s symbols (control, 0.01, 0.1, 1, 10, 100 ug/mL).
- Figure 3B replication – caspofungin at the six C0 values shown in the paper’s symbols (control, 0.001, 0.01, 0.1, 1, 10 ug/mL).
A side-by-side parameter table at the end confirms the file’s typical values agree with Table 2 byte-for-byte.
Analytic steady-state of the drug-free control
With drug absent and Ke = 0.231 1/h active, Equation 3
has steady state where Kg * (1 - N/Nmax) = Kd + Ke.
Plugging the Table 2 typical values:
Kg   <- 0.864
Kd   <- 0.0414
Ke   <- 0.231
Nmax <- 1.48e6
N_ss <- Nmax * (1 - (Kd + Ke) / Kg)
N_ss
#> [1] 1013389
log10(N_ss)
#> [1] 6.005776
So the typical-value plateau is approximately 1.0e6 CFU/mL (log10 ~
6.0), about 68% of the Nmax parameter value (1.48e6
CFU/mL). The remaining gap from Nmax is consumed by the
natural-death (Kd) and broth-renewal (Ke) loss
terms. (The paper’s Discussion also reports that complementary
experiments without broth renewal raised the plateau to ~ 1e8
CFU/mL.)
Virtual cohort: typical-value trajectories
Each cohort below is the typical-value (zero between-experiment
variance) prediction for a single C0 arm. We use the drug-PK kernel from
each model file and dose the bath at t = 4 h to deliver
C0 * V of drug (amt in mg, V in L) so the initial bath
concentration equals the experimental C0.
V_bath <- 0.4   # litres

# rxode2 expects amt in the same mass units the model uses (here, mg in the
# linear-mg/L = ug/mL convention). dose = C0 * V to deliver an initial bath
# concentration of C0 in ug/mL.
mk_events <- function(C0_vec, t_obs = c(0, 4, seq(4.1, 31, by = 0.25)),
                      id_offset = 0L) {
  out <- vector("list", length(C0_vec))
  for (k in seq_along(C0_vec)) {
    id <- id_offset + k
    C0 <- C0_vec[k]
    dose <- C0 * V_bath  # mg
    if (C0 == 0) {
      ev <- rxode2::et(time = t_obs) %>%
        rxode2::et(id = id)
    } else {
      ev <- rxode2::et(amt = dose, time = 4, cmt = "central") %>%
        rxode2::et(time = t_obs) %>%
        rxode2::et(id = id)
    }
    df <- as.data.frame(ev)
    df$C0 <- C0
    out[[k]] <- df
  }
  dplyr::bind_rows(out)
}
C0_flu  <- c(0, 0.01, 0.1, 1, 10, 100)
C0_casp <- c(0, 0.001, 0.01, 0.1, 1, 10)

events_flu  <- mk_events(C0_flu,  id_offset = 0L)
events_casp <- mk_events(C0_casp, id_offset = 100L)

stopifnot(!anyDuplicated(unique(events_flu[, c("id", "time", "evid")])))
stopifnot(!anyDuplicated(unique(events_casp[, c("id", "time", "evid")])))
flu_typical  <- rxode2::zeroRe(flu)
casp_typical <- rxode2::zeroRe(casp)

sim_flu  <- rxode2::rxSolve(flu_typical,  events = events_flu,  keep = "C0")
sim_casp <- rxode2::rxSolve(casp_typical, events = events_casp, keep = "C0")

sim_flu_df  <- as.data.frame(sim_flu)
sim_casp_df <- as.data.frame(sim_casp)

range(sim_flu_df$candida)
#> [1]    5000 1013386
range(sim_casp_df$candida)
#> [1]     155.4566 1013386.4758
Replicate Figure 3A – fluconazole fungistatic time-kill
sim_flu_df %>%
  dplyr::mutate(
    log10_cfu = log10(pmax(candida, 1)),
    label     = ifelse(C0 == 0, "control",
                       sprintf("C0 = %g ug/mL", C0))
  ) %>%
  ggplot(aes(time, log10_cfu,
             colour = factor(C0),
             linetype = factor(C0))) +
  geom_line(linewidth = 0.6) +
  scale_x_continuous(breaks = seq(0, 32, by = 4)) +
  scale_y_continuous(limits = c(3, 7), breaks = seq(3, 7)) +
  labs(
    title    = "Figure 3A replication: fluconazole fungistatic effect",
    subtitle = "Typical-value trajectories at the six C0 symbols in Venisse 2008",
    x        = "Time after inoculum introduction (h)",
    y        = "log10(CFU/mL)",
    colour   = "Initial fluconazole (ug/mL)",
    linetype = "Initial fluconazole (ug/mL)",
    caption  = "Replicates Figure 3A of Venisse 2008. Drug introduced at t = 4 h."
  ) +
  theme_minimal()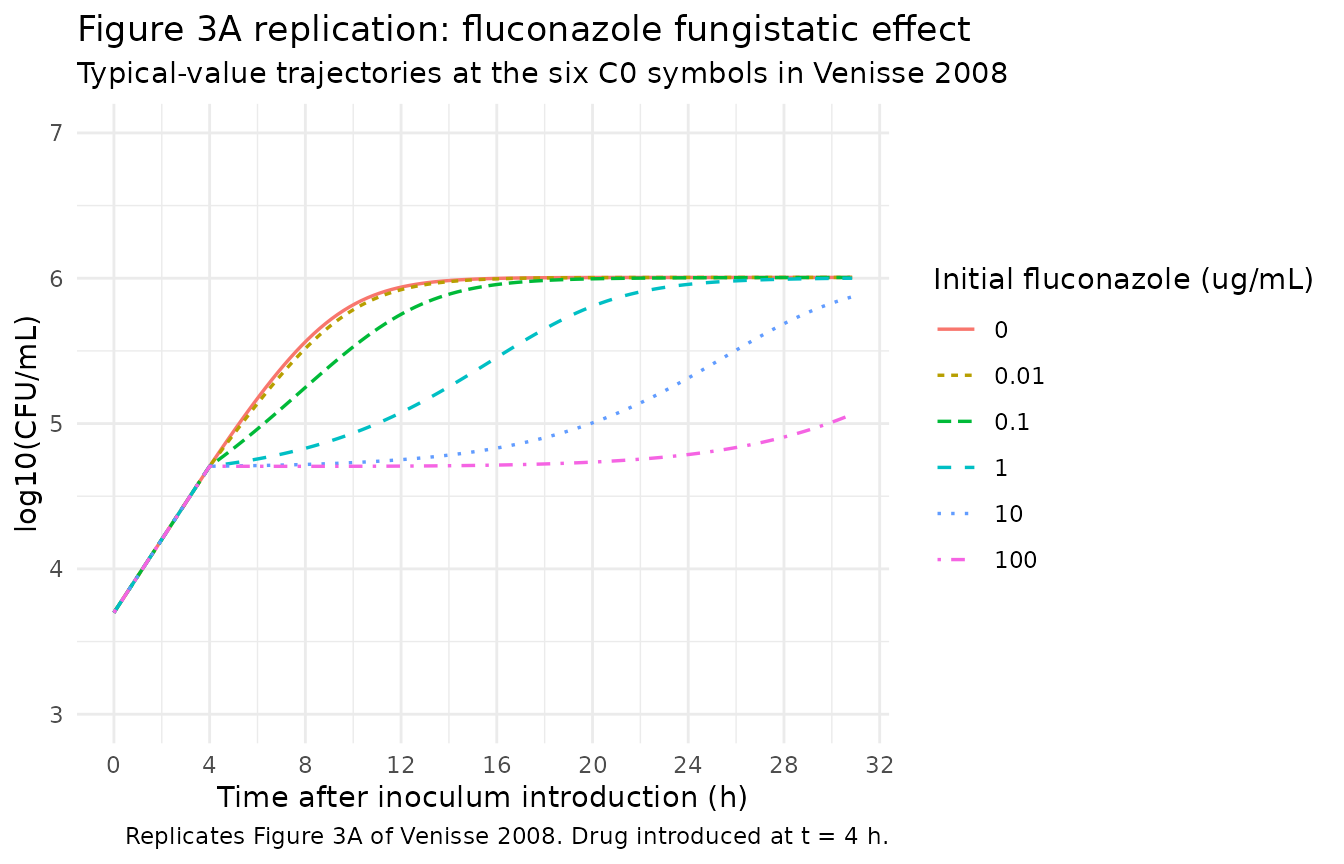
The control curve rises from the 5e3 inoculum to a plateau near
log10(N_ss) ~ 5.67, in line with the analytic steady state above. The
drug arms delay or partially suppress growth in a
concentration-dependent way but never drive a decay phase: because
Imax = 0.675 < 1 the growth rate can be reduced by at
most 67.5%, so the post-drug rate
Kg * (1 - Imax) = 0.864 * 0.325 = 0.281 1/h still exceeds
the loss rate Kd + Ke = 0.272 1/h, leaving a small positive
net growth even at saturating fluconazole concentrations. This matches
the paper’s observation (Discussion paragraph 4: “Candida growth slowed
but was still observed at the highest initial fluconazole
concentrations”).
Replicate Figure 3B – caspofungin fungicidal time-kill
sim_casp_df %>%
  dplyr::mutate(
    log10_cfu = log10(pmax(candida, 1)),
    label     = ifelse(C0 == 0, "control",
                       sprintf("C0 = %g ug/mL", C0))
  ) %>%
  ggplot(aes(time, log10_cfu,
             colour = factor(C0),
             linetype = factor(C0))) +
  geom_line(linewidth = 0.6) +
  scale_x_continuous(breaks = seq(0, 32, by = 4)) +
  scale_y_continuous(limits = c(0, 7), breaks = seq(0, 7)) +
  labs(
    title    = "Figure 3B replication: caspofungin fungicidal effect",
    subtitle = "Typical-value trajectories at the six C0 symbols in Venisse 2008",
    x        = "Time after inoculum introduction (h)",
    y        = "log10(CFU/mL)",
    colour   = "Initial caspofungin (ug/mL)",
    linetype = "Initial caspofungin (ug/mL)",
    caption  = "Replicates Figure 3B of Venisse 2008. Drug introduced at t = 4 h."
  ) +
  theme_minimal()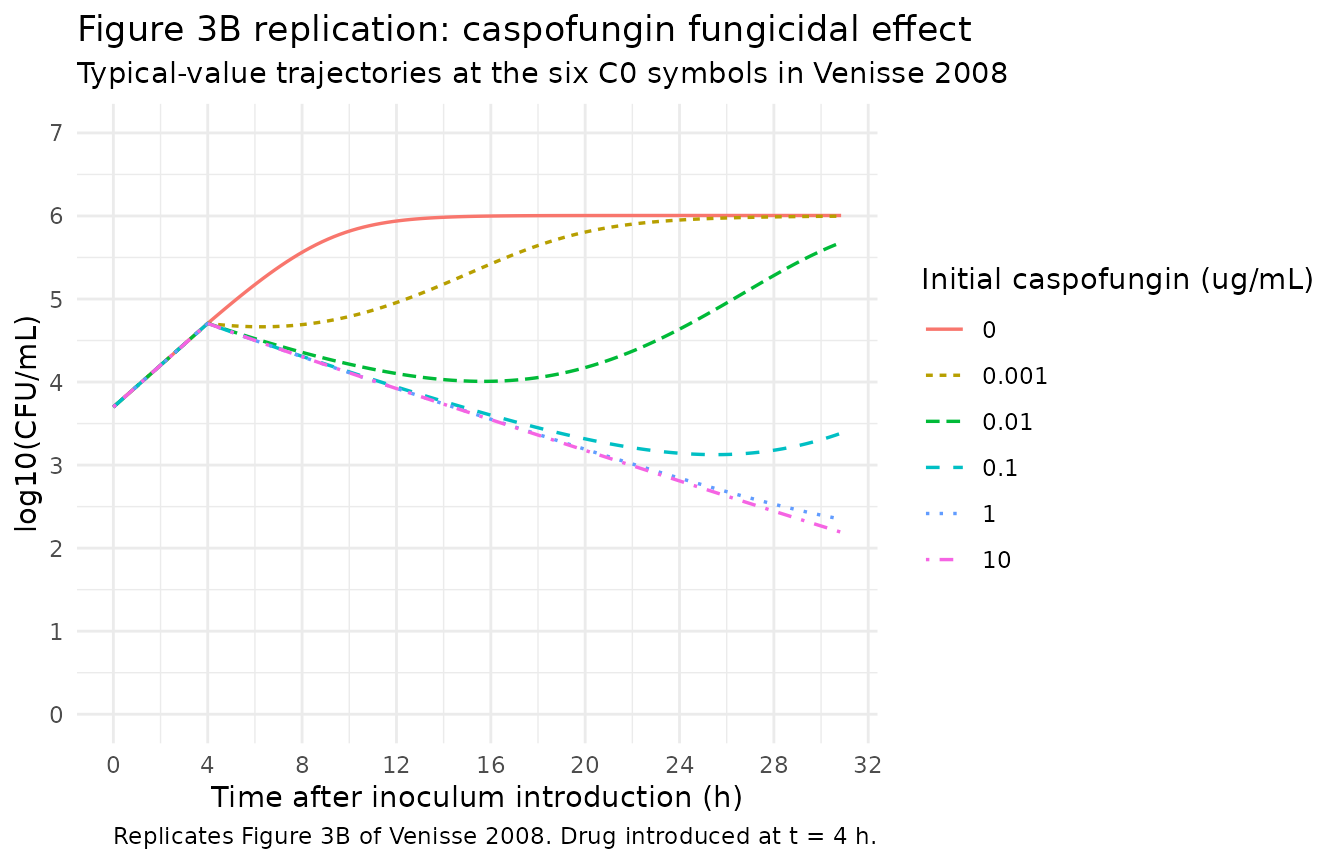
The control curve matches the fluconazole control panel by
construction (same Candida-growth parameters). The treated arms show the
concentration-dependent initial CFU decay followed by regrowth that the
paper highlights as the hallmark of fungicidal activity. Because
EC50 = 2.51e-4 ug/mL is two-to-three orders of magnitude
below the clinical Cmax, even C0 = 0.001 ug/mL induces a measurable
initial decay.
Parameter table
| Parameter | Paper | File |
|---|---|---|
| CL (L/h, fixed) | 0.0924 | 0.0924 |
| V (L, fixed) | 0.4 | 0.4 |
| Ke (1/h, fixed) | 0.231 | 0.231 |
| Kg (1/h) | 0.864 | 0.864 |
| Kd (1/h) | 0.0414 | 0.0414 |
| Nmax (CFU/mL) | 1.48e6 | 1.48e6 |
| IC50 fluconazole (ug/mL) | 0.0929 | 0.0929 |
| Imax fluconazole | 0.675 | 0.675 |
| EC50 caspofungin (ug/mL) | 2.51e-4 | 2.51e-4 |
| Emax caspofungin (1/h) | 0.804 | 0.804 |
| eta(Nmax) (CV%) | 225 | 225 (omega^2 = 1.802) |
| eta(Emax) (CV%) | 65 | 65 (omega^2 = 0.353) |
| epsilon flu (CV%) | 197 | 197 (addSd on log CFU/mL = 1.259) |
| epsilon casp (CV%) | 96 | 96 (addSd on log CFU/mL = 0.808) |
Assumptions and deviations
-
Single-output observation on
Cc. The nlmixr2lib convention names the model’s primary observationCc. For both Venisse modelsCcis the natural log of the Candida CFU/mL count (with a +1 floor to avoid log(0) under saturating caspofungin), not a drug concentration. The drug concentration is the derived quantitycc <- central / vcand is not observed. -
NONMEM exponential residual mapped to additive on log
scale. The paper reports the residual as “exponential” with the
variance summarised as a percent CV on the linear CFU/mL scale (Table 2:
197% for fluconazole, 96% for caspofungin). nlmixr2’s equivalent is an
additive residual on the natural-log-transformed observation; the SD is
sqrt(log(CV^2 + 1)). Both files document the conversion inline next toaddSd. -
Eta on Emax in caspofungin only. The paper’s joint
fit gave
eta(Nmax) = 225% CV(shared between drugs) andeta(Emax) = 65% CV(caspofungin-specific). The fluconazole file therefore carries onlyetalnmax; the caspofungin file carriesetalnmax+etalemax. No IIV was estimated on Imax, IC50, EC50, Kg, or Kd, so none is added here. -
Initial inoculum 5e3 CFU/mL at t = 0. The paper’s
experimental timeline starts at inoculation, with drug introduced 4 h
later. The model files anchor
candida(0) = 5000at simulation time 0; the vignette dosing schedule introduces the drug at t = 4 h to reproduce the experimental timing. -
No covariates. Both files declare
covariateData <- list(). The Venisse experiments are typical-value in vitro with replicate experimental variability captured by the etas; no subject-level covariates are reported or relevant. -
Imax < 1is a paper-specific structural finding. The paper’s Discussion paragraph 4 notes that even at fluconazole concentrations exceeding the MIC by > 200-fold, Candida growth was not fully inhibited; the estimatedImax = 0.675is load-bearing for the fungistatic-vs-fungicidal mechanistic distinction. The packaged file does not constrainImaxto (0, 1) via a logit transform – it carries the typical value 0.675 directly. Re-fits should restore the (0, 1) bound through a transform if intended.