Colistin time-kill against P. aeruginosa with inoculum effect (Bulitta 2010)
Source:vignettes/articles/Bulitta_2010_colistin.Rmd
Bulitta_2010_colistin.RmdModels and source
Three companion model files cover the three P. aeruginosa strains studied:
Bulitta_2010_colistin_PAO1– NONMEM VI primary fit on the PAO1 reference strain (results shown in the paper’s main text and figures).Bulitta_2010_colistin_URMC1– S-ADAPT fit on clinical isolate URMC1 (external qualification).Bulitta_2010_colistin_URMC2– S-ADAPT fit on clinical isolate URMC2 (external qualification).Citation: Bulitta JB, Yang JC, Yohonn L, Ly NS, Brown SV, D’Hondt RE, Jusko WJ, Forrest A, Tsuji BT. (2010). Attenuation of colistin bactericidal activity by high inoculum of Pseudomonas aeruginosa characterized by a new mechanism-based population pharmacodynamic model. Antimicrobial Agents and Chemotherapy 54(5):2051-2062. doi:10.1128/AAC.00881-09.
Article: https://doi.org/10.1128/AAC.00881-09
Population
The packaged models were developed from static in-vitro time-kill experiments in supplemented cation-adjusted Luria-Bertani (LB) broth at 37 C. Each strain was studied across multiple initial inocula (CFUo):
- PAO1 (genetically characterised reference strain from the R.E.W. Hancock Laboratory, University of British Columbia; LB-broth MIC 4.0 mg/L): four initial inocula 10^4, 10^6, 10^8, and 10^9 CFU/mL across 11 colistin concentrations up to 256 mg/L (64x MIC). Sampling at 0, 0.25, 0.5, 1, 2, 3, 4, 8, 12, 16, 24 h.
- URMC1 and URMC2 (two clinical isolates from the University of Rochester Medical Center; LB-broth MIC 1.0 mg/L each): three initial inocula 10^6, 10^8, and 10^9 CFU/mL across 9 colistin concentrations up to 64 mg/L (64x MIC). Sampling at 0, 0.5, 1, 2, 4, 6, 8, 24 h.
There is no human or animal cohort – the models are typical-value
in-vitro PD simulations. The paper reports CV 24% inter-experiment IIV
on the three growth half-lives for PAO1 (NONMEM, jointly parameterised
as a difference in VGmax, Table 1 footnote b); the packaged models omit
these etas and provide deterministic simulation per the Wicha 2017 /
Landersdorfer 2018 in-vitro PD precedent. The complete population
metadata is available via
readModelDb("Bulitta_2010_colistin_PAO1")$population (and
similarly for the two URMC strains).
Mechanism overview
The structural model (Bulitta 2010 Figure 1) has three pieces:
Bacterial population dynamics – three pre-existing subpopulations of different susceptibility to colistin (S = susceptible, I = intermediate, R = least-susceptible) plus a lag compartment that initially holds the susceptible cells. The lag compartment has no growth and no natural death but IS subject to colistin killing and signal-molecule inhibition; a first-order rate constant
klagtransfers cells from the lag compartment into the replicating susceptible compartment. Each replicating subpopulation X (in S, I, R) grows via a saturable Michaelis-Menten-style function with maximal velocity VGmax_X and half-saturation density CFUm, dies first-order at kd = 0.3 /h, and is killed second-order by effective colistin at the target site with rate constant k2X.Receptor occupancy (Bulitta 2010 Eqs. 1-2; Figure 1B) – colistin must competitively displace Mg2+ and Ca2+ from LPS binding sites in the outer membrane to be active at the target site. The fractional occupancy by cations FrCations (Eq. 1) drops as broth colistin rises; the fraction NOT occupied (1 - FrCations) feeds a Hill-10 function (Eq. 2) that produces the effective colistin concentration Ccolistin,eff. Dissociation constants Kd_Cations = 200 umol/L and Kd_Colistin = 0.3 umol/L are FIXED per Schindler & Osborn (1979); the Hill coefficient was initially estimated 10-20 and then FIXED to 10 for stability (Table 1 footnote e).
Signal molecules (Bulitta 2010 Eqs. 4, 5, 10) – all viable bacteria are assumed to synthesise freely diffusible signal molecules whose concentration tracks CFUALL with first-order degradation (kdeg). Through a single Hill-1 function with IC50, signal molecules inhibit both replication (maximum reduction ImaxRep on the growth rate) and killing (maximum reduction ImaxKill on the colistin effect). This is the mechanism that produces the inoculum effect: at high CFUo, signal molecules saturate inhibition and colistin killing is markedly attenuated.
The drug colistin concentration Ccolistin (mg/L) and
cation concentration Ccations (umol/L) are external
time-varying covariates supplied from the data; the model has no human
PK component.
Source trace
Per-parameter source-location comments live inline in the three
.R files next to each ini() entry; the table
below collects them for one-glance audit. All NONMEM PAO1 values come
from Bulitta 2010 Table 1 NONMEM column. URMC1 and URMC2 values come
from the S-ADAPT columns (the only fit reported for those strains).
| Parameter (paper symbol) | File name | PAO1 (NONMEM) | URMC1 | URMC2 | Units | Source |
|---|---|---|---|---|---|---|
| t1/2(kg,low CFU)_S | t12_kg_low_s |
22.2 | 17.9 | 17.0 | min | Table 1 |
| t1/2(kg,low CFU)_I | t12_kg_low_i |
28.7 | 21.7 | 24.8 | min | Table 1 |
| t1/2(kg,low CFU)_R | t12_kg_low_r |
62.4 | 86.8 | 76.2 | min | Table 1 |
| kd (FIXED) | kd_nat |
0.3 | 0.3 | 0.3 | 1/h | Table 1 footnote (a) |
| t1/2(klag) | t12_klag |
1.31 | 1.36 | 0.967 | h | Table 1 |
| log10 POPmax | log10_popmax |
9.59 | 9.68 | 9.16 | log10 CFU/mL | Table 1 |
| log10 CFUo (10^6) | log10_cfu0 |
6.17 | 6.35 | 6.17 | log10 CFU/mL | Table 1 (Log10 CFUo,6) |
| log10 FrI | log10_fr_i |
-3.43 | -3.97 | -4.93 | log10 fraction | Table 1 |
| log10 FrR | log10_fr_r |
-7.19 | -7.16 | -6.18 | log10 fraction | Table 1 |
| log10 FrSig | log10_fr_sig |
-1.89 | -1.96 | -2.50 | log10 ml/CFU | Table 1 |
| log10 IC50 | log10_ic50_sig |
6.17 | 6.27 | 6.07 | log10 | Table 1 |
| t1/2(kdeg) | t12_kdeg |
0.970 | 1.30 | 3.57 | h | Table 1 |
| ImaxRep | imax_rep |
0.422 | 0.569 | 0.111 | fraction | Table 1 |
| ImaxKill | imax_kill |
0.992 | 0.999 | 0.999 | fraction | Table 1 |
| EC50 (receptor) | ec50_rec |
0.537 | 0.316 | 0.123 | unitless | Table 1 |
| Hill (FIXED) | hill_rec |
10 | 10 | 10 | unitless | Table 1 footnote (e) |
| Kd Cations (FIXED) | kdiss_cation |
200 | 200 | 200 | umol/L | Methods + Table 1 footnote (g) |
| Kd Colistin (FIXED) | kdiss_colistin |
0.3 | 0.3 | 0.3 | umol/L | Methods + Table 1 footnote (g) |
| Mm colistin (FIXED) | mw_colistin |
1.163 | 1.163 | 1.163 | mg/umol | Methods, after Eq. 1 |
| k2S | lk2s |
5.72 | 7.88 | 10.4 | L/(mg*h) | Table 1 |
| k2I | lk2i |
0.369 | 0.627 | 0.522 | L/(mg*h) | Table 1 |
| k2R | lk2r |
0.00210 | 0.00573 | 0.00312 | L/(mg*h) | Table 1 |
| Residual SD_CFU | addSd |
0.474 | 0.478 | 0.478 | log10 CFU/mL | Table 1 footnote (h) |
Governing equations (Bulitta 2010 Eqs. 1-10) implemented in
model():
| Equation | Role |
|---|---|
| Eq. 1 | FrCations = Ccations / (Kd_Cations + Ccations + (Kd_Cations/Kd_Colistin) * Ccolistin / Mm) |
| Eq. 2 | Ccolistin_eff = (1 - FrCations)^Hill / (EC50^Hill + (1 - FrCations)^Hill) * Ccolistin |
| Eq. 3 | CFUALL = bact_slag + bact_s + bact_i + bact_r |
| Eq. 4 | INHKill = 1 - ImaxKill * signal / (IC50 + signal) |
| Eq. 5 | INHRep = 1 - ImaxRep * signal / (IC50 + signal) |
| Eq. 6 | d/dt(bact_slag) = (-klag - INHKill * k2S * Ccolistin_eff) * bact_slag |
| Eq. 7 | d/dt(bact_s) = (INHRep * VGmax_S / (CFUm + CFUALL) - kd - INHKill * k2S * Ccolistin_eff) * bact_s + klag * bact_slag |
| Eq. 8 | d/dt(bact_i) = (INHRep * VGmax_I / (CFUm + CFUALL) - kd - INHKill * k2I * Ccolistin_eff) * bact_i |
| Eq. 9 | d/dt(bact_r) = (INHRep * VGmax_R / (CFUm + CFUALL) - kd - INHKill * k2R * Ccolistin_eff) * bact_r |
| Eq. 10 | d/dt(signal) = (CFUALL - signal) * kdeg |
Compartment and observation conventions:
| Compartment | Units | Meaning |
|---|---|---|
bact_slag |
CFU/mL | susceptible-population cells in growth-lag phase |
bact_s |
CFU/mL | replicating susceptible cells |
bact_i |
CFU/mL | intermediate-susceptibility cells |
bact_r |
CFU/mL | least-susceptible (resistant) cells |
signal |
unitless | hypothetical quorum-style signal molecules tracking CFUALL |
Cc |
log10 CFU/mL | observation: log10(CFUALL + 1) |
Growth-function reparameterisation
The paper parameterises growth as
INHRep * VGmax_X / (CFUm + CFUALL) (Eqs. 7-9) but reports
the per-subpopulation low-density growth half-life t1/2(kg,low CFU)_X
and a single shared POPmax instead of VGmax_X and CFUm directly (paper
page 2052, paragraph (ii) Growth model). The packaged model reconstructs
CFUm and VGmax_X inside model() from these reported
parameters by combining:
-
kg_low_X = ln(2) / t1/2(kg,low CFU)_X(definition of half-life) -
VGmax_X = kg_low_X * CFUm(the low-density limit of the saturable form) -
POPmax = VGmax_S / kd - CFUm(the would-be susceptible plateau without signal-molecule inhibition, used to define POPmax; the observed plateau is approximately POPmax * (1 - ImaxRep) per Table 1 footnote c)
giving CFUm = POPmax * kd / (kg_low_S - kd) and
VGmax_X = kg_low_X * CFUm for each subpopulation. This is a
deterministic back-derivation – no information loss.
Helper: build a time-kill scenario
The static time-kill design holds Ccolistin and
Ccations constant over the 24 h window. The helper below
builds an et() event table for an arbitrary combination of
colistin concentration, cation concentration, and initial inoculum. The
initial inoculum is overridden via the params argument to
rxSolve() (the model carries a default
log10_cfu0 of ~6.17, representing the 10^6 CFU/mL
experiments).
mod_pao1  <- readModelDb("Bulitta_2010_colistin_PAO1")  |> rxode2::zeroRe()
#> Warning: No omega parameters in the model
mod_urmc1 <- readModelDb("Bulitta_2010_colistin_URMC1") |> rxode2::zeroRe()
#> Warning: No omega parameters in the model
mod_urmc2 <- readModelDb("Bulitta_2010_colistin_URMC2") |> rxode2::zeroRe()
#> Warning: No omega parameters in the model

# MIC (LB broth) per Bulitta 2010 Methods
MIC_LB <- c(PAO1 = 4.0, URMC1 = 1.0, URMC2 = 1.0)

# Standard supplemented LB broth cation concentration
CATIONS_DEFAULT <- 1138  # umol/L (sum of 0.514 mmol/L Mg2+ + 0.624 mmol/L Ca2+)

build_scenario <- function(mod, label, log10_cfu0, ccolistin,
                           ccations = CATIONS_DEFAULT,
                           times = seq(0, 24, by = 0.25)) {
  ev <- rxode2::et(amt = 0, cmt = "bact_slag", time = 0)
  ev <- rxode2::et(ev, times)
  ev <- as.data.frame(ev)
  ev$Ccolistin <- ccolistin
  ev$Ccations  <- ccations
  params <- mod$theta
  params["log10_cfu0"] <- log10_cfu0
  out <- as.data.frame(rxode2::rxSolve(mod, events = ev, params = params))
  out$scenario  <- label
  out$ccolistin <- ccolistin
  out$ccations  <- ccations
  out$log10_cfu0 <- log10_cfu0
  out
}
Replicate Figure 2 (PAO1 at three inocula)
Bulitta 2010 Figure 2 shows time-kill profiles for three P.
aeruginosa strains at low (10^6, top), intermediate (10^8, middle), and
high (10^9, bottom) initial inocula across a range of colistin
concentrations. The panels below reproduce the PAO1 row for
representative colistin concentrations (growth control, 1x, 4x, 16x, and
64x MIC). The carrying capacity sets the growth-control asymptote at
approximately POPmax * (1 - ImaxRep) = 10^9.35 (paper Table
1 footnote c); regrowth at high concentrations in the 10^6 cohort is the
resistant-subpopulation emergence visible in Figure 3.
inocula <- c("10^6 CFU/mL" = 6.17, "10^8 CFU/mL" = 8.33, "10^9 CFU/mL" = 8.96)
mults   <- c("GC (0xMIC)" = 0, "1xMIC" = 1, "4xMIC" = 4, "16xMIC" = 16, "64xMIC" = 64)

panels_pao1 <- expand.grid(inoc_label = names(inocula),
                           mult_label = names(mults),
                           stringsAsFactors = FALSE)
panels_pao1 <- do.call(rbind, lapply(seq_len(nrow(panels_pao1)), function(i) {
  build_scenario(
    mod_pao1,
    label       = sprintf("%s, %s", panels_pao1$inoc_label[i], panels_pao1$mult_label[i]),
    log10_cfu0  = inocula[[panels_pao1$inoc_label[i]]],
    ccolistin   = mults[[panels_pao1$mult_label[i]]] * MIC_LB[["PAO1"]]
  ) |>
    mutate(inoc_label = panels_pao1$inoc_label[i],
           mult_label = panels_pao1$mult_label[i])
}))

panels_pao1 <- panels_pao1 |>
  mutate(inoc_label = factor(inoc_label, levels = names(inocula)),
         mult_label = factor(mult_label, levels = names(mults)))

ggplot(panels_pao1, aes(time, Cc, color = mult_label)) +
  geom_line(linewidth = 0.7) +
  facet_wrap(~ inoc_label, ncol = 3) +
  scale_y_continuous(limits = c(0, 11), breaks = seq(0, 10, 2)) +
  scale_color_brewer(palette = "Dark2") +
  labs(x = "Time (h)", y = "log10 CFU/mL (Cc)", color = "Colistin (LB MIC = 4 mg/L)",
       caption = "Replicates the PAO1 row of Bulitta 2010 Figure 2 (typical-value).")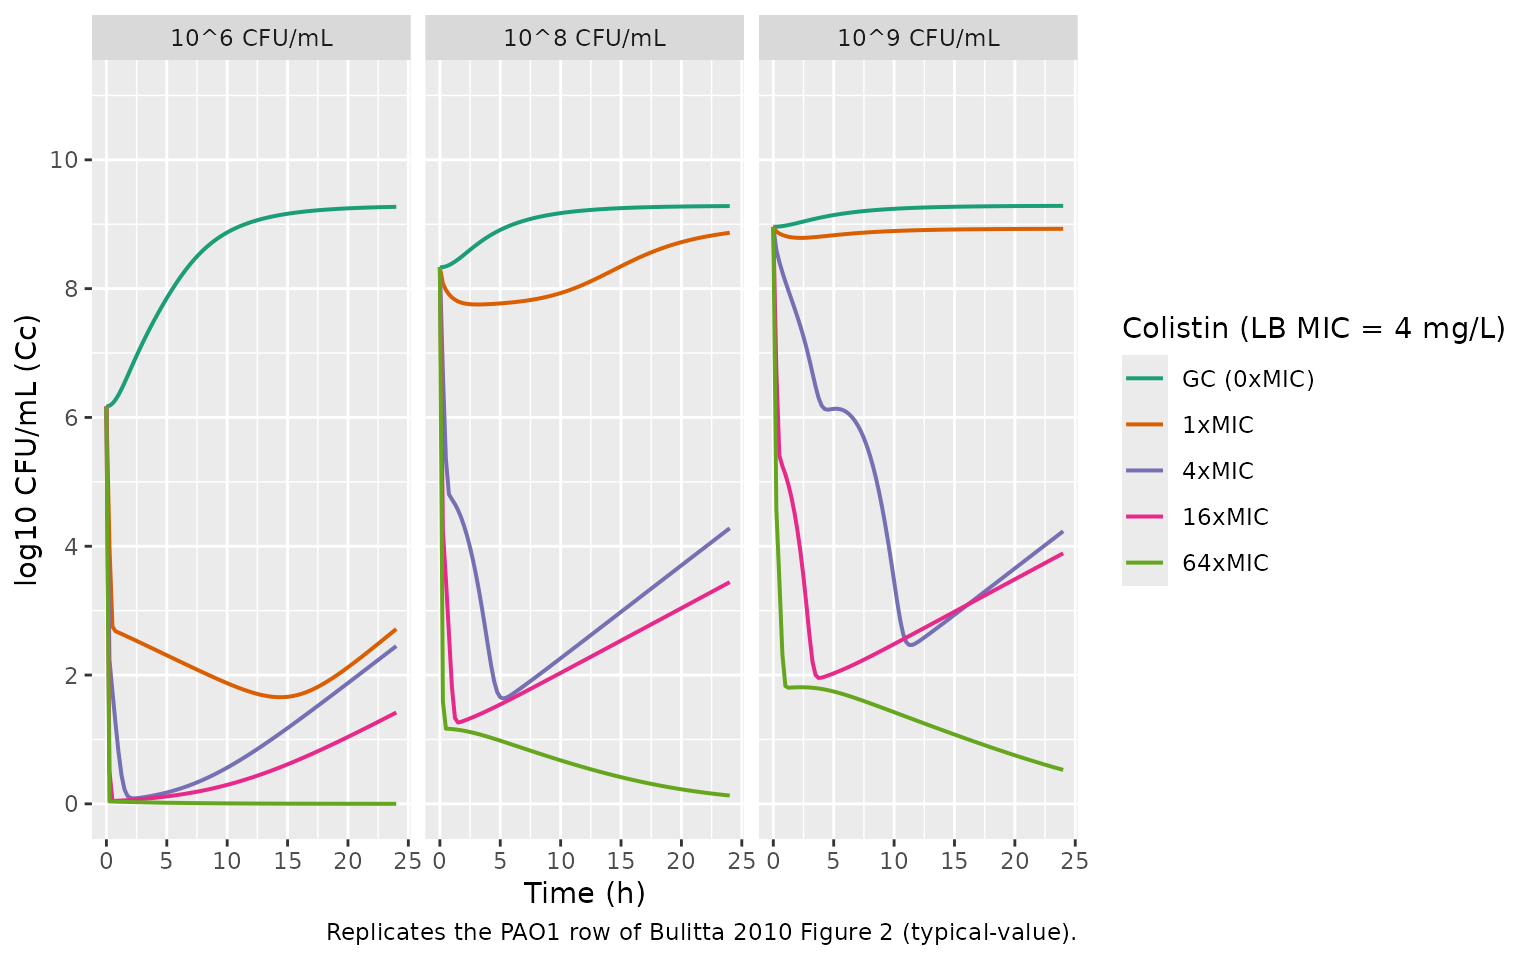
Replicate Figure 2 (URMC1 and URMC2)
The same simulation grid for the two clinical isolates. Their LB-broth MIC is 1 mg/L, four-fold lower than PAO1, so the absolute colistin concentrations at each x-MIC level are correspondingly lower.
urmc_strains <- list("URMC1" = mod_urmc1, "URMC2" = mod_urmc2)
inocula_urmc <- c("10^6 CFU/mL" = 6.31, "10^8 CFU/mL" = 7.94, "10^9 CFU/mL" = 8.51)
# 10^6, 10^8, 10^9 CFUo log10 values averaged across URMC1 (6.35/7.82/8.42) and
# URMC2 (6.17/8.07/8.61) -- Table 1 Log10 CFUo,6/8/9 rows; published values
# used per-strain so the figure mirrors the paper's design.
panels_urmc <- do.call(rbind, lapply(names(urmc_strains), function(strain) {
  this_mod <- urmc_strains[[strain]]
  this_mic <- MIC_LB[[strain]]
  grid <- expand.grid(inoc_label = names(inocula_urmc), mult_label = names(mults),
                      stringsAsFactors = FALSE)
  do.call(rbind, lapply(seq_len(nrow(grid)), function(i) {
    build_scenario(
      this_mod,
      label      = sprintf("%s, %s, %s", strain, grid$inoc_label[i], grid$mult_label[i]),
      log10_cfu0 = inocula_urmc[[grid$inoc_label[i]]],
      ccolistin  = mults[[grid$mult_label[i]]] * this_mic
    ) |>
      mutate(strain = strain,
             inoc_label = grid$inoc_label[i],
             mult_label = grid$mult_label[i])
  }))
}))

panels_urmc <- panels_urmc |>
  mutate(inoc_label = factor(inoc_label, levels = names(inocula_urmc)),
         mult_label = factor(mult_label, levels = names(mults)),
         strain     = factor(strain, levels = c("URMC1", "URMC2")))

ggplot(panels_urmc, aes(time, Cc, color = mult_label)) +
  geom_line(linewidth = 0.7) +
  facet_grid(strain ~ inoc_label) +
  scale_y_continuous(limits = c(0, 11), breaks = seq(0, 10, 2)) +
  scale_color_brewer(palette = "Dark2") +
  labs(x = "Time (h)", y = "log10 CFU/mL (Cc)", color = "Colistin (LB MIC = 1 mg/L)",
       caption = "Replicates URMC1 and URMC2 panels of Bulitta 2010 Figure 2 (typical-value).")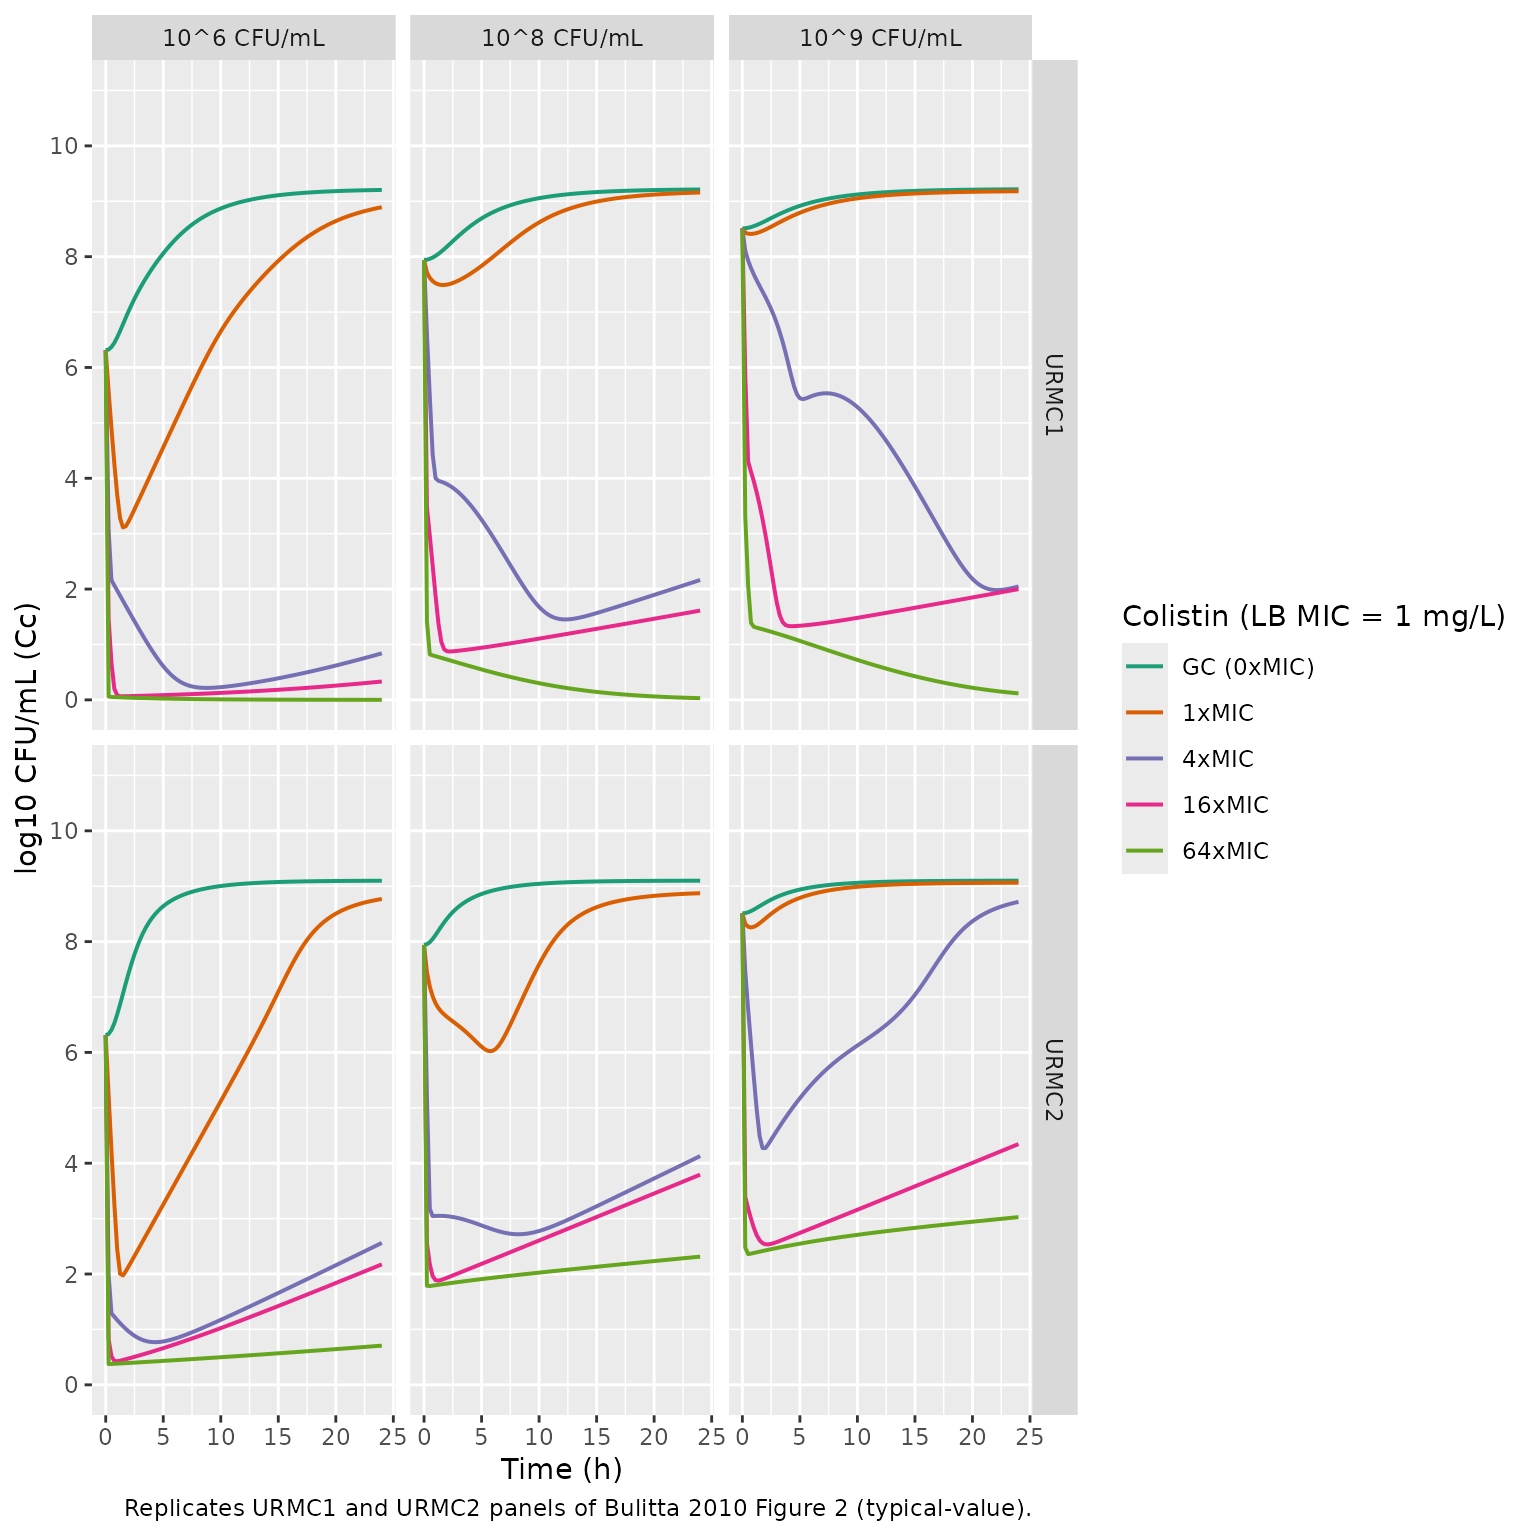
Inoculum effect on apparent kill rate
Bulitta 2010 reports that the apparent kill-rate constant of the
susceptible PAO1 population is “23-fold slower at the 10^9 CFUo and
6-fold slower at the 10^8 CFUo than at the 10^6 CFUo” (abstract and
Results paragraph 1). The mechanism is signal-molecule mediated
inhibition of killing – at high inocula the signal molecules saturate
INHKill toward 1 - ImaxKill (0.008 for PAO1
NONMEM). We extract the apparent susceptible-population kill rate from
the model by simulating a low colistin concentration (just enough to
induce visible killing without rapidly clearing) at each inoculum and
fitting a one-phase log-linear slope over the first 1 h.
cc_test <- 4   # mg/L colistin (1x LB-broth MIC for PAO1)
sims <- bind_rows(lapply(c("10^6" = 6.17, "10^8" = 8.33, "10^9" = 8.96),
                         function(l) {
  build_scenario(mod_pao1, sprintf("CFUo=10^%.2f", l),
                 log10_cfu0 = l, ccolistin = cc_test,
                 times = seq(0, 1, by = 0.02))
}), .id = "cfu0_label")

# Apparent slope of log10(CFU_all) over t in [0, 0.5] h
apparent_kill <- sims |>
  filter(time <= 0.5) |>
  group_by(cfu0_label) |>
  summarise(
    n = n(),
    slope_log10_per_h = coef(lm(Cc ~ time))[["time"]],
    .groups = "drop"
  ) |>
  mutate(kill_rate_h = -slope_log10_per_h * log(10),
         relative_to_10e6 = kill_rate_h / first(kill_rate_h))
apparent_kill |>
  knitr::kable(digits = 3,
caption = sprintf("Apparent susceptible-population kill rate (PAO1, %g mg/L colistin).", cc_test))| cfu0_label | n | slope_log10_per_h | kill_rate_h | relative_to_10e6 |
|---|---|---|---|---|
| 10^6 | 26 | -7.264 | 16.725 | 1.000 |
| 10^8 | 26 | -0.607 | 1.399 | 0.084 |
| 10^9 | 26 | -0.180 | 0.415 | 0.025 |
The relative-to-10^6 column should land in the rough neighbourhood of the paper’s reported 6-fold (10^8) and 23-fold (10^9) attenuations; the exact numbers depend on the window chosen and on the integration of the lag compartment, but the qualitative pattern is preserved.
Key qualitative checks
Growth control plateau (PAO1). With no drug, total
CFU/mL must climb from 10^cfu0 and approach
POPmax * (1 - ImaxRep) (Bulitta 2010 Table 1 footnote c).
For PAO1 NONMEM this expected plateau is
10^9.59 * (1 - 0.422) = 10^9.35.
gc <- panels_pao1 |> filter(inoc_label == "10^6 CFU/mL", mult_label == "GC (0xMIC)")
sprintf("PAO1 GC at  0 h: log10 CFU/mL = %.2f", gc$Cc[gc$time == 0])
#> [1] "PAO1 GC at  0 h: log10 CFU/mL = 6.17"
sprintf("PAO1 GC at 24 h: log10 CFU/mL = %.2f", gc$Cc[gc$time == 24])
#> [1] "PAO1 GC at 24 h: log10 CFU/mL = 9.27"
sprintf("Expected asymptote = log10(10^9.59 * (1 - 0.422)) = %.2f", log10(10^9.59 * (1 - 0.422)))
#> [1] "Expected asymptote = log10(10^9.59 * (1 - 0.422)) = 9.35"
Rapid killing at low inoculum and high colistin.
Bulitta 2010 Results: “concentrations of >= 16x the MIC resulted in
bacterial reductions to undetectable concentrations within 30 min” (for
the 10^6 CFUo). The model should drive Cc toward zero on
that schedule.
rapid <- panels_pao1 |>
  filter(inoc_label == "10^6 CFU/mL", mult_label == "16xMIC", time <= 0.6) |>
  arrange(time)
rapid |>
  select(time, Cc) |>
  knitr::kable(digits = 3,
caption = "PAO1 at 10^6 CFU/mL inoculum, 16x MIC colistin (64 mg/L) -- early kinetics.")| time | Cc |
|---|---|
| 0.00 | 6.170 |
| 0.25 | 0.518 |
| 0.50 | 0.048 |
Attenuation at high inoculum. At 10^9 CFUo the same colistin concentrations produce markedly less log10 CFU reduction.
attn <- panels_pao1 |>
  filter(mult_label == "16xMIC", time %in% c(0, 1, 4, 24)) |>
  select(inoc_label, time, Cc) |>
  arrange(inoc_label, time)
attn |>
  knitr::kable(digits = 3,
caption = "PAO1 at 16x MIC colistin: log10 CFU/mL by inoculum and time.")| inoc_label | time | Cc |
|---|---|---|
| 10^6 CFU/mL | 0 | 6.170 |
| 10^6 CFU/mL | 1 | 0.049 |
| 10^6 CFU/mL | 4 | 0.094 |
| 10^6 CFU/mL | 24 | 1.418 |
| 10^8 CFU/mL | 0 | 8.330 |
| 10^8 CFU/mL | 1 | 1.809 |
| 10^8 CFU/mL | 4 | 1.452 |
| 10^8 CFU/mL | 24 | 3.442 |
| 10^9 CFU/mL | 0 | 8.960 |
| 10^9 CFU/mL | 1 | 5.115 |
| 10^9 CFU/mL | 4 | 1.960 |
| 10^9 CFU/mL | 24 | 3.890 |
Cation effect (qualitative replication of Figure 7)
Bulitta 2010 Figure 7 shows the impact of cation concentration on
colistin killing: EDTA-chelated broth enhances colistin killing (panel
A), addition of cations (panels C-E) progressively inhibits it. We
replicate the qualitative trend at 10^6 CFUo and a representative
colistin concentration of 16 mg/L by varying Ccations.
# Five cation conditions per Bulitta 2010 Methods bullet (iii)
cation_set <- c(
  "EDTA-chelated (60 umol/L free)" = 60,
  "No cations added (estimated free 60 umol/L)" = 60,
  "10 mg/L Ca2+ + 5 mg/L Mg2+ (456 umol/L)" = (10/40.08 + 5/24.305) * 1000,
  "20 mg/L Ca2+ + 10 mg/L Mg2+ (911 umol/L)" = (20/40.08 + 10/24.305) * 1000,
  "80 mg/L Ca2+ + 40 mg/L Mg2+ (3644 umol/L)" = (80/40.08 + 40/24.305) * 1000
)
# de-duplicate the first two (paper assigns the same free Mg/Ca estimate to both)
cation_set <- cation_set[c(1, 3, 4, 5)]
panels_cat <- bind_rows(lapply(names(cation_set), function(lbl) {
  build_scenario(mod_pao1, lbl,
                 log10_cfu0 = 6.17,
                 ccolistin  = 16,
                 ccations   = cation_set[[lbl]])
})) |> mutate(scenario = factor(scenario, levels = names(cation_set)))

ggplot(panels_cat, aes(time, Cc, color = scenario)) +
  geom_line(linewidth = 0.7) +
  scale_y_continuous(limits = c(0, 11), breaks = seq(0, 10, 2)) +
  labs(x = "Time (h)", y = "log10 CFU/mL (Cc)", color = "Broth cations",
       caption = "Qualitative replication of Bulitta 2010 Figure 7 (PAO1, 16 mg/L colistin, 10^6 CFUo).")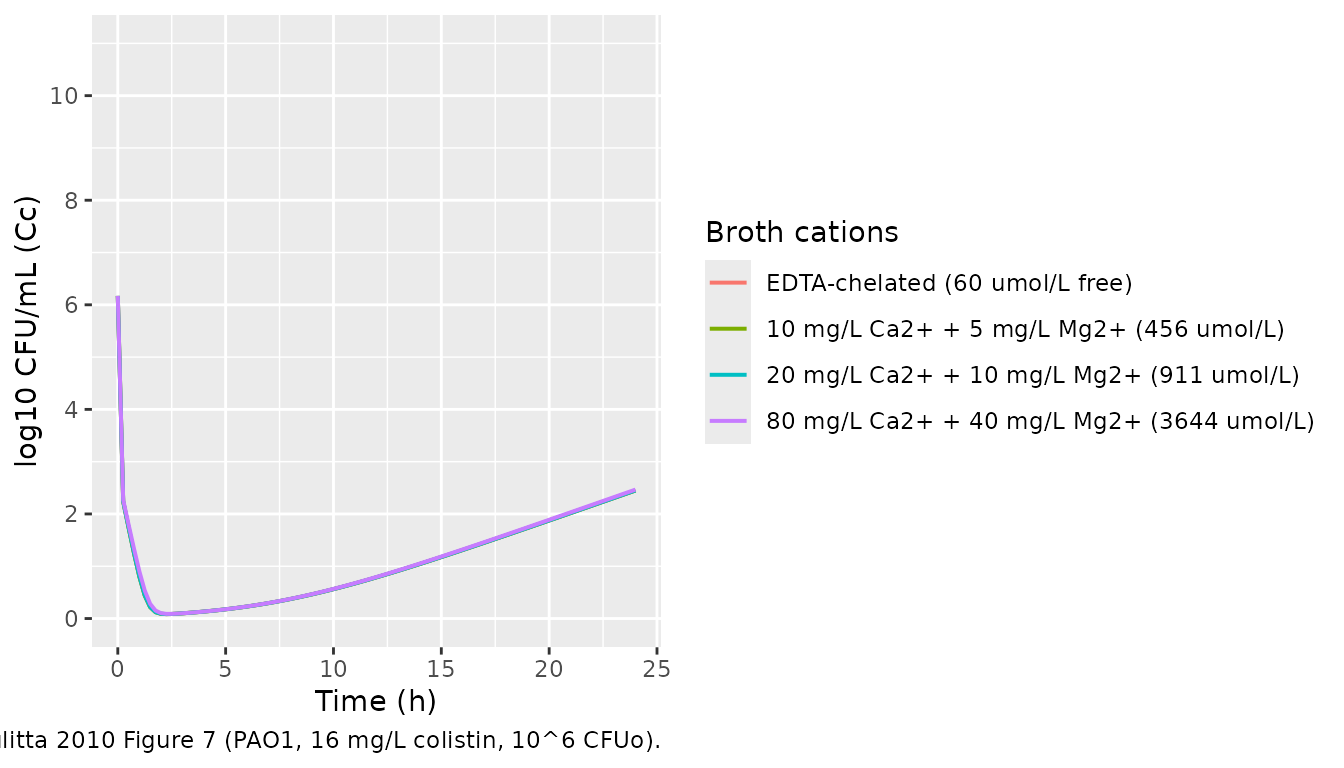
Assumptions and deviations
- PAO1 is the primary NONMEM fit; URMC1 / URMC2 are S-ADAPT fits. The paper reports both NONMEM and S-ADAPT estimates for PAO1 (Table 1, NONMEM column for “results shown” + S-ADAPT column for cross-method comparison) and S-ADAPT only for URMC1 / URMC2 (the paper’s primary cross-strain external qualification). The three packaged model files use NONMEM for PAO1 and S-ADAPT for the URMC strains, matching the paper’s narrative.
- No random effects. The paper reports CV 24% IIV on the three growth half-lives (joint, parameterised as a difference in VGmax) for PAO1 NONMEM (Table 1 footnote b), and CV 12% for PAO1 S-ADAPT, but no etas for URMC1 / URMC2 (Table 1). The packaged models omit all etas for typical- value simulation, consistent with the Wicha 2017 and Landersdorfer 2018 in-vitro PD precedents in this package. Downstream users wanting to simulate replicate variability should add etas manually.
-
Initial-inoculum override via
log10_cfu0parameter. The defaultlog10_cfu0is the Table 1 Log10 CFUo,6 value for each strain (i.e. the 10^6 CFU/mL design). To simulate the 10^4, 10^8, or 10^9 CFUo experiments, override via theparamsargument torxSolve()(the helperbuild_scenariodoes this). The “set to zero if less than 1 cell would have been expected in 20 mL of broth” piecewise rule (paper paragraph after Eq. 9; relevant at 10^4 inocula where 10^-7.19 * 2e5 = 0.013 cells in the least-susceptible subpopulation) is NOT implemented – the model always initialises at FrR * cfu0 (a value of ~0.013 cells/mL evolves identically under the ODE as 0 cells/mL would, so the simulation behaviour is unaffected). -
Cation concentration is the supplemented broth concentration
(1138 umol/L by default), not the EDTA-derived free-ion estimate (60
umol/L). Per Table 1 footnote (f), Bulitta 2010 fit the
receptor-occupancy model with the SUPPLEMENTED sum 0.514 mmol/L Mg2+ +
0.624 mmol/L Ca2+ = 1.138 mmol/L (the EC50 estimate absorbs the
difference between supplemented and free-ion concentrations). Users
simulating the EDTA / cation-chelated experiments should set
Ccationsto the free-ion estimate (60 umol/L). - No PKNCA validation. This is an in-vitro PD model with constant drug concentrations and no PK; NCA parameters (Cmax / Tmax / AUC / half-life) do not apply. Validation here consists of replicating published time-kill figures (Figures 2 + 7 of the paper) and verifying the published carrying- capacity asymptote, the rapid kill at low inoculum, and the inoculum effect on apparent kill rate – matching the validation pattern of the three precedent in-vitro PD vignettes (Wicha 2017, Landersdorfer 2018, Sadouki 2025).
- External qualification datasets (Gunderson et al., Li et al.). The paper externally qualifies the structural model by reestimating selected growth and killing parameters against two literature time-kill datasets (Bulitta 2010 Results paragraph “external model qualification”; references 31 and 41). The packaged models reproduce the PAO1 / URMC1 / URMC2 in-house fits only – the Gunderson and Li reestimates are not packaged.
-
Cooperativity of cation displacement. The Hill
coefficient on the receptor occupancy was initially estimated to fall
between 10 and 20 and was then FIXED at 10 to improve model stability
(Table 1 footnote e). The packaged models use
hill_rec <- fixed(10).