Plot rxode2 objects
See also
Other rxode2 plotting:
is.rxStackData(),
rxStack(),
rxTheme(),
stat_amt(),
stat_cens()
Examples
# \donttest{
mod <- function() {
ini({
tka <- log(1.1)
tcl <- log(3)
tv <- log(30)
})
model({
ka <- exp(tka)
cl <- exp(tcl)
v <- exp(tv)
d/dt(depot) <- -ka * depot
d/dt(central) <- ka * depot - cl / v * central
cp <- central / v
})
}
s <- rxSolve(mod, et(amt = 100) |> et(seq(0, 24, by = 0.5)))
#>
#>
#> ℹ parameter labels from comments are typically ignored in non-interactive mode
#> ℹ Need to run with the source intact to parse comments
#>
#>
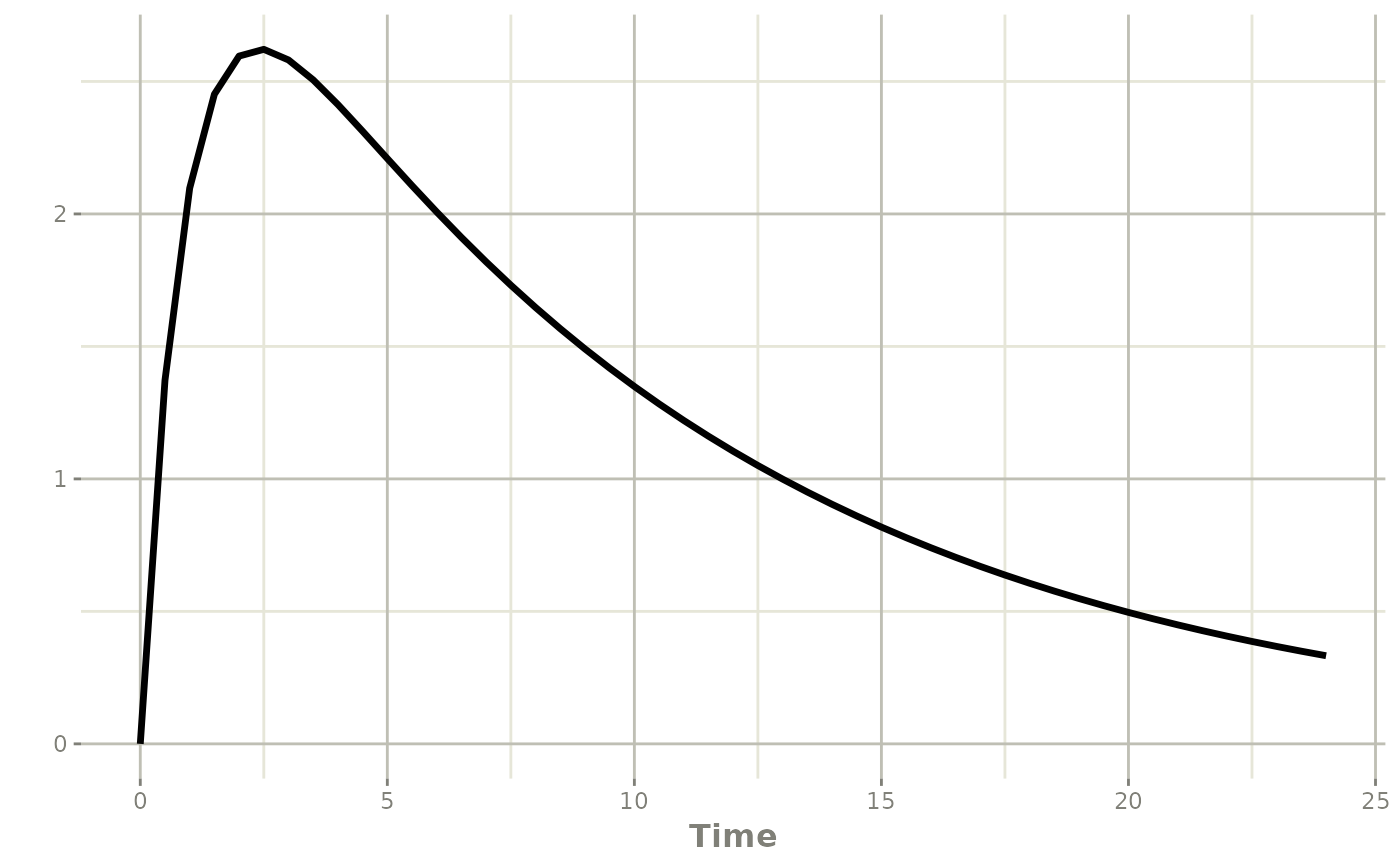
plot(s, cp)
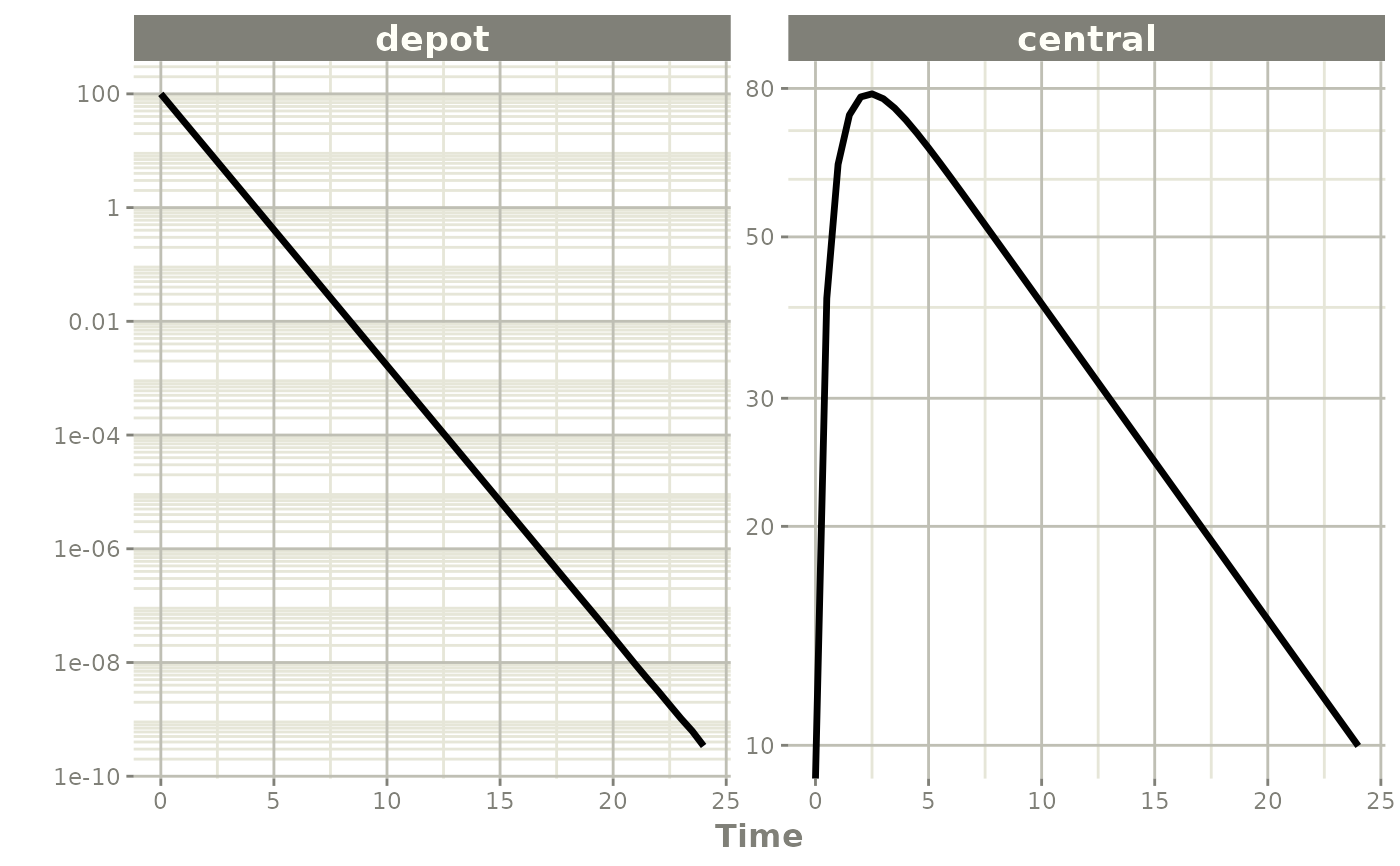
 plot(s, c("depot", "central"), log = "y")
#> Warning: some requested items do not exist in the solved object and were ignored: c
#> Warning: log-10 transformation introduced infinite values.
 # }